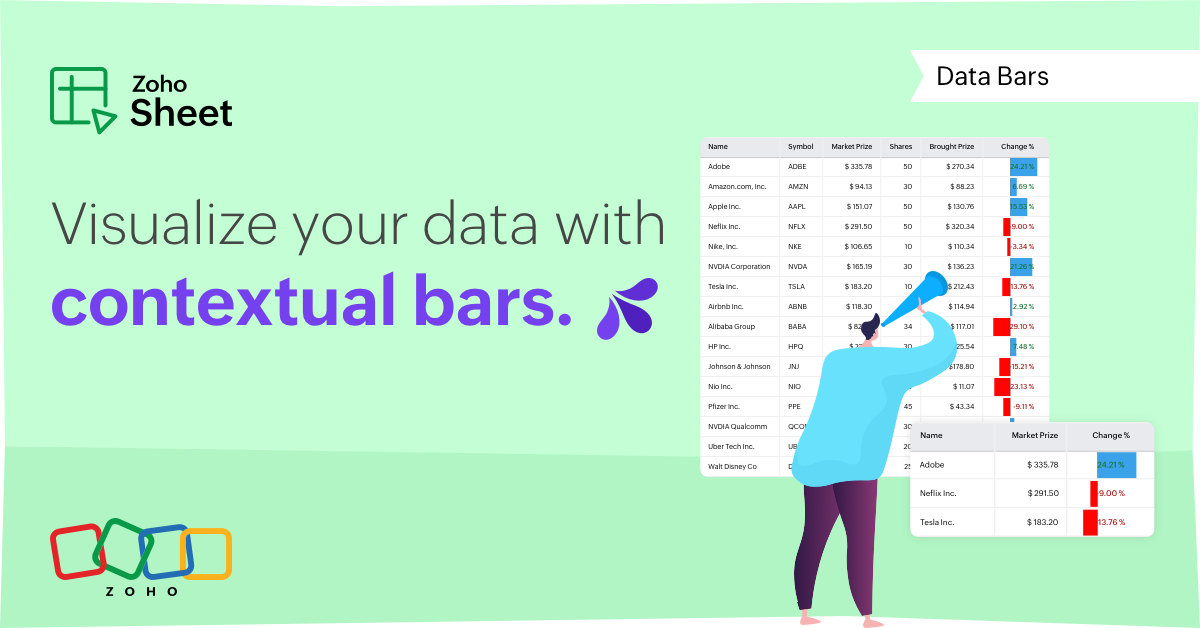
Introducing Data Bars: Graphically represent changes in data within the cells
Conditional formatting has helped millions of spreadsheet users analyze and highlight their data more efficiently. In addition to the classic rules, color scales, and icon sets available in Zoho Sheet, you can now apply Data Bars, a convenient method of visually analyzing the values in a cell range.
What are Data Bars?
Data Bars are cell-level bars that can be used to visually represent the position of a value in a given range, with longer bars representing higher values. This helps users summarize data sets at a glance. Let's say you have a monthly sales report and wish to see which months have the highest and lowest sales figures. Find these results in an instant using Data Bars!
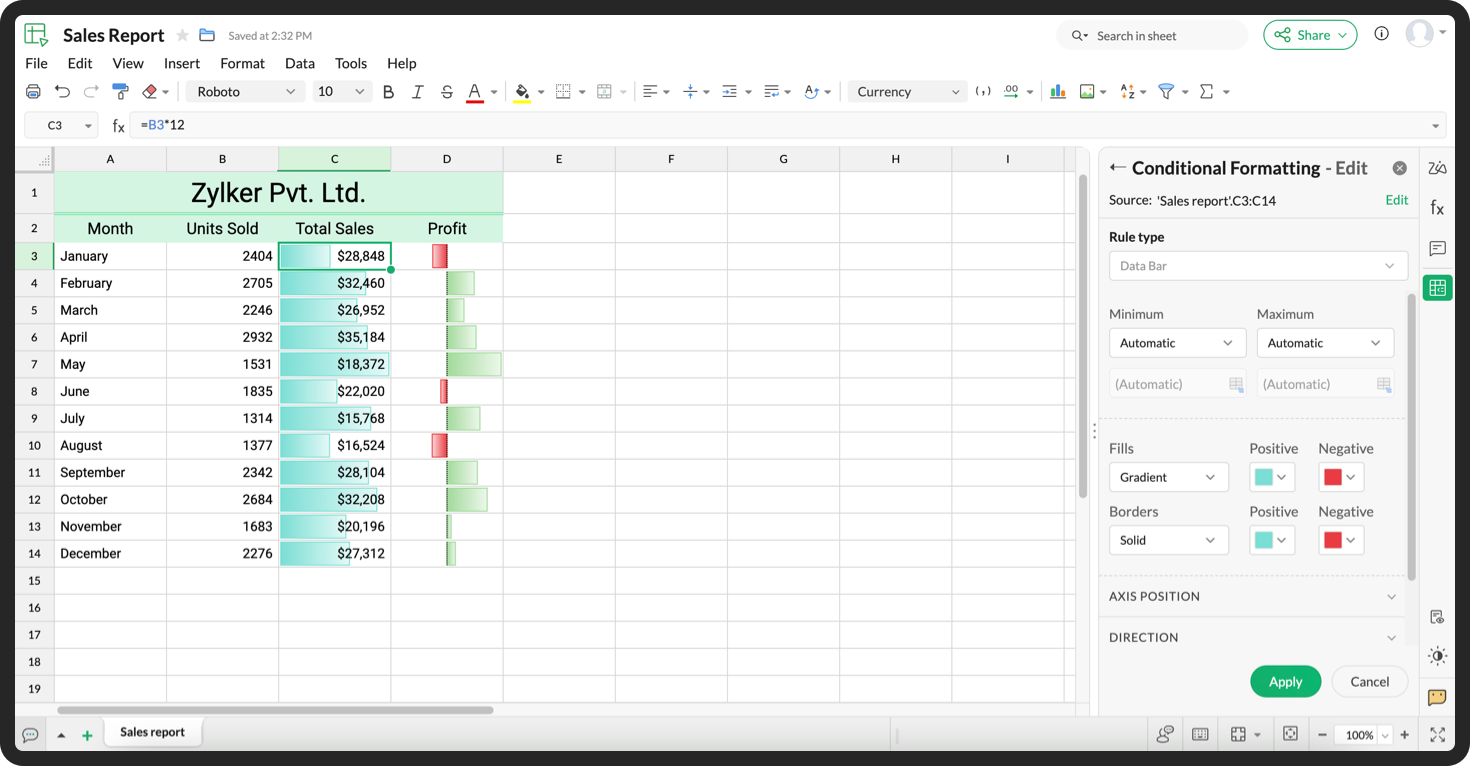
Customizations
Customize your data bars, by adjusting the border, color, and gradient of your bars. You can also choose the direction of the bars and the axis position in the cell, and hide cell content so that only your bars are displayed.
You can also use Data Bars in combination with other conditional formats, like color scales, to analyze your data. Not sure how to get started? Zia now offers suggestions on conditional formatting too!
Read more