The Social Playbook April edition: KPIs in marketing

In any field, analyzing performance is essential to understand growth and know what’s working. The same applies to marketing. Tracking and analyzing Key Performance Indicators (KPIs) helps you make smarter, data-driven decisions instead of relying on guesswork.
Let’s explore the top KPIs in marketing that actually matter and how to use them effectively.
Top KPIs in marketing
Click-through rate (CTR)
CTR is the percentage of people who click on your ad and visit your website or app. It shows how compelling your creative and message are to the audience it reaches.

How to interpret
- High CTR: Your ad is attracting the right audience, and your creative is working well. The next step is to convert that interest into action (sign-ups or purchases).
- Low CTR: Your ad or creative isn’t compelling enough to get clicks. It could be due to weak messaging, unclear value, or targeting the wrong audience.
Benchmark
- Below 1%: Need to improve
- 1 - 3%: Good
- 3% and above: Strong
How to improve
- Use a strong visual hook. The first 2 seconds matter the most.
- Write CTAs that create curiosity or urgency, not just "Learn more"
- Test different formats like carousel, video, or static.
Conversion rate (CR)
CR is the percentage of people who complete a desired action after clicking your ad, such as signing up or making a purchase. It shows whether your ad is actually driving results.

How to interpret
- High rate: Your message, audience, and offer are aligned.
- Low rate: People may click your ads, but they aren't convinced enough to take action.
Benchmark
- Below 2%: Need to improve
- 2 - 5%: Good (varies by industry)
- 5% and above: Strong
How to improve
- Match your ad copy to your landing page.
- A/B test your CTA. For instance, "Start free trial" beats "Submit"
- Retarget warm audiences who have already visited your page
Return on ad spend (ROAS)
ROAS is the revenue earned for every dollar spent on ads. It indicates whether your ad spend is generating returns. This is one of the clearest measures of profitability.

How to interpret
- 1x ROAS = break-even
- Most brands aim for 3 - 5x, but this depends on profit margins.
- 2x ROAS can be profitable for high-margin products
Benchmark
- 3–4x (depending on margins): Good
How to improve
- Focus budget on top-converting audiences and cut the rest.
- Optimize landing pages and improve the post-click experience.
- Run retargeting campaigns and focus on high-performing ads.
Customer lifetime value (CLV)
CLV is the total revenue a customer brings over their entire relationship with your brand. It shows how valuable a customer is in the long run.

How to interpret
- High CLV: You have loyal customers and can afford to spend more to acquire them.
- Low CLV: Customers don’t return or don’t spend much
Benchmark
- CLV should be higher than CAC
- Ideal: CLV to CAC ratio = 3:1
How to improve
- Focus on retention, as keeping a customer is more cost-effective than acquiring a new one.
- Use upsell and cross-sell strategies.
- Build loyalty programs and reward repeat buyers.
- Stay connected through email, social media, and community building.
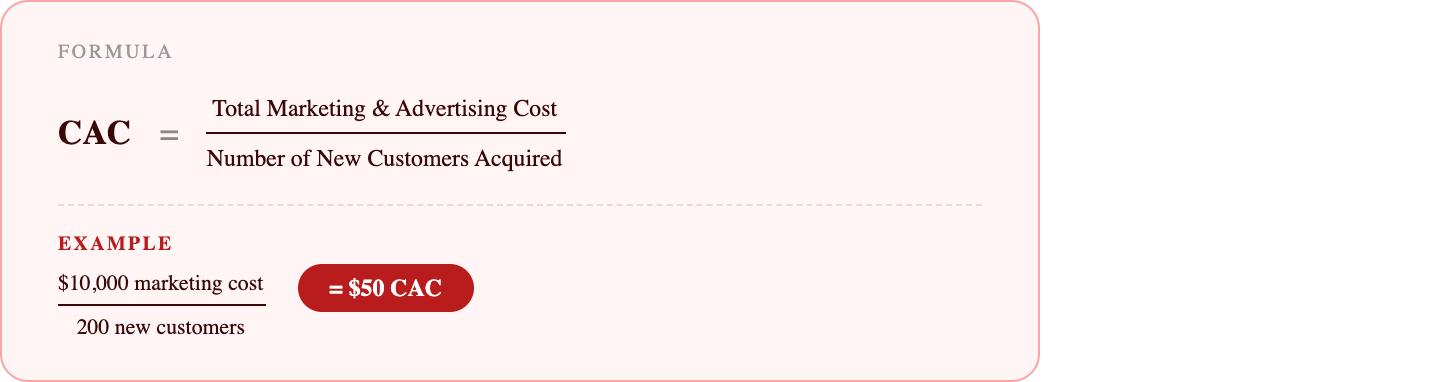
Cost per customer acquired (CAC)
CAC is how much you spend to acquire one new customer. This includes ad spend, tools, and other marketing costs. It shows how efficiently your marketing is working.
How to interpret
- High CAC: You’re spending too much to acquire each customer, which reduces profitability.
- Low CAC: You’re acquiring customers efficiently at a lower cost.
Benchmark
- Your CAC must be lower than the profit a customer brings in over time (CLTV), or your business model is at risk.
- Ideal: CAC to CLV ratio = 1:3 (Spend $1 → Earn $3 over time)
How to improve
- Experiment with different channels
- Retarget interested users instead of finding new ones
- Focus on high-performing channels
Engagement rate (ER)
ER shows how much people interact with your content (likes, comments, shares, saves). It tells you if your content is actually connecting with your audience.

How to interpret
- Higher ER: Your content resonates with your audience, and they actively engage with it.
- Lower ER: Your content may be seen (reach), but people aren’t engaging with it—they’re scrolling past.
Benchmark
Engagement rate varies by platform and audience size
- 1 - 3%: Average
- 3 - 6%: Good
- 6%+: Strong
How to improve
- Post when your audience is most active (use analytics or tools like SmartQ in Zoho Social)
- Ask questions, use polls, and give people a reason to respond
- Reply to comments quickly to boost interaction and signal activity
When you track the right KPIs, you stop guessing and start growing. Use these insights to refine your strategy and make every campaign count.
Stay tuned for the May edition of The Social Playbook.