Forecast performance analysis
Last modified on 15/05/2023: Performance analysis in forecasts is now available for all Zoho CRM users in all DCs. Note that it was an early access feature available only upon request. As of May 10, 2023, it is rolled out for all Zoho CRM accounts. Find out more about forecasts in our help doc.
Hello everyone!
Hello everyone!
We are thrilled to announce an exciting update on comprehensive performance analysis for CRM forecasts, including trends, gap reasons, improvement suggestions, and more.
Forecasts help organizations estimate how sales will progress in the approaching months, quarters, or fiscal years, as well as monitor current sales growth and find ways to accelerate it. They yield important insights into the company's performance and enable businesses to plan upcoming activities accordingly.
In the revamped forecast, until now, we provided the Target Achievement Report page, which showed the targets set for different roles within the organization, their achievements, and the number of open deals they had in a hierarchy. We're introducing a few enhancements to forecasts to provide even more details about performance, as well as an overview—which can be found in the User and Roles Performance pages and Forecast Overview section of the Target Achievement Report page.
We've introduced the following:
- Performance Trend
- Achievement Comparison
- Comparison Across Forecast
- Current Deals by Stages
- Reasons for Gaps
- Improvements
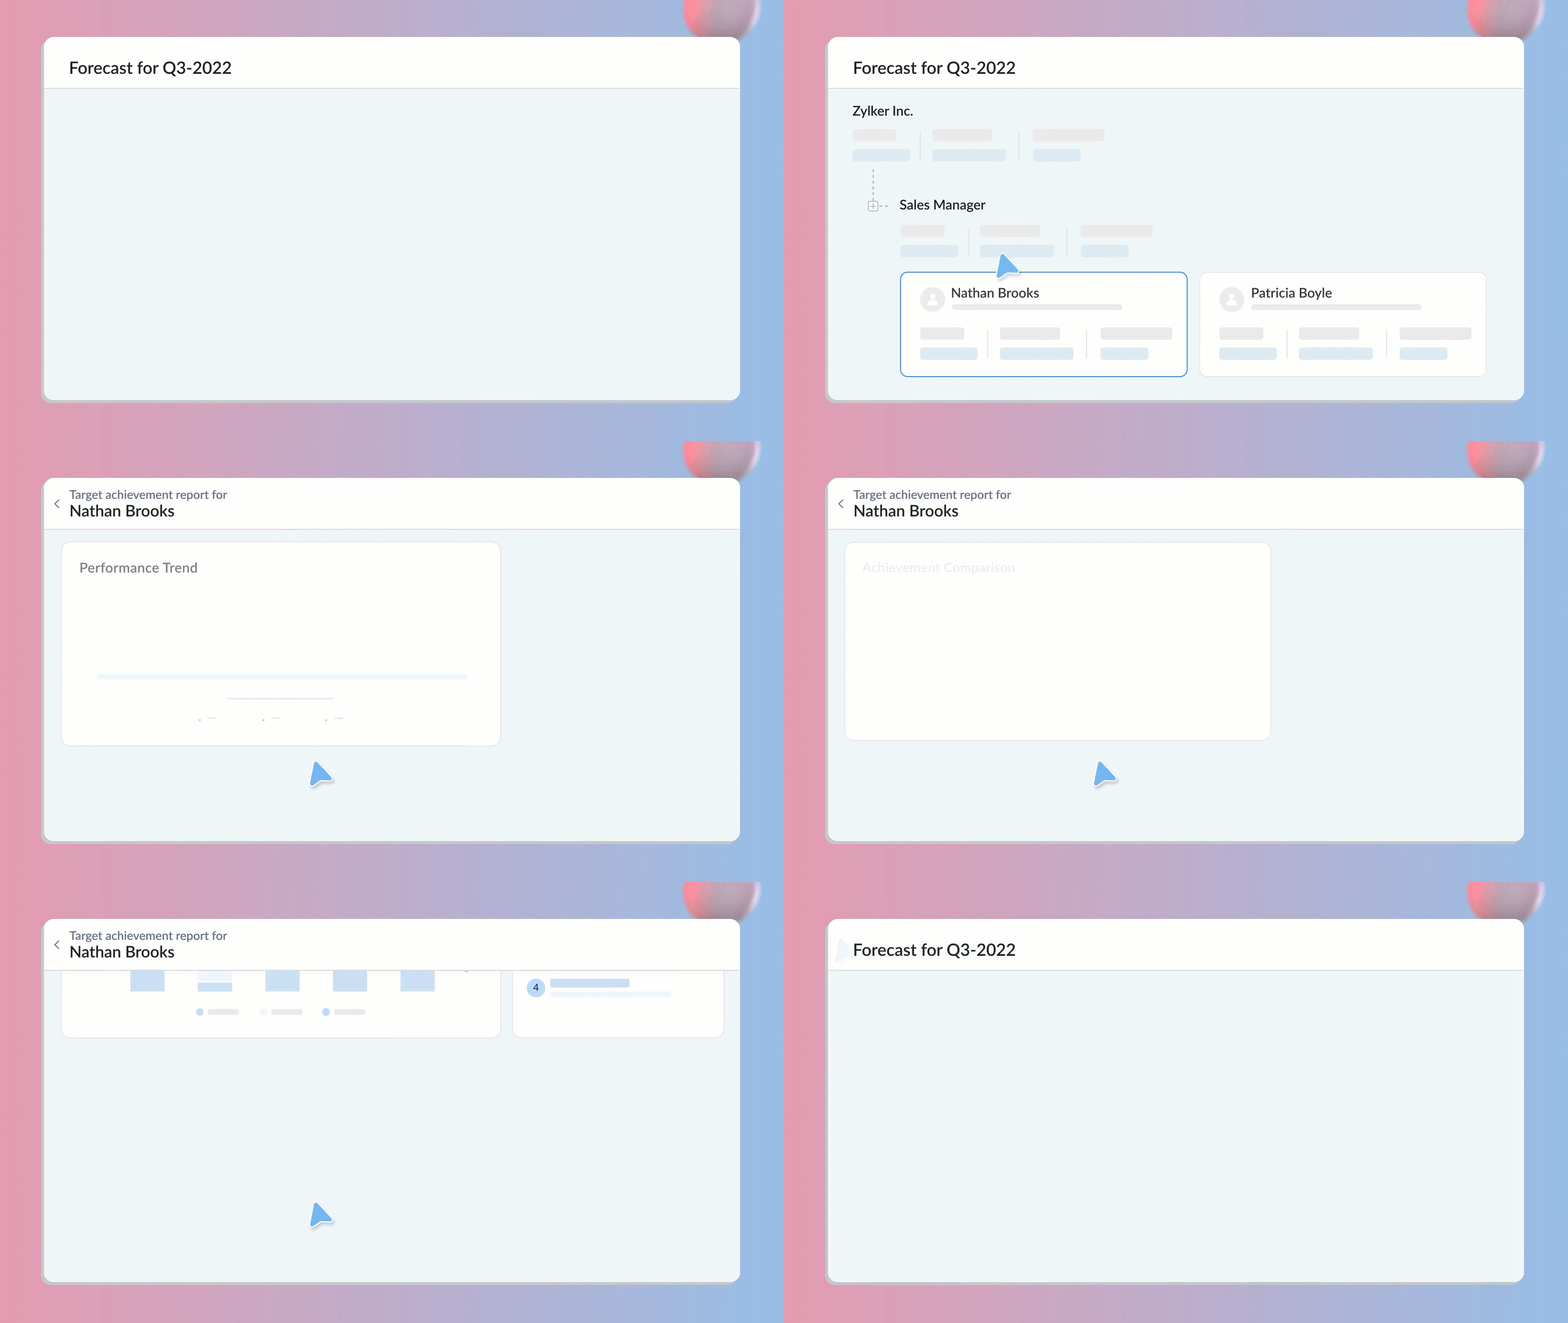
Let's have a look at these charts and at the overall enhancement in detail.
Forecast Overview
We've introduced a section at the top of the Target Achievement Report page called Forecast Overview. The analytics in this section help users track their performance and plan according to their targets and requirements.
We've introduced a section at the top of the Target Achievement Report page called Forecast Overview. The analytics in this section help users track their performance and plan according to their targets and requirements.
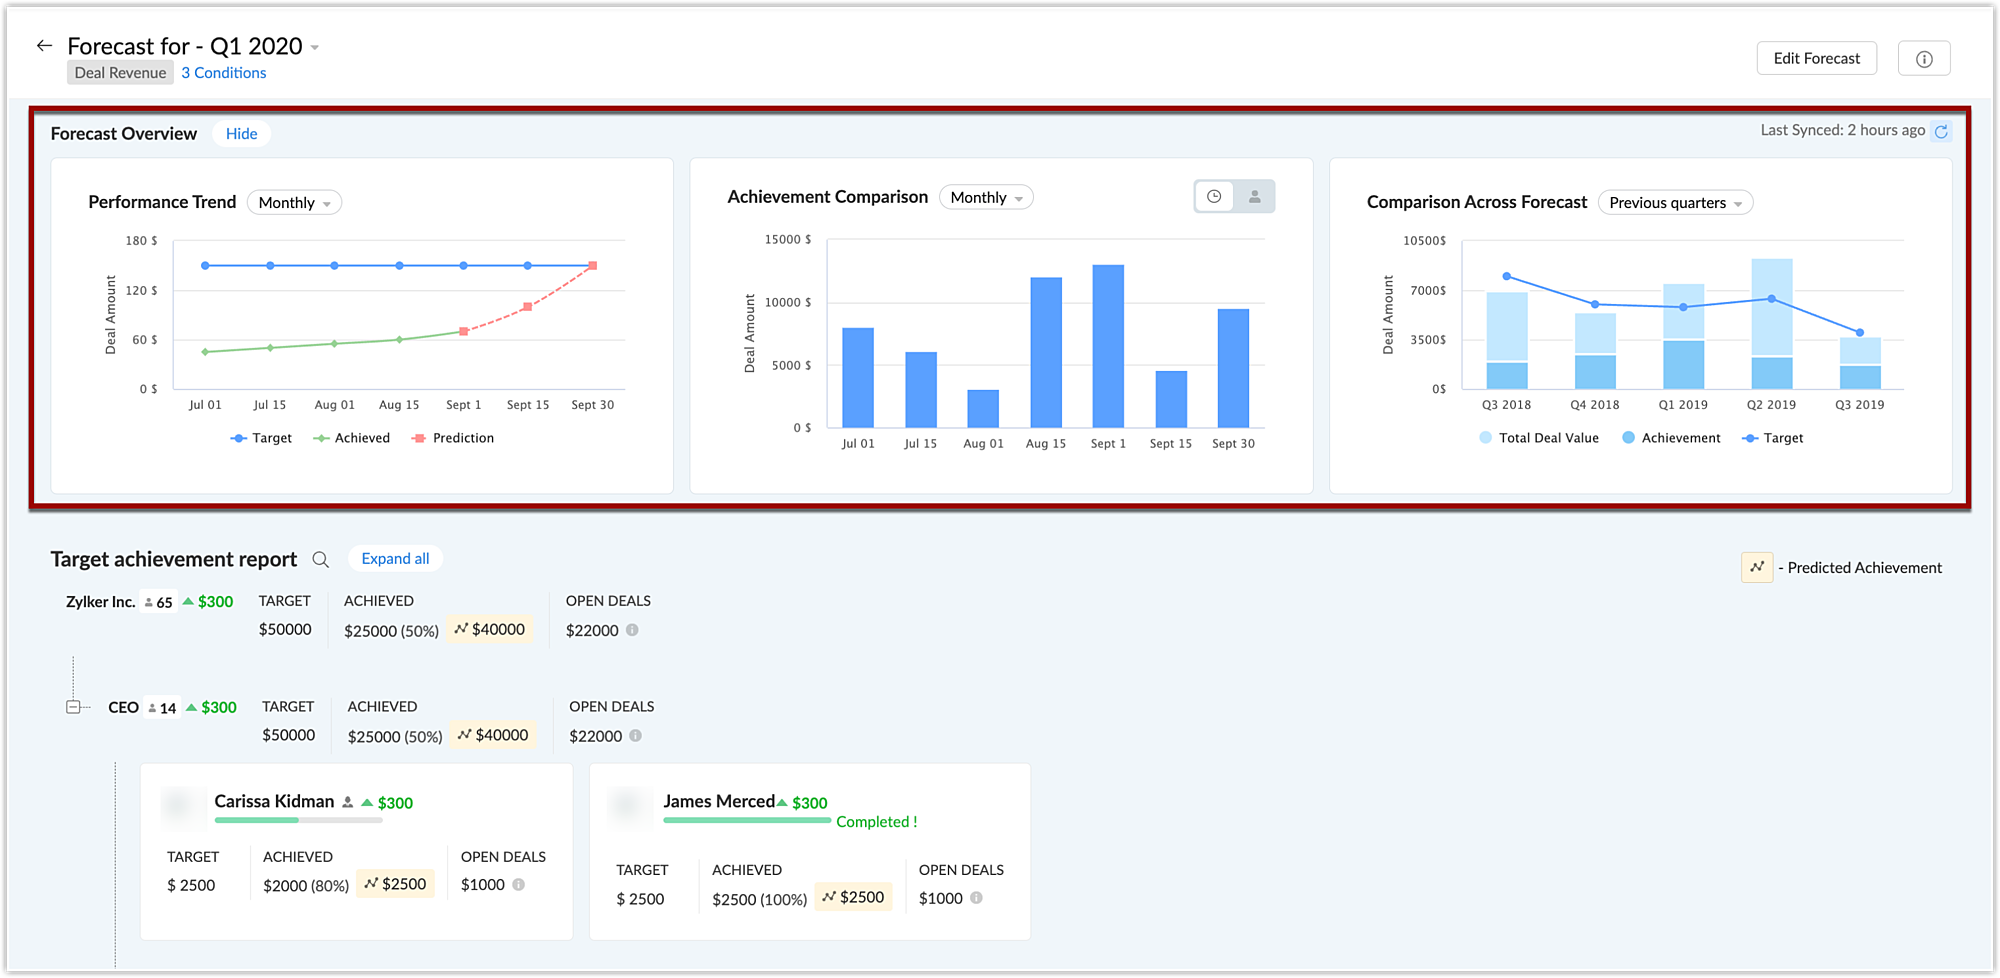
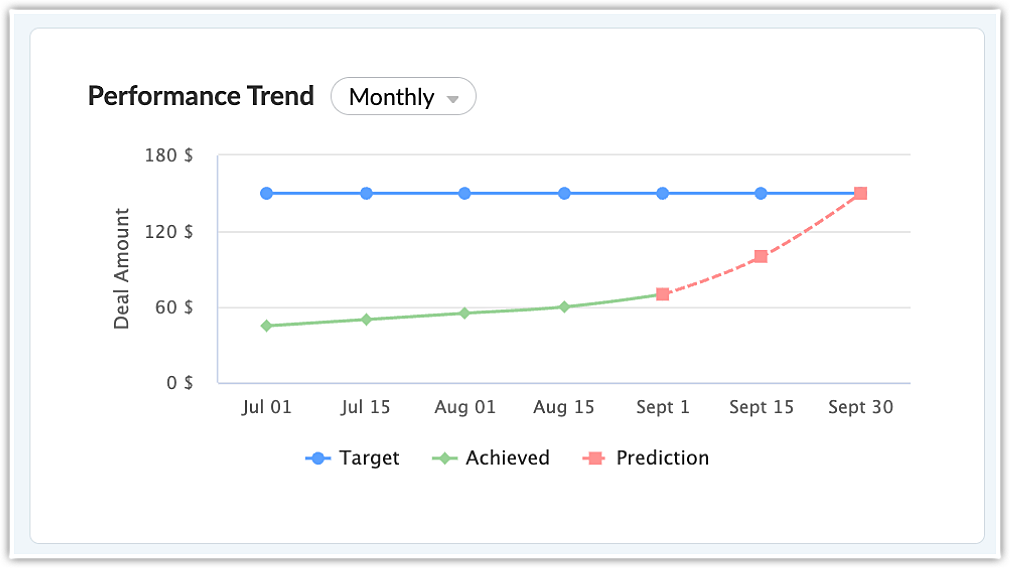
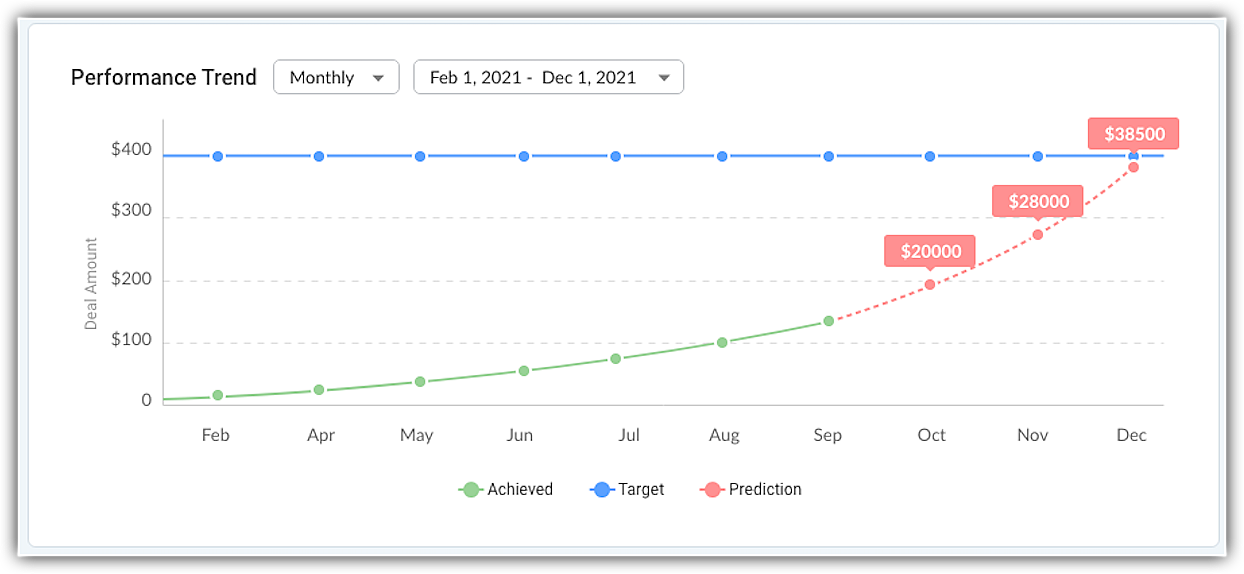
- Performance Trend: Users can analyze their performance with the help of the performance trend chart, which compares actual achievements across time with target achievements. The trend line predicts whether the achievement can be met within the forecast period based on the current performance, and shows the predicted achievement on particular dates. Users, therefore, have a visually clear representation of what's necessary to improve performance to reach targets.
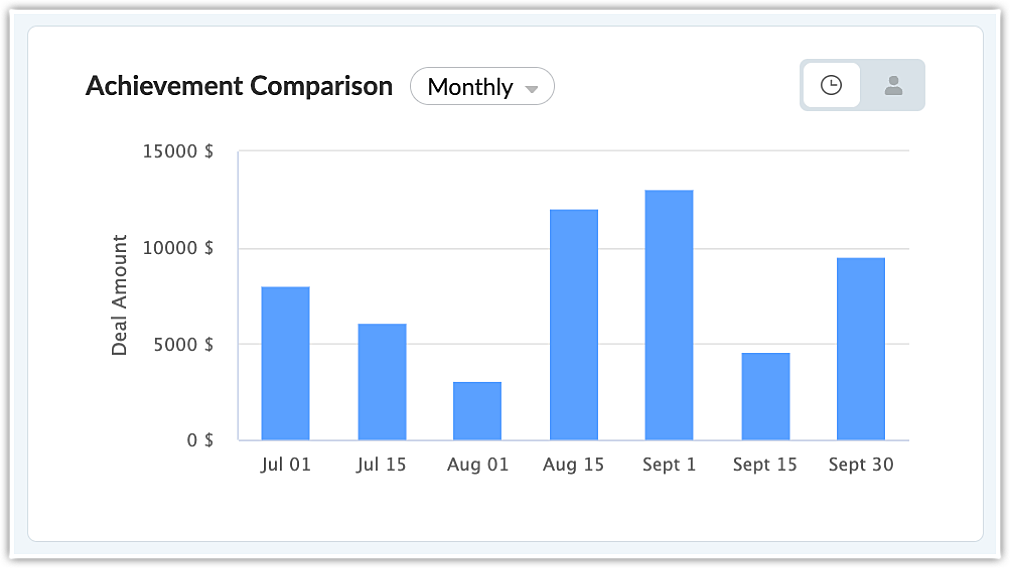
- Achievement Comparison: Users can compare their performance at different intervals to analyze how their performance has changed over time. They can set the chart to compare performance on a daily, weekly, or monthly basis.
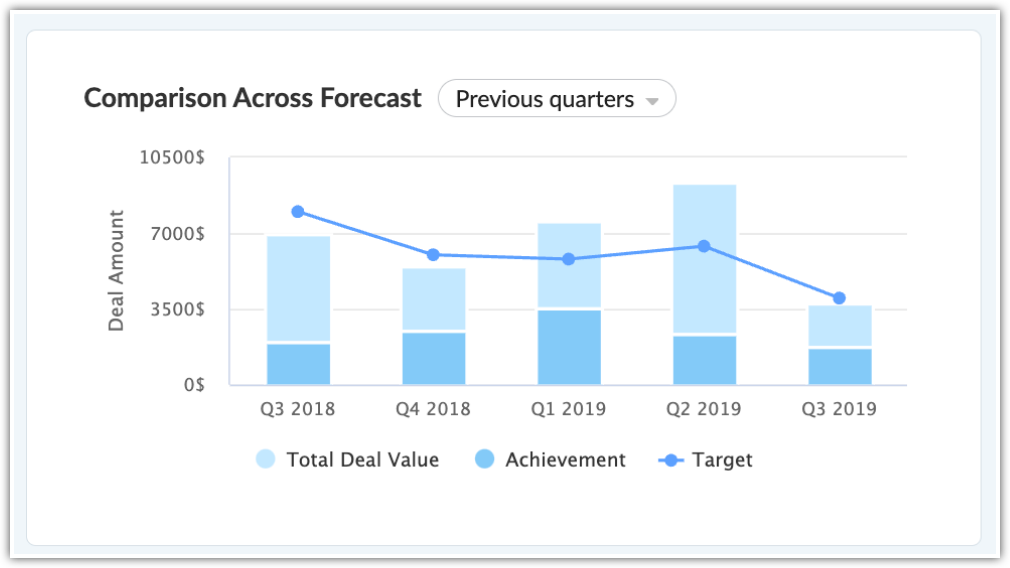
- Comparison Across Forecasts: This chart helps users compare their targets, open deals, and achievements across different forecast periods. The bars signify the total deal value assigned to a particular user and contrast it with the deal value closed at the end of the period. Combined with the line plot representing targets in the selected time frame, this enables users to determine whether the target is achievable, and how much more effort is required.
User Performance page
We've introduced the User Performance page for users and admins to track individual performance in a particular period. Apart from providing insights into users' performance, on this page, there are additional details including charts and other widgets. Users can see suggestions for improving their performance or the reasons for which they're not able to meet their targets, and can therefore act accordingly.
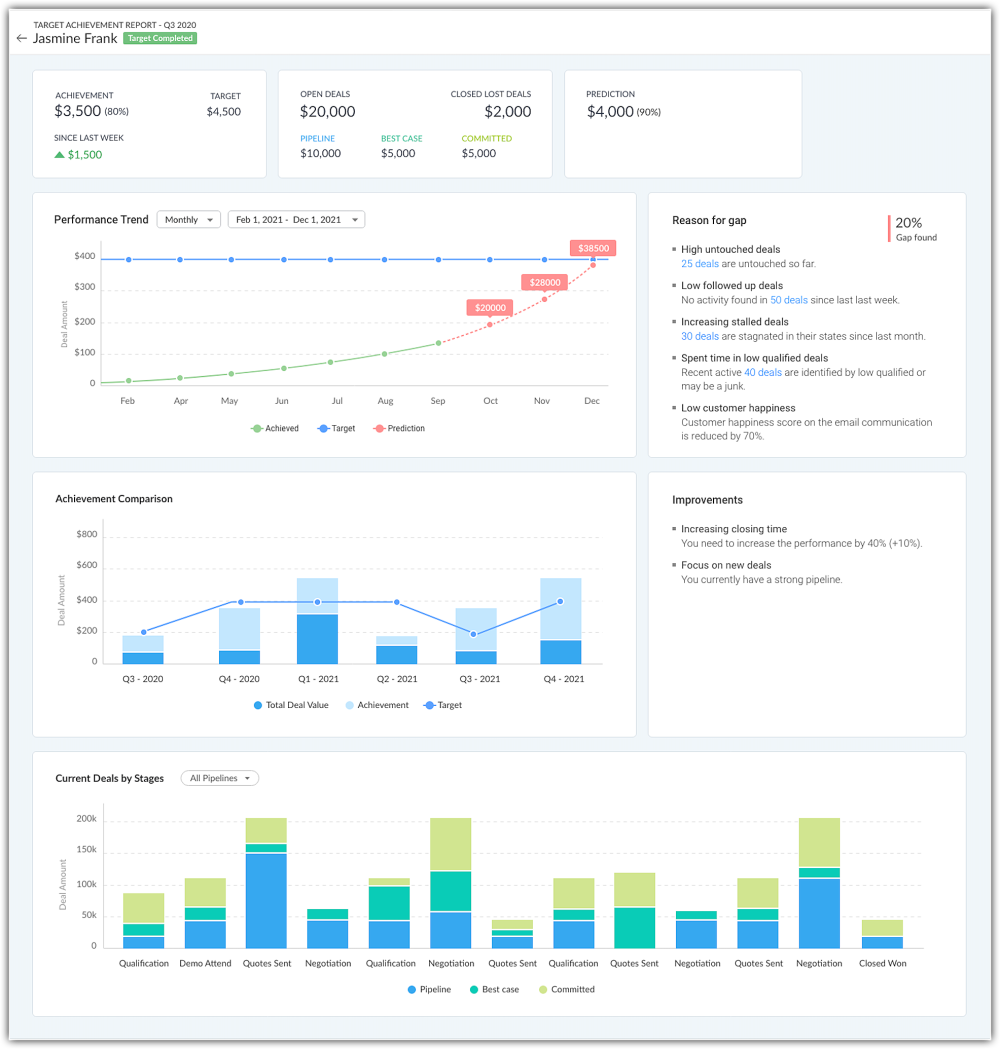
The following details are available on the User Performance page:
- Open deals
- Deals in the best case, pipelines, and omitted deals.
- Predictions
- Targets
- Achievements
The User Performance page also has charted—Performance Trends and Achievement Comparison—with similar functionality as those in the Forecast Overview section.
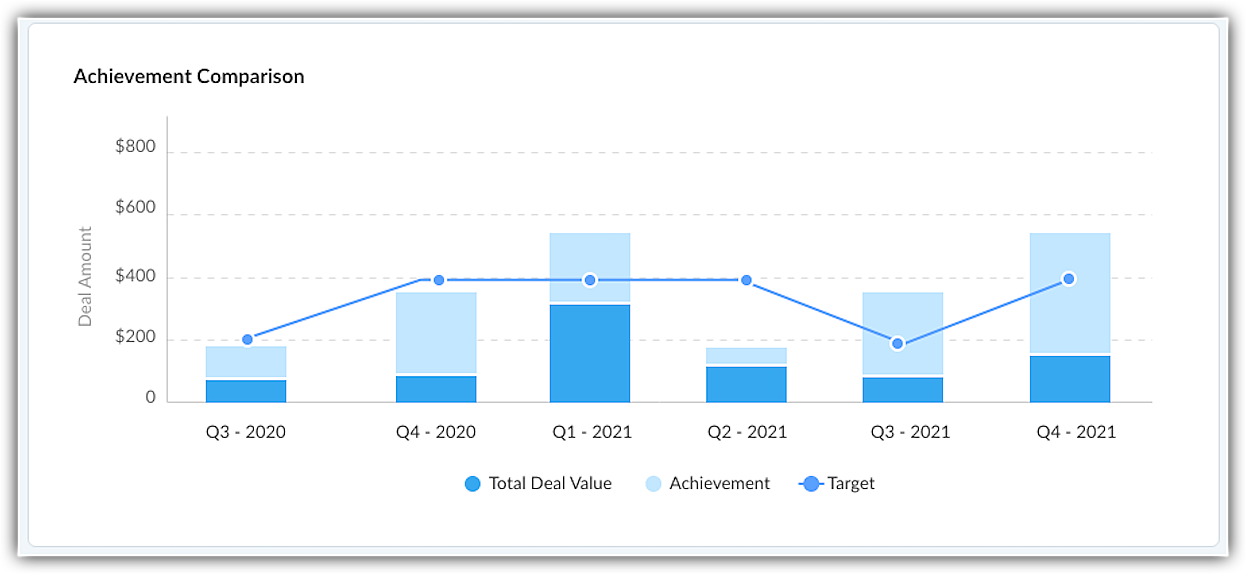
The Achievement Comparison chart compares total achievement over time with the number of available deals that can be completed, with a plot for overall targets provided for context.
Apart from these two charts, the User Performance page features the additional Current Deals by Stages chart. The main purpose of this chart is to show deal amounts in different stages. All deals in the current period are plotted as bar graphs according to the deal stage. Each bar breaks down the sum of the deal amounts into three forecast categories: pipeline, best case, and committed. If a pipeline is added, you can also view the current deals by stage based on that pipeline.

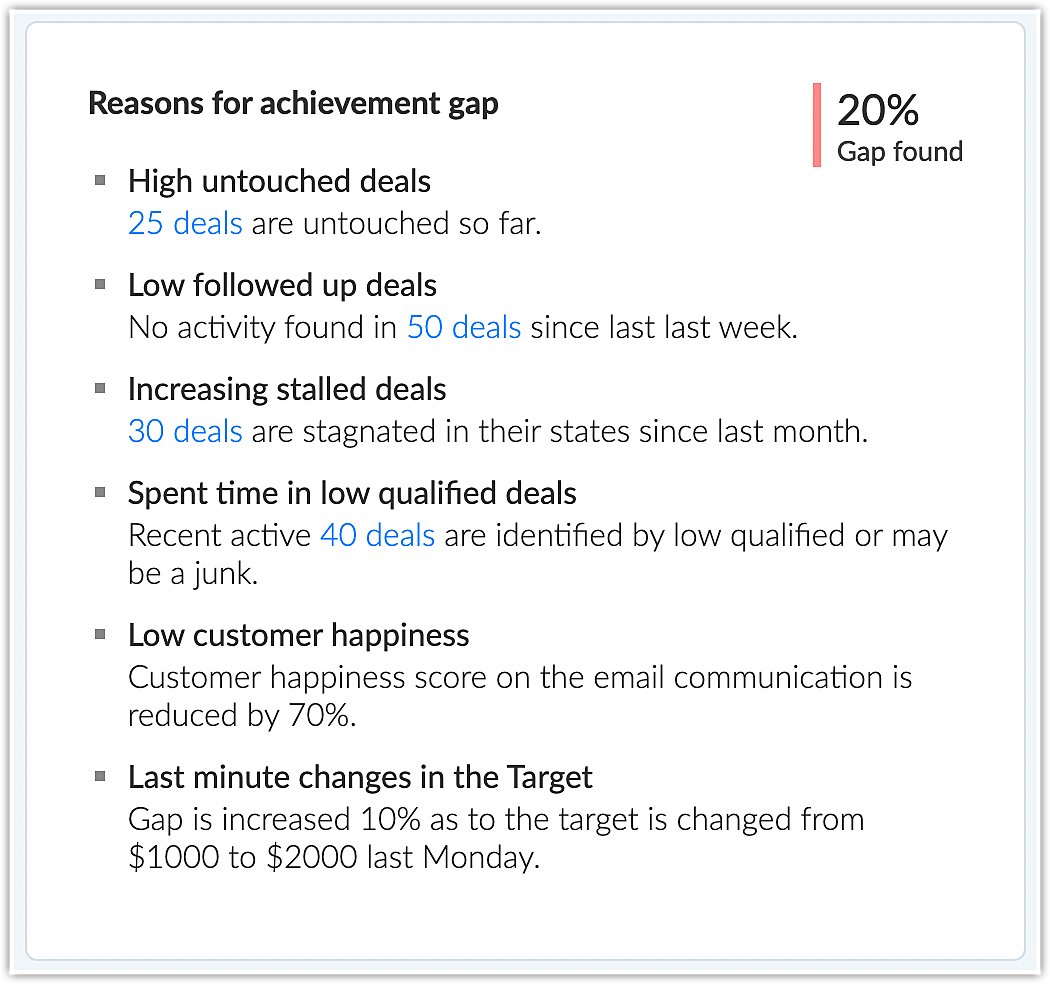
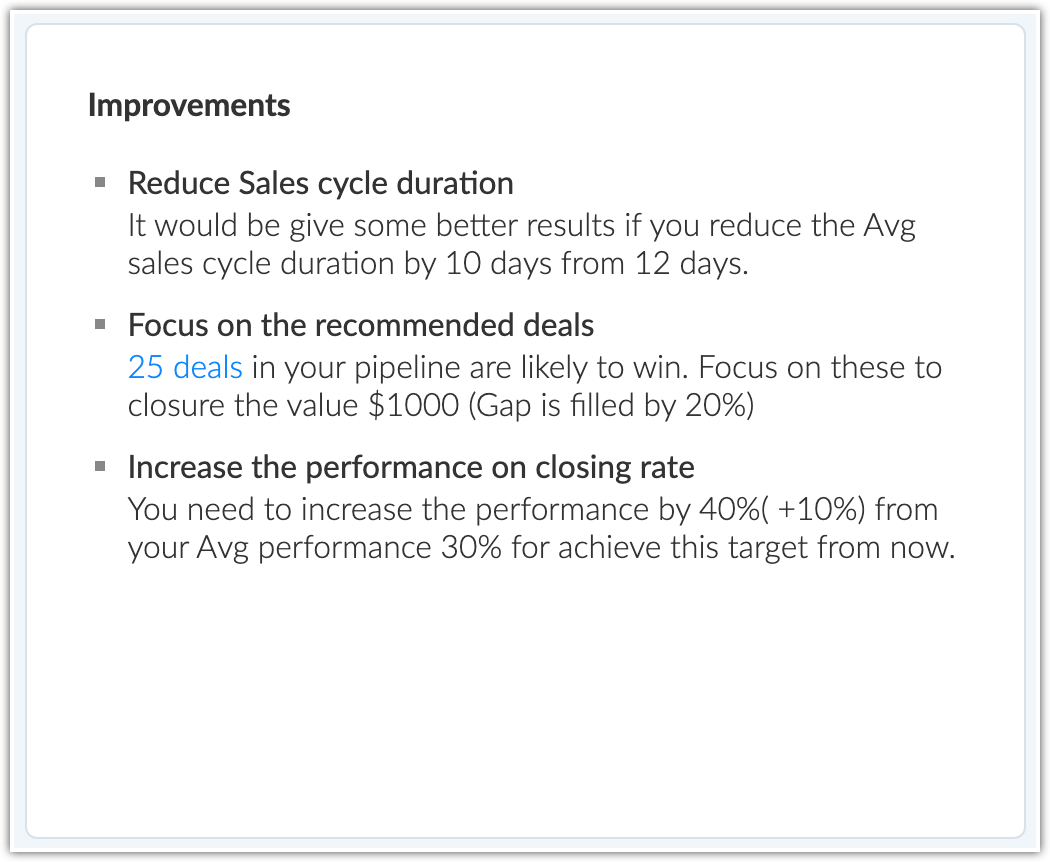
We didn't stop just at providing insight into user performance; we've also introduced two additional sections: reasons for gap, which highlights the gap between the target and the achievement and provides reasons that could have led to the gap, and the improvements section, which lists out the various improvements the user can make in order to reduce the gap.
Here are some examples:
Reasons for gaps
- High number of untouched deals: Any untouched deals will be mentioned here, along with the actual count of untouched deals. Clicking the deal count makes a list of those specific deals pop up.
- Failed to approach at the right time: Deals that were not approached at the right time are referenced here. Clicking on the link reveals a list of deals that weren't approached at the right time.
- Doesn't fall in this forecast period: Deals that are outside of the forecast period are referenced for this reason.
- Deal value insufficient to close target: Deals in the pipeline whose values are too low to reach the target are referenced here.
Improvements
- Focus on recommended deals: Deals that are likely to be won are referenced here, along with the total deal value upon closing. The deal count is hyperlinked to summon the deal list.
- Focus on high-value deals: This improvement recommendation suggests which deals to focus on, including high-value deals or low-value deals, based on the win rate for each type of deal. It also mentions the number of such deals available in the pipeline and lists them via a link.
- Improve closing rate: This improvement is suggested if the user needs to improve their closing rate, along with the percentage by which it needs to increase.
- Kick out the stalled deals: If a high number of deals in the pipeline have a low chance of being won, they will be mentioned here. Users can click on the deal count to see a list of such deals.
Role Performance page
Users can access the role performance report via the Roles Performance page by clicking on a particular role in the hierarchical view of the Target Achievement Report page.
The Roles Performance page also features sections that show reasons for achievement gaps and improvements (different than those suggested in the User Performance page). Admins can thereby analyze the performance of particular roles and their direct subordinates.
Here are examples of reasons for achievement gaps and improvement suggestions:
Reasons for achievement gaps
- Users recently switched roles: Users who have switched roles are cited here as a potential reason for a performance gap, along with the count of such users and the percentage of the target deal value that they owned. Clicking on the count of users summons a list of users who have switched roles.
- Mismatch found in the split and target: In case there is a delay in the allocation of values in the target, it will be mentioned as the percentage of the value in the target that is mismatched.
- Low user performance: The number of users who closed less than 20% of their targets is cited here. The list of users is linked with the provided count.
- Overrated targets: If users' targets are overrated, this reason will appear, along with the percentage of how overly rated the targets are.
Improvements
- Identify users who have a low follow-up rate: Users who have contributed to a decline in customer happiness are referenced here, along with a list linked to the user count.
- Right deals to the right person: If a certain user has a high win rate of 76% on high-value deals and 60% on low-value deals, the system will suggest assigning high-value deals to that user to get better results.
- Reassignment yields better results: If two users have some stagnant and untouched deals, the system will suggest that those deals be reassigned to help closure.
- Target correction: If five users have overrated targets and three users have low-rated targets compared to the individual's average performance, the system will suggest reassigning targets based on performance.
Notes:
- The charts on the User and Role Performance pages are available only for completed and current forecasts only.
- The Current Deals by Stages chart is available only for the Current forecast.
- The Achievement Comparison chart is only available if there is data from previous forecast periods.
- Improvements and reasons for performance gaps are updated once per week
Centralize Knowledge. Transform Learning.
All-in-one knowledge management and training platform for your employees and customers.
New to Zoho Recruit?
Zoho Developer Community
New to Zoho LandingPage?
Zoho LandingPage Resources
New to Bigin?
Topic Participants
Vaagdevi Ravishankar
lee.lister
Nick
Sukumar
Amit
Sticky Posts
Announcing Early Access to "Zoho CRM for Everyone" — A new and exciting update to Zoho CRM
Update : Zoho CRM For Everyone's Nextgen Interface gets an upgrade! Hello everyone, We’ve updated the Zoho CRM for Everyone Nextgen interface based on your feedback. The UI is now simpler with a unified sidebar, a more visible global search and features[Early Access] Voice of the Customer (VoC) for Zoho CRM
Happy new year, everyone! We have an exciting addition to our suite of features and would like to introduce you to VoC (Voice of the Customer) for Zoho CRM, powered by Zia. 2023 is definitely the best time to be a customer with rapid innovations and advancementsAdding calls as a channel in Voice of the Customer
Dear All, We hope you're well! It's been almost a year since we opened Zoho CRM's Voice of the Customer solution up for early access. We are grateful for the reception and support you have been showing us with regards to its adoption and feedback. Since
New to Zoho TeamInbox?
Zoho TeamInbox Resources
Zoho CRM Plus Resources
Zoho Books Resources
Zoho Subscriptions Resources
Zoho Projects Resources
Zoho Sprints Resources
Qntrl Resources
Zoho Creator Resources
Zoho CRM Resources
Zoho Show Resources
Get Started. Write Away!
Writer is a powerful online word processor, designed for collaborative work.
Zoho CRM コンテンツ
-
オンラインヘルプ
-
Webセミナー
-
機能活用動画
-
よくある質問
-
Ebook
-
-
Zoho Campaigns
- Zoho サービスのWebセミナー
その他のサービス コンテンツ
Nederlandse Hulpbronnen
ご検討中の方
Recent Topics
Importing into the 'file upload' field
Can you import attachments into the file upload field. I would expect it to work the same way as attachments do, But can't seem to get it to work.Sync your Products Module for better context.
In customer support, context is everything. The integration between Zoho Desk and Zoho CRM helps your sales and support teams function as one, delivering better customer experiences. With the latest update to this integration, you can now sync the Product module in your Zoho CRM with your Zoho Desk portal. This feature enables products from Zoho CRM to reflect in the "product" field in Zoho Desk. This can save your support team valuable time and effort. Some things to note when syncing the two:CRM verify details pop-up
Was there a UI change recently that involves the Verify Details pop-up when changing the Stage of a Deal to certain things? I can't for the life of me find a workflow or function, blueprint, validation rule, layout rule ect that would randomly make itDoes Zoho Writer have Dropdowns
I want to add a drop down field in Zoho writer. Is this possible?How can Data Enrichment be automatically triggered when a new Lead is created in Zoho CRM?
Hi, I have a pipeline where a Lead is created automatically through the Zoho API and I've been trying to look for a way to automatically apply Data Enrichment on this created lead. 1) I did not find any way to do this through the Zoho API; it seems likeTransitions do not update fields until the record moves to next stage
We have a blueprint where a couple of stages have multiple transitions. If only some of the transitions are completed, but not all, Zoho does not update any of the fields impacted by the completed transitions. Is there any way Zoho can udate the fieldsBlueprint enhancements - Parallel and multiple transitions, and more
Last modified on Sep 4, 2023: All Zoho CRM users can now access these enhancements. Initially, these features were available only on an early access basis and by request. However, as of August 2, 2023, they have been made available to all users in allOptimum CRM setup for new B2B business
Can some advise the most common way to setup Zoho CRM to handle sales for a B2B company? Specifically in how to handle inbound/outbound emails. I have spent hours researching online and can't seem to find an accepted approach, or even a tutorial. I haveusing the Client script on the load of the form if service no is empty means then i want to make issue relate to is Service
using the Client script on the load of the form if service no is empty means then i want to make issue relate to field is Service if Purchae no is empty means then i want to make issue relate to is PurchaseMultiple header in the quote table???
Hello, Is it possible in Zoho CRM to add multiple headers or sections within the Quote product table, so that when the quote is printed it shows separate sections (for example “Products” and “Services”)? To clarify, I’m asking because: This does not appearusing the Client script I want to Hide Show the Fields
if Related to service means some of the field like service no want to shoe and hide Amc no , purchase no how i achive this let issu = ZDK.Page.getField('Issue_Related_To').getValue(); if (issu == 'Service') { var field_obj = ZDK.Page.getField('Warranty_Cases');openUrl in blueprints
My customer wants to open a URL at the end of a blueprint transition. Seems this isn't possible right now but it would be very useful. In this thread, https://help.zoho.com/portal/en/community/topic/openurl-not-working the Zoho agent said that it's logicallyDropshipping Address - Does Not Show on Invoice Correctly
When a dropshipping address is used for a customer, the correct ship-to address does not seem to show on the Invoice. It shows correctly on the Sales Order, Shipment Order, and Package, just not the Invoice. This is a problem, because the company beingPrepayment of a sales order
How does everyone handle this common (at least it is common for us!) situation? We require all our orders to be fully prepaid before shipment since we manufacture made to order, custom products. Since ZOHO does not allow a sales order to be prepaid, we are forced to create an invoice at the time an order is placed to allow the customer to pay it. Our sales category is therefore skewed, since the sale was actually booked at the time an order was placed, rather then at the time it is shipped, whichAccess to Specific Zoho Desk layout for external parties
Hi, We have a partner who handles for us sales requests from specific markets. He is not a Zoho Desk user. But we want him to b part of a specific Zoho Desk layout to handle inquiries. How to achieve it in the easiest way possible?Deposit on a Sales Order
Good day, 100% of my business is preorders, no inventory. I am trying to run away from QB for one of my businesses, but I require two options that I don't seem to find with Zoho Books. 1 - If there is a way to apply a deposit on a sales order, as withHow Does Knowledge Base Search and Article Recommendation Work?
Hello, I would like to understand how the Knowledge Base search engine works. Specifically, does it search based on: The article title only? The full article content? Both, the article and the content? Keywords? Tags? Also, how does the system determinevalidation rules doesn't work in Blueprint when it is validated using function?
I have tried to create a validation rule in the deal module. it works if I try to create a deal manually or if I try to update the empty field inside a deal. but when I try to update the field via the blueprint mandatory field, it seems the validationBulk Delete Attachments
Is there a way to bulk delete attachments on the form entries? our storage is full and deleting files one by one is pain taking process.How do I sync multiple Google calendars?
I'm brand new to Zoho and I figured out how to sync my business Google calendar but I would also like to sync my personal Google calendar. How can I do this so that, at the very least, when I have personal engagements like doctor's appointments, I canZoho CRM || Unable to Bulk Assignment of Territories for Contacts
Dear Zoho CRM Support Team, I hope this email finds you well. We recently performed a bulk upload of Contacts into Zoho CRM using the official sample Excel template downloaded from the CRM. The upload itself was completed successfully; however, we encounteredCannot get code to work with v2.mergeAndStore!
Please can someone help me pass subform items into a repeating mail merge table row using v2.mergeAndStore? I have a mail merge template created in Writer and stored in Workdrive. This template is referenced by a custom CRM function which merges all ofAbility to CC on a mass email
Ability to CC someone on a mass email.Is It Possible to Convert a Custom Module to a Quote?
I recently created a custom module in our CRM environment for RFQs so that our sales team can submit quote requests directly in Zoho rather than by email/phone. This allows for a cleaner overall process, minimizing potential errors and potentially encouragingAbility to Disable System Banner Messages in Chat Flow Control
Dear Zoho SalesIQ Team, Greetings, We would like to request an enhancement related to the system banner messages in Zoho SalesIQ chat flow control. Current Behavior: SalesIQ allows configuring various automatic banner/system messages such as: WaitingHow do you do ticket add ons in Backstage?
Hi Everyone, If you wanted to have general admin tickets and allow for add ons, like camping, or car or Carbon offset. What would you do? Peace RobinWriting SQL Queries - After Comma Auto Suggesting Column
When writing SQL Queries, does anyone else get super annoyed that after you type a comma and try to return to a new line it is automatically suggest a new column, so hitting return just inputs this suggested column instead of going to a new line? AnyoneSort Legend & stacked bar chart by value
I'd love to see an option added to sort the legend of graphs by the value that is being represented. This way the items with the largest value in the graph are displayed top down in the legend. For example, let's say I have a large sales team and I createIdle Chat Reminders for Agent-Handled Conversations
Dear Zoho SalesIQ Team, Greetings, We would like to request an enhancement to the Idle Chat Handling functionality in Zoho SalesIQ—specifically for chats that are handled by human agents after a bot-to-agent transfer. Current Behavior: In Zobot settings,Layout Adjustment.
Hello Latha, Hope you are doing well. I wanted to check with you about adjusting the layout columns in the Service Report from the backend, as currently there is no capability for us to customize the layout from our end. Below is the output that I amSnapchat
Are there any plans to add Snapchat to Zoho Social or is there any API that we can use to integrate into Zoho.Zoho Sign "An unexpected error occured" when clients trying to sign documents
We are unable to have clients sign our documents. When attempting to complete the process an error appears saying "an unexpected error occured" and in the document history just shows "signing failure." We are at a complete standstill with no responseService Reports.
Hello Team, I have a requirement to create multiple service reports for a single AP. That means, in one AP I have 5 service line items, and all line items are linked to assets. Once I complete the AP, I want to generate 5 individual service reports, one¡Vuelven los Workshops Certificados de Zoho a España!
¡Hola usuarios de Español Zoho Community! Hace ya unos días que hemos dado la bienvenida al 2026, y promete ser un año de lo más emocionante. Y es que nos gustaría haceros nuestro particular regalo de Reyes, aunque lleguemos un poco tarde. 🎁 ¡Nos gustaríaCancel Subscription
Hi , Im want to cancel my account but without success please help me to do itDeprecation Notice: OpenAI Assistants API will be shut down on August 26, 2026
I recieved this email from openAI what does it means for us that are using the integration and what should we do? Earlier this year, we shared our plan to deprecate the Assistants API once the Responses API reached feature parity. With the launch of Conversations,How to list services on quote instead of products
I need to create a customer facing estimate that displays our services. The default quote layout only allows products to be listed. Is there a way to correct this?Making an email campaign into a Template
I used a Zoho Campaign Template to create an email. Now I want to use this email and make it a new template, but this seems to be not possible. Am I missing something?Syncing calendar with Google Calendar doesn't work when events are sent to auto repeat
Hi... The ZOHO CRM -- GOOGLE CALENDAR sync is broken. If I create a single event on either side, sync works, but if I create an event with auto repeat on either side it doesn't work. Furthermore, events created before the sync don't show up in the calendar.Invoice status on write-off is "Paid" - how do I change this to "Written off"
HI guys, I want to write off a couple of outstanding invoices, but when I do this, the status of the invoices shows as "Paid". Clearly this is not the case and I need to be able to see that they are written off in the customer's history. Is there a wayNext Page


