Report of the Week: Top Tags in Zoho Projects
Advanced Analytics for Zoho Projects now supports the "Tags" module. This enables you to create reports over the Tags in Tasks, Bugs, Milestone, Projects and Timesheet modules. This week let's see how to create a report over your Tags data.

Follow the below steps to create reports over the Tags module.
- Separate all tags as distinct values using Formula Colu
- Create a Maximum Tags Count Table
- Create a Tags Consolidation Query Table
- Create Reports
- Top 10 Tags in the Tasks Module
- Overview of Tasks based on the Tags, Projects and Priority
- Most Used Tags across the Projects
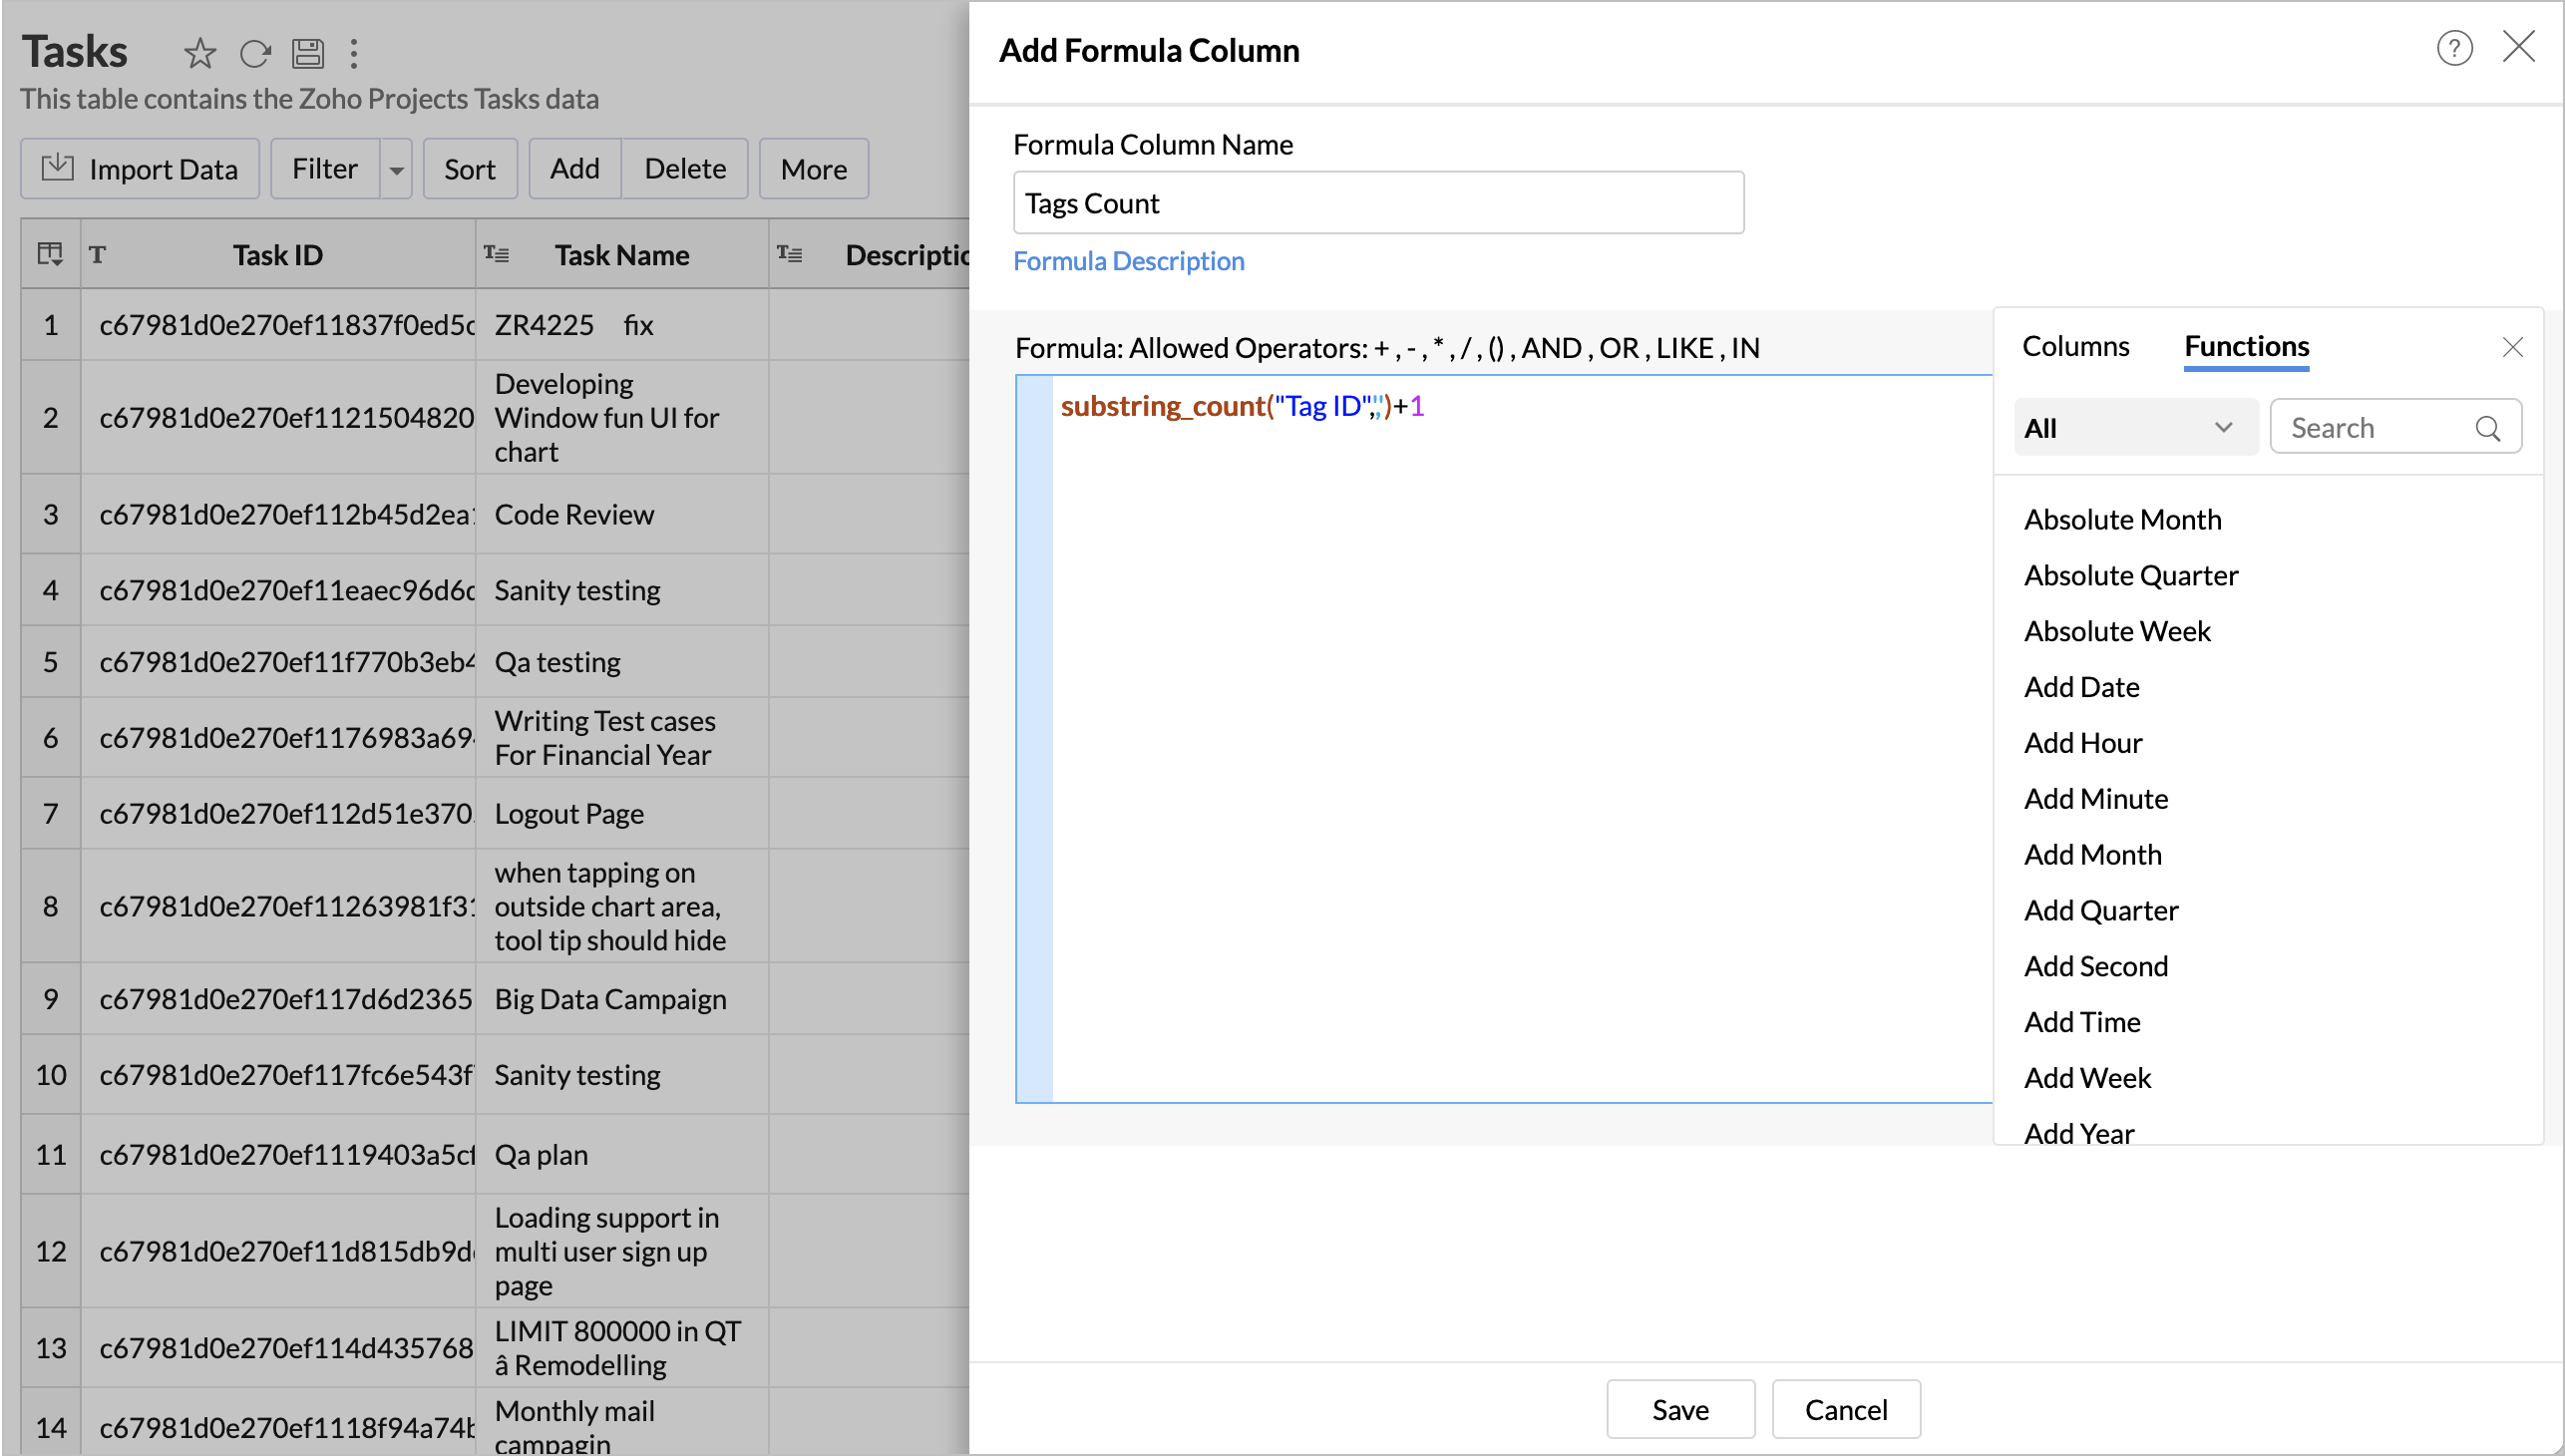
Separate all tags as distinct values
You may have multiple tags for each item. All these tags will be imported into a single column as a comma separated values in Zoho Analytics table. You need to separate these into distinct value using the below formula.
substring_count("Tag ID",',')+1 |
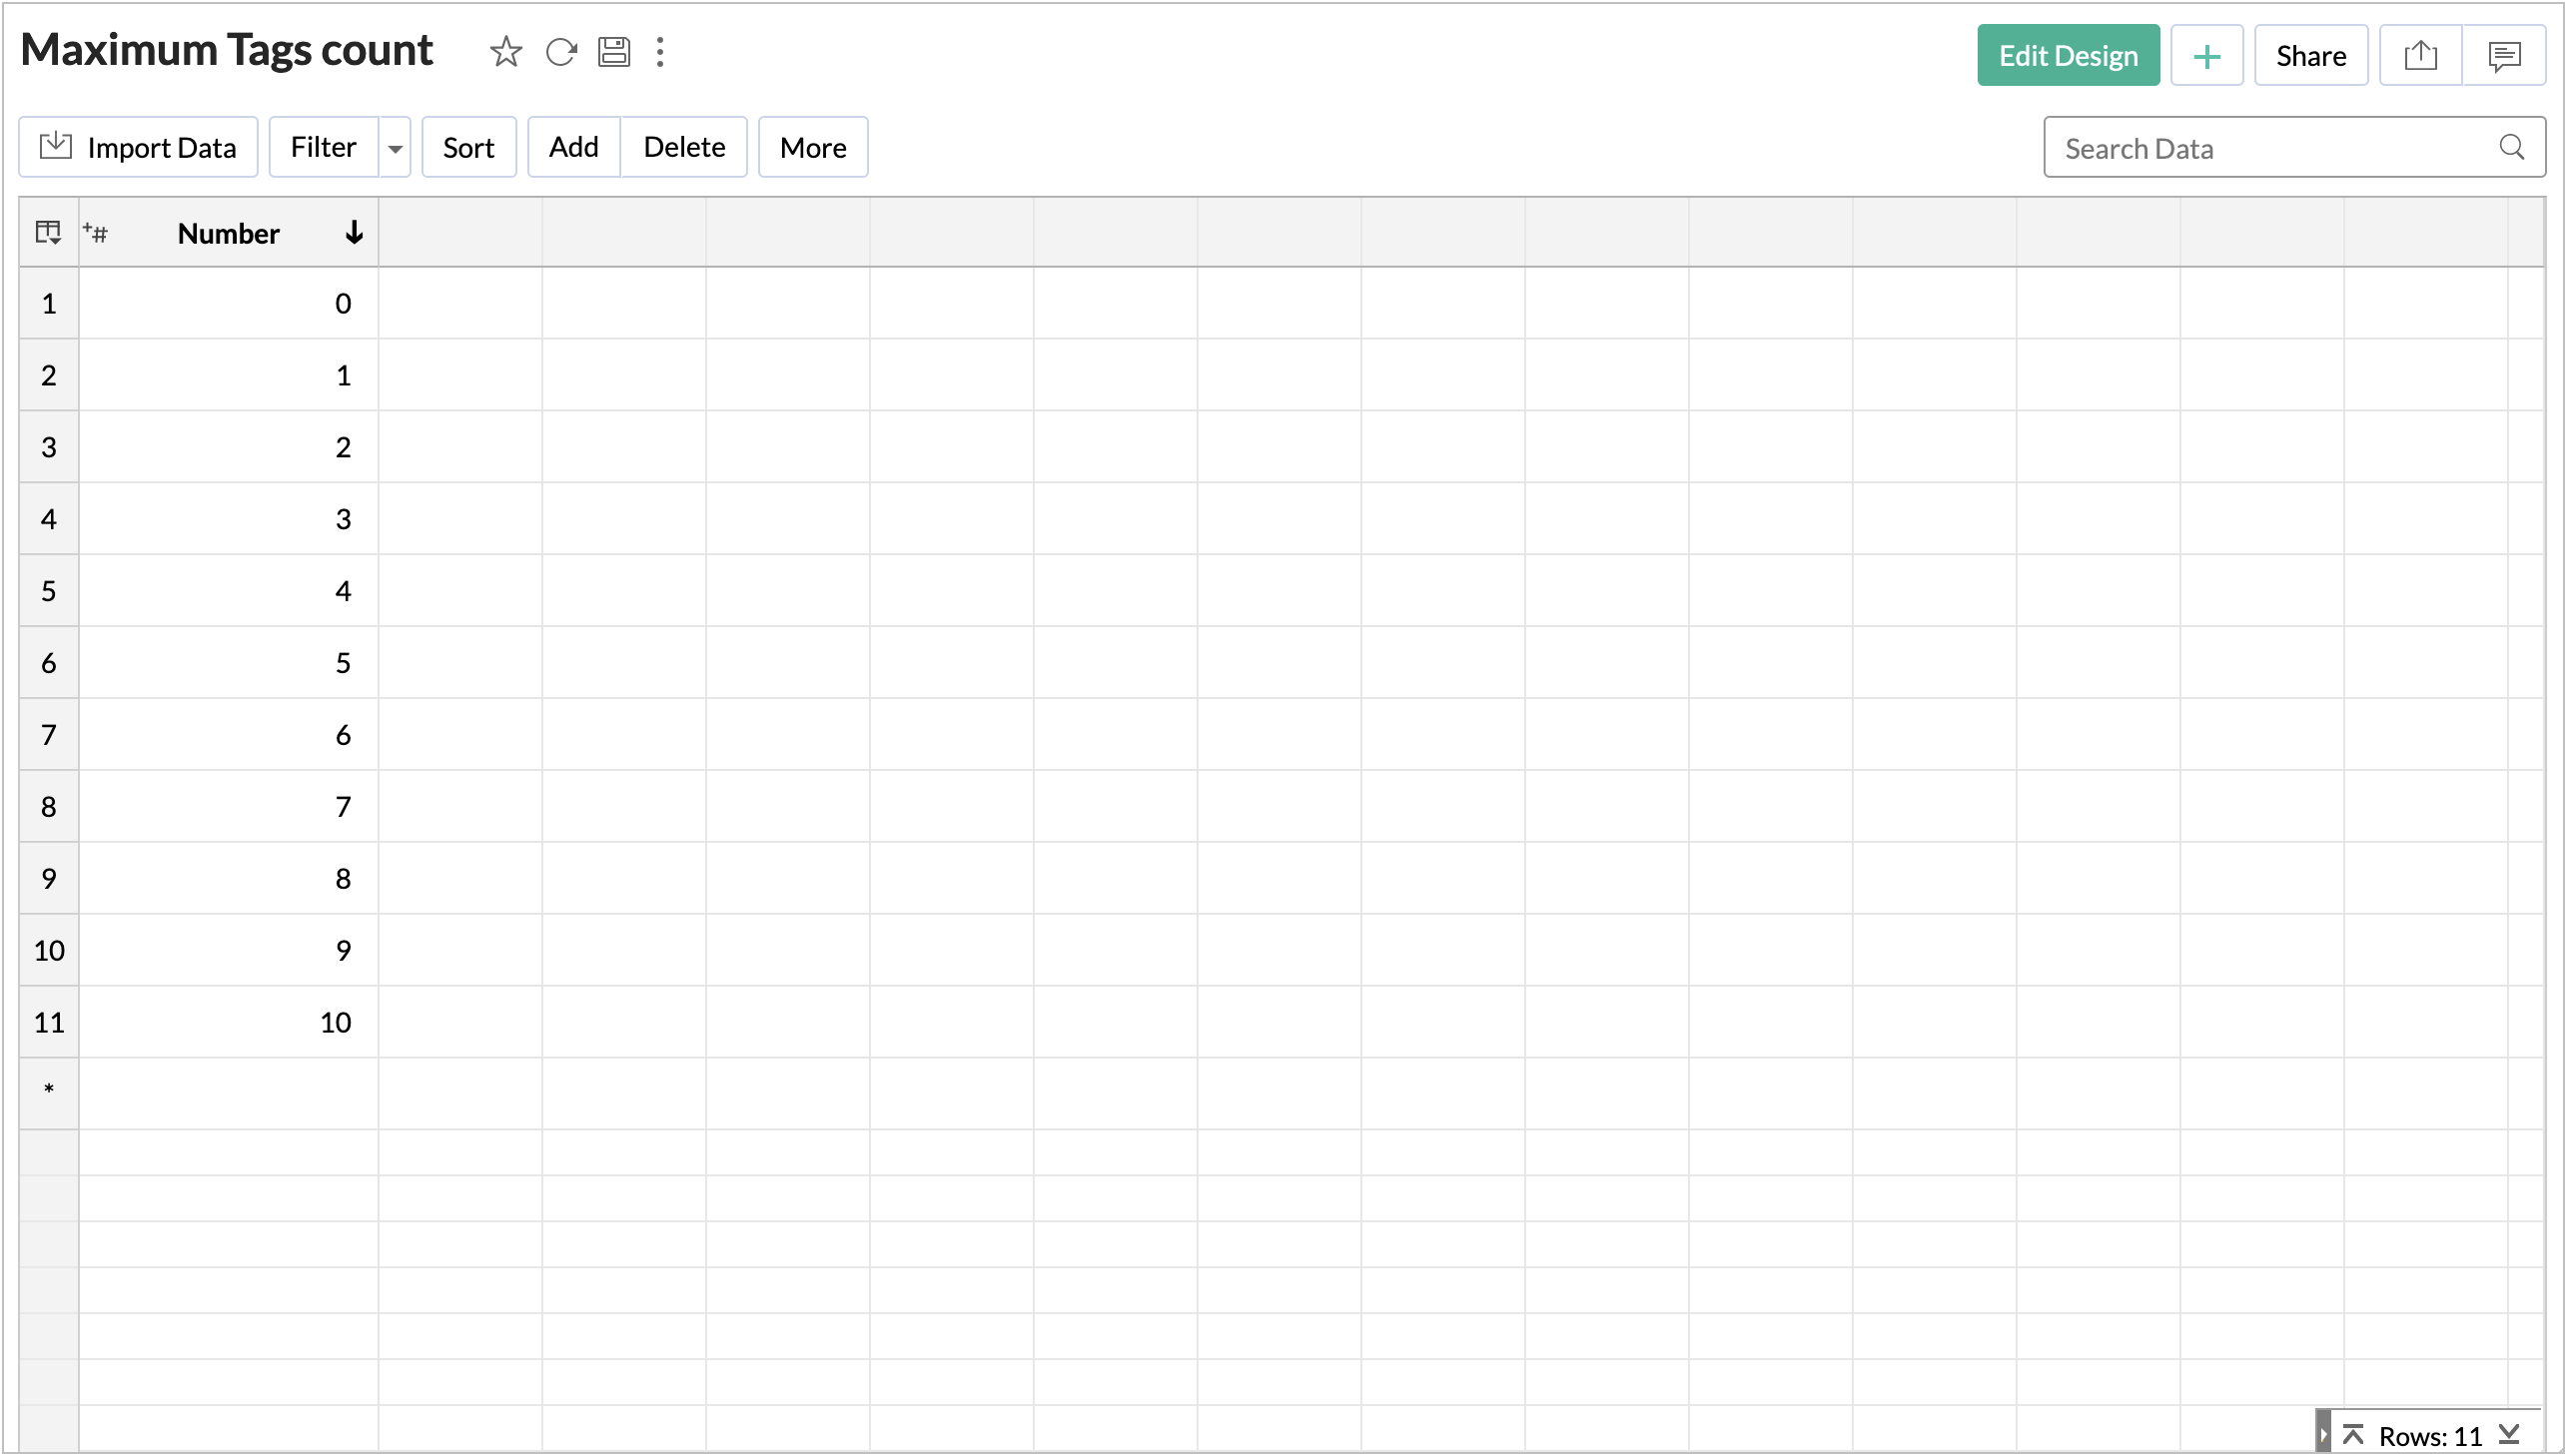
Create a Maximum Tags Count Table
Now, create a Maximum Tags Count table with a Numeric column. If your data has maximum of 10 tags then enter column values as 1, 2,... 10.
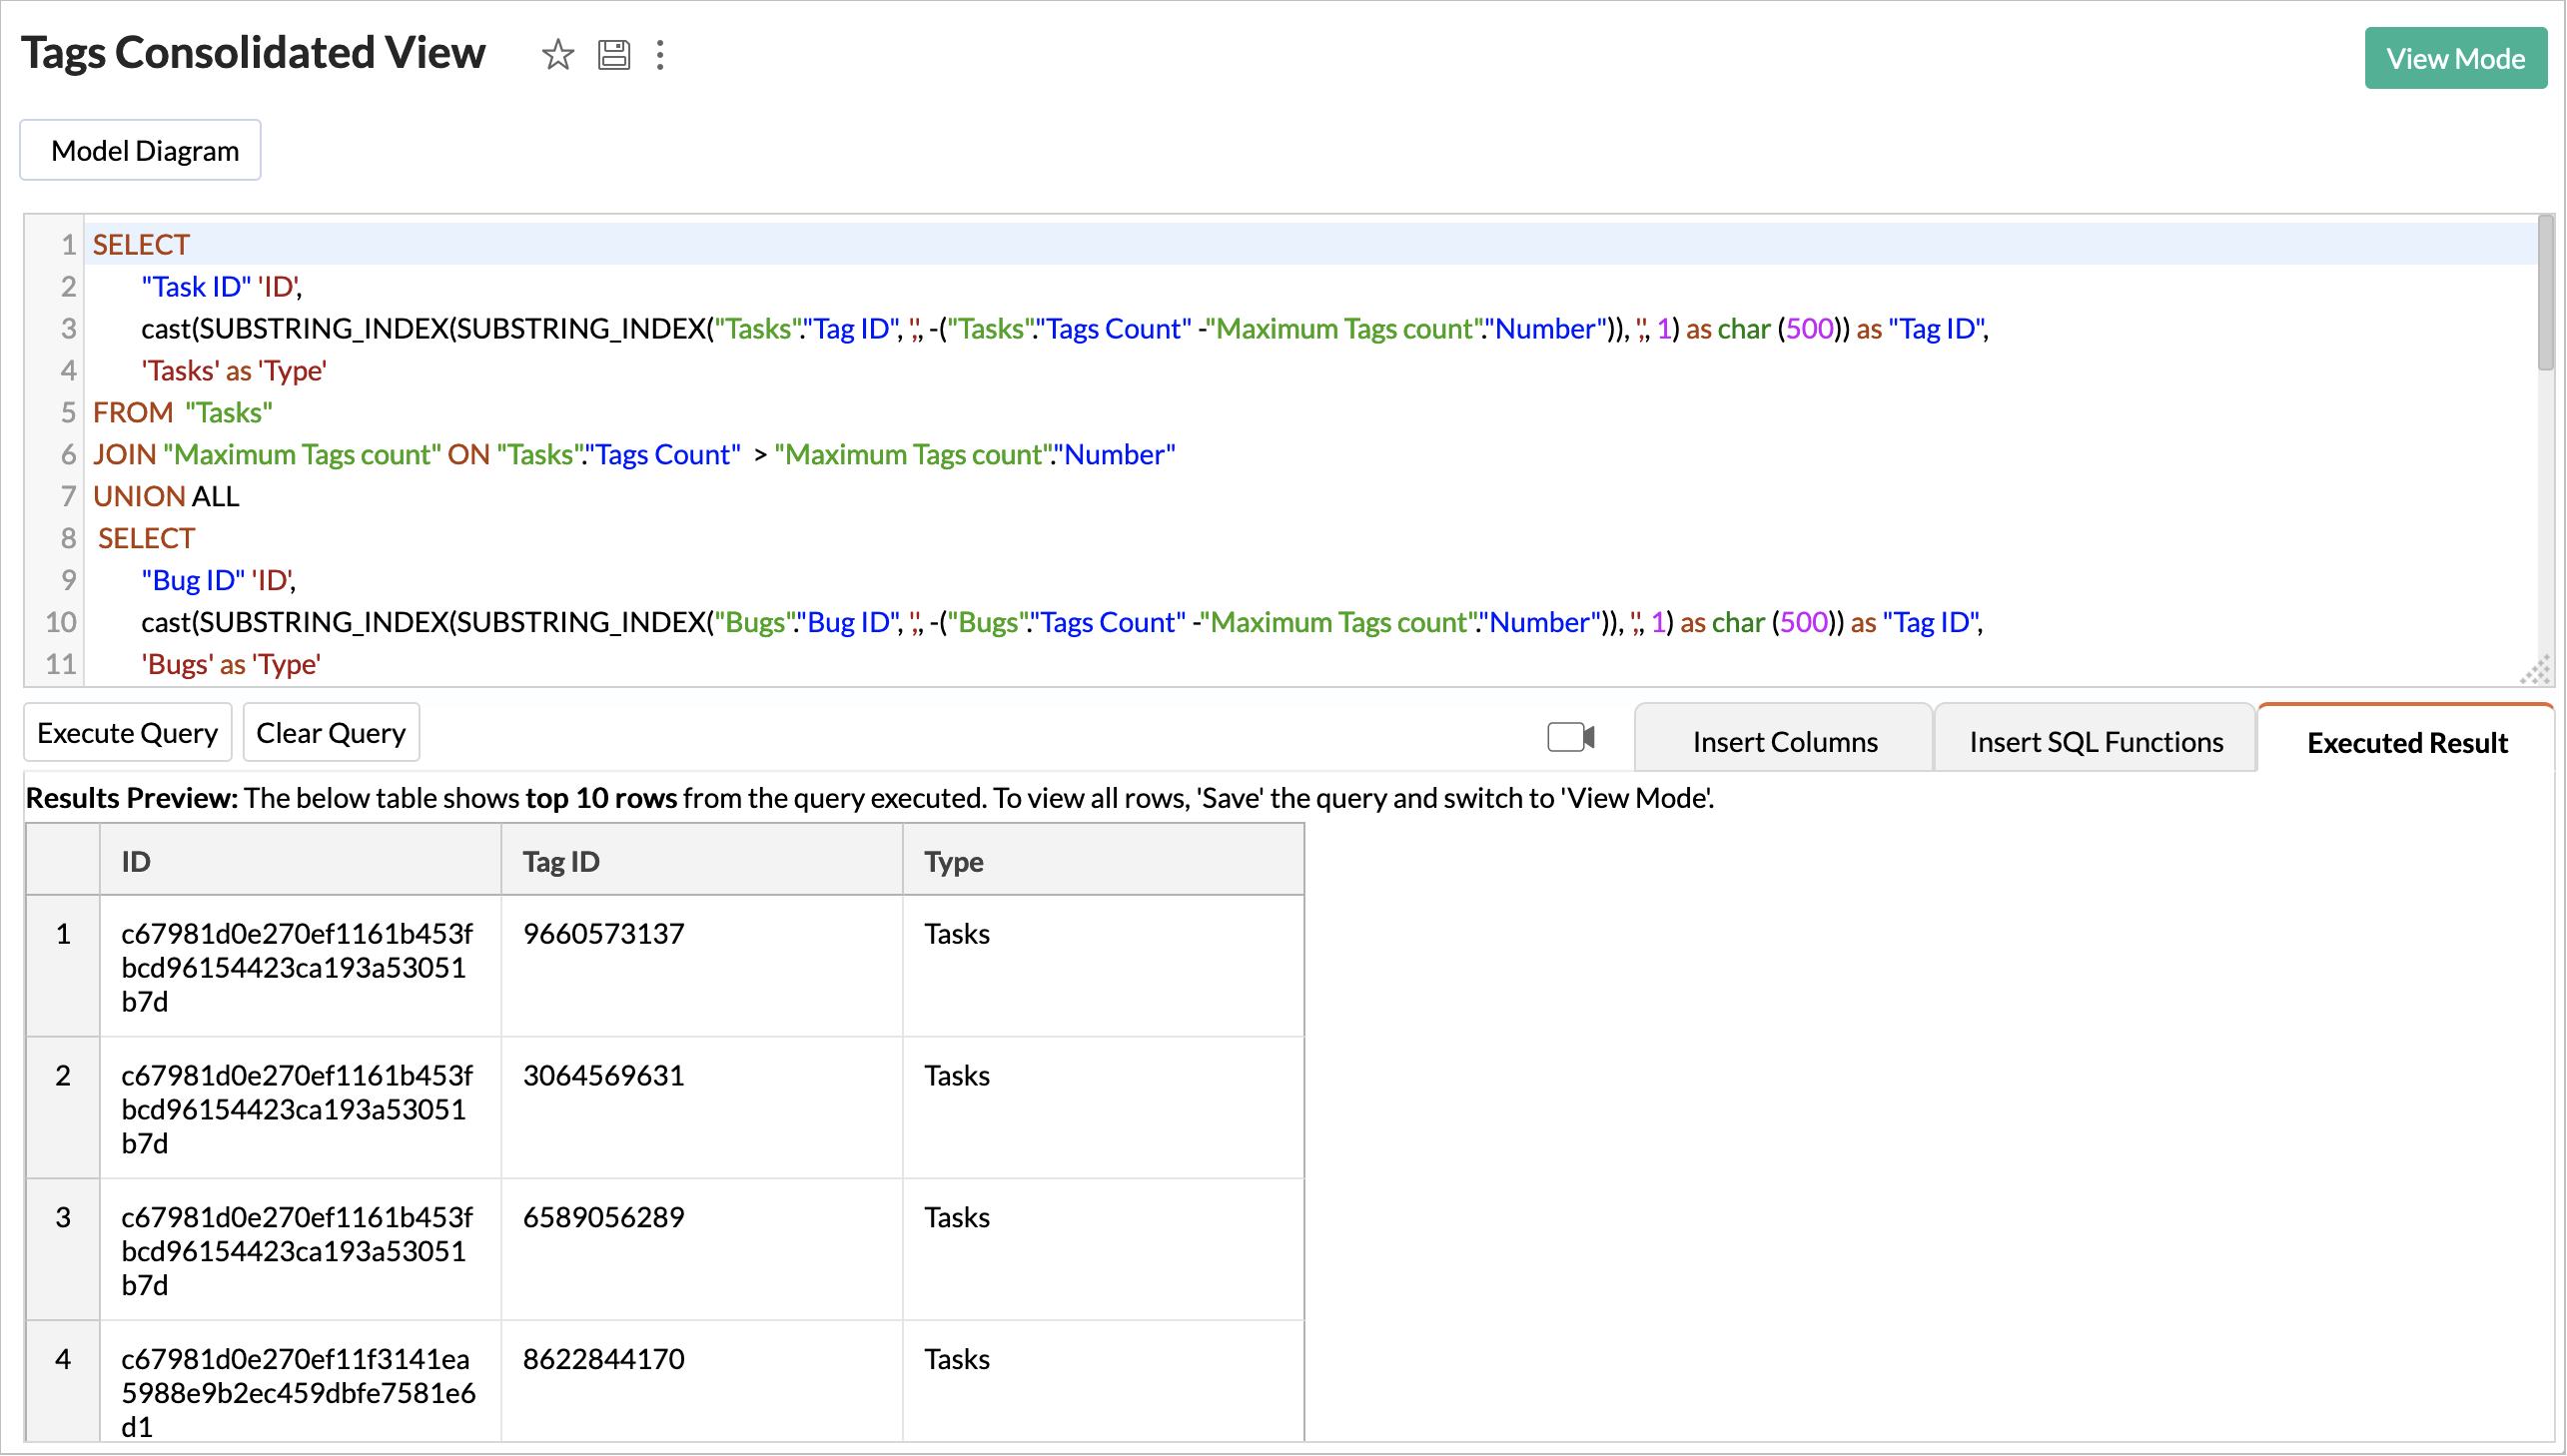
Create a Tags Consolidation Query Table
You need to consolidate the Tags across all modules. Create a query table using the following query to do this.
SELECT "Task ID" 'ID', cast(SUBSTRING_INDEX(SUBSTRING_INDEX("Tasks"."Tag ID", ',', -("Tasks"."Tags Count" -"Maximum Tags count"."Number")), ',', 1) as char (500)) as "Tag ID", 'Tasks' as 'Type' FROM "Tasks" JOIN "Maximum Tags count" ON "Tasks"."Tags Count" > "Maximum Tags count"."Number" UNION ALL SELECT "Bug ID" 'ID', cast(SUBSTRING_INDEX(SUBSTRING_INDEX( "Bugs".Tag ID", ',', -("Bugs"."Tags Count" -"Maximum Tags count"."Number")), ',', 1) as char (500)) as "Tag ID", 'Bugs' as 'Type' FROM "Bugs" JOIN "Maximum Tags count" ON "Bugs"."Tags Count" > "Maximum Tags count"."Number" UNION ALL SELECT "Project ID" 'ID', cast(SUBSTRING_INDEX(SUBSTRING_INDEX("Projects".Tag ID", ',', -("Projects"."Tags Count" -"Maximum Tags count"."Number")), ',', 1) as char (500)) as "Tag ID", 'Projects' as 'Type' FROM "Projects" JOIN "Maximum Tags count" ON "Projects"."Tags Count" > "Maximum Tags count"."Number" UNION ALL SELECT "Milestone ID" 'ID', cast(SUBSTRING_INDEX(SUBSTRING_INDEX("Milestones".Tag ID", ',', -("Milestones"."Tags Count" -"Maximum Tags count"."Number")), ',', 1) as char (500)) as "Tag ID", 'Milestones' as 'Type' FROM "Milestones" JOIN "Maximum Tags count" ON "Milestones"."Tags Count" > "Maximum Tags count"."Number" UNION ALL SELECT "Log ID" 'ID', cast(SUBSTRING_INDEX(SUBSTRING_INDEX("Timesheets"."Tag ID", ',', -("Timesheets"."Tags Count" -"Maximum Tags count"."Number")), ',', 1) as char (500)) as "Tag ID", 'Timesheets' as 'Type' FROM "Timesheets" JOIN "Maximum Tags count" ON "Timesheets"."Tags Count" > "Maximum Tags count"."Number" |
Create Reports
Now you can create insightful reports over the above query table. The following are a few examples.
- Top 10 Tags in Tasks Module
- Overview of Tasks based on the Tags, Projects and Priority
- Most Used Tags across the Projects
Top 10 Tags in the Tasks Module
Follow the below steps to create the Top 10 Tags in the Tasks Module chart.
Create a new chart over the Tags Consolidation query table.
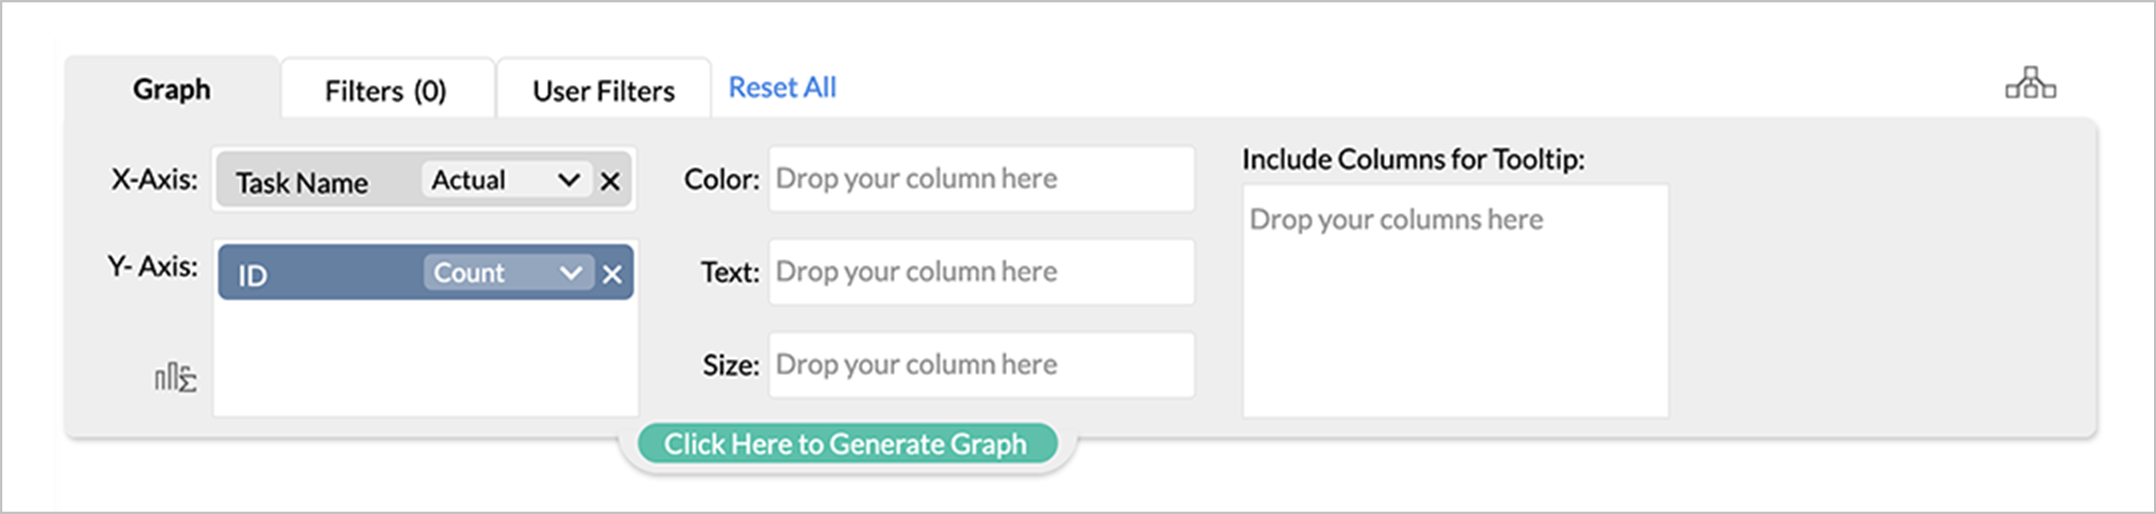
- Drop the columns as follow
- X-Axis - Task Name with Actual from the Tasks table.
- Y-Axis - ID with Count from Tags Consolidation query table.
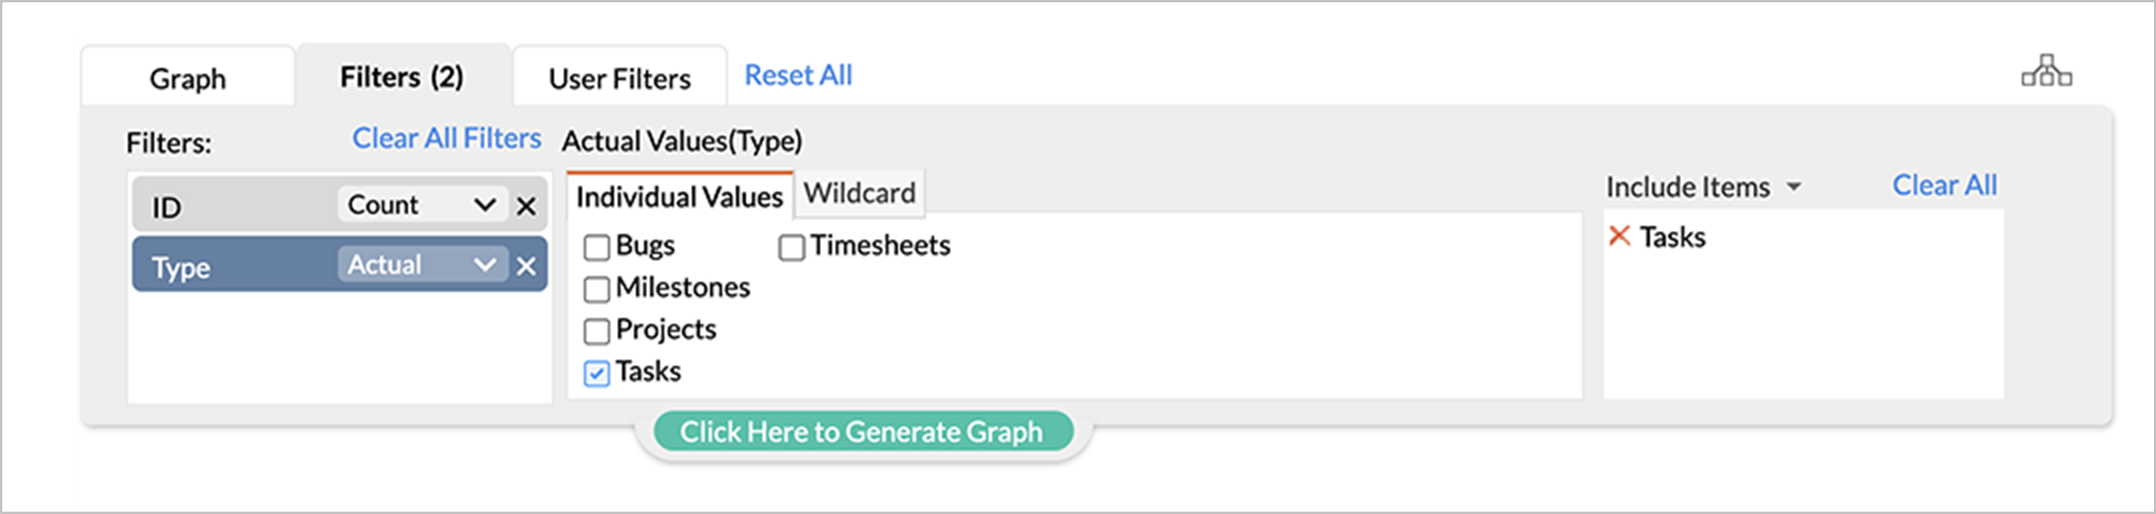
- Open the Filters tab. Filter the report by the following columns.
- Add ID with Count from Tags Consolidation query table and select Top 10 from the Top/Bottom N category.
- Add Type from Tags Consolidation query table and select Tasks.
- Click Click here to Generate Graph to create the chart.
- Sort the chart by Y Axis in ascending order.
You can also create similar reports over other modules such as Bugs, Milestone, Projects and Timesheet by changing the corresponding column.

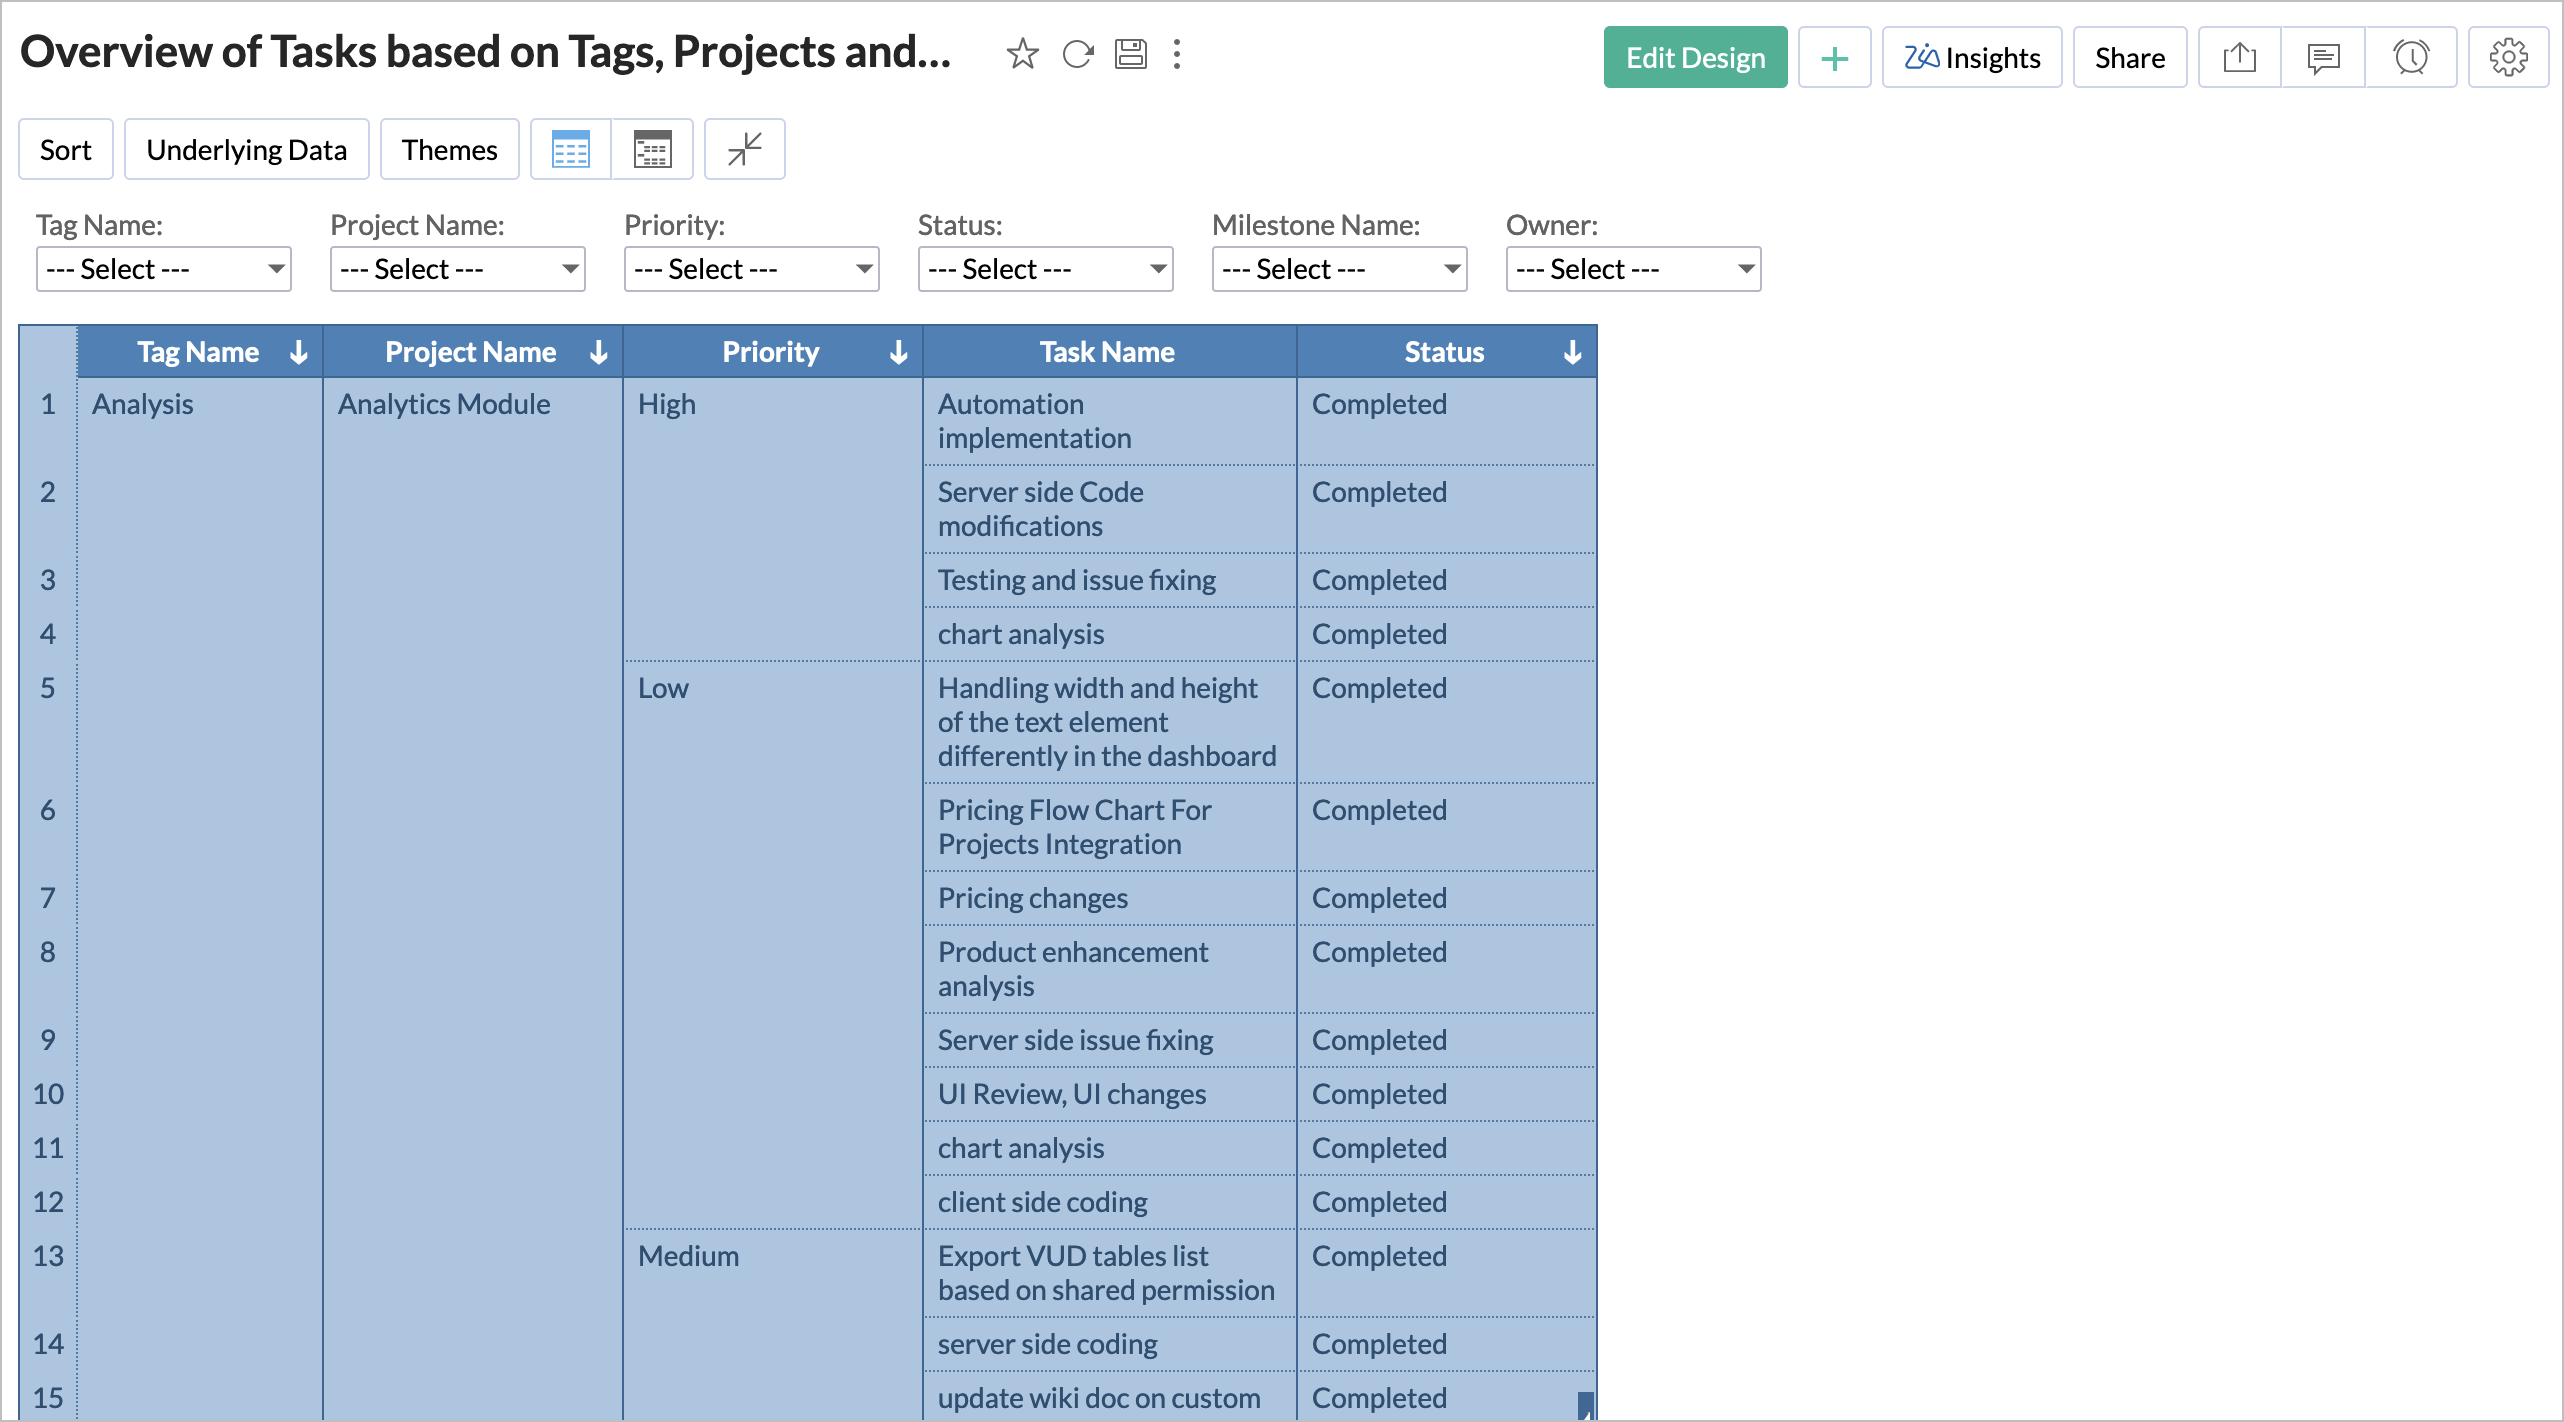
Overview of Tasks based on the Tags, Projects and Priority
Follow the below steps to create this report.
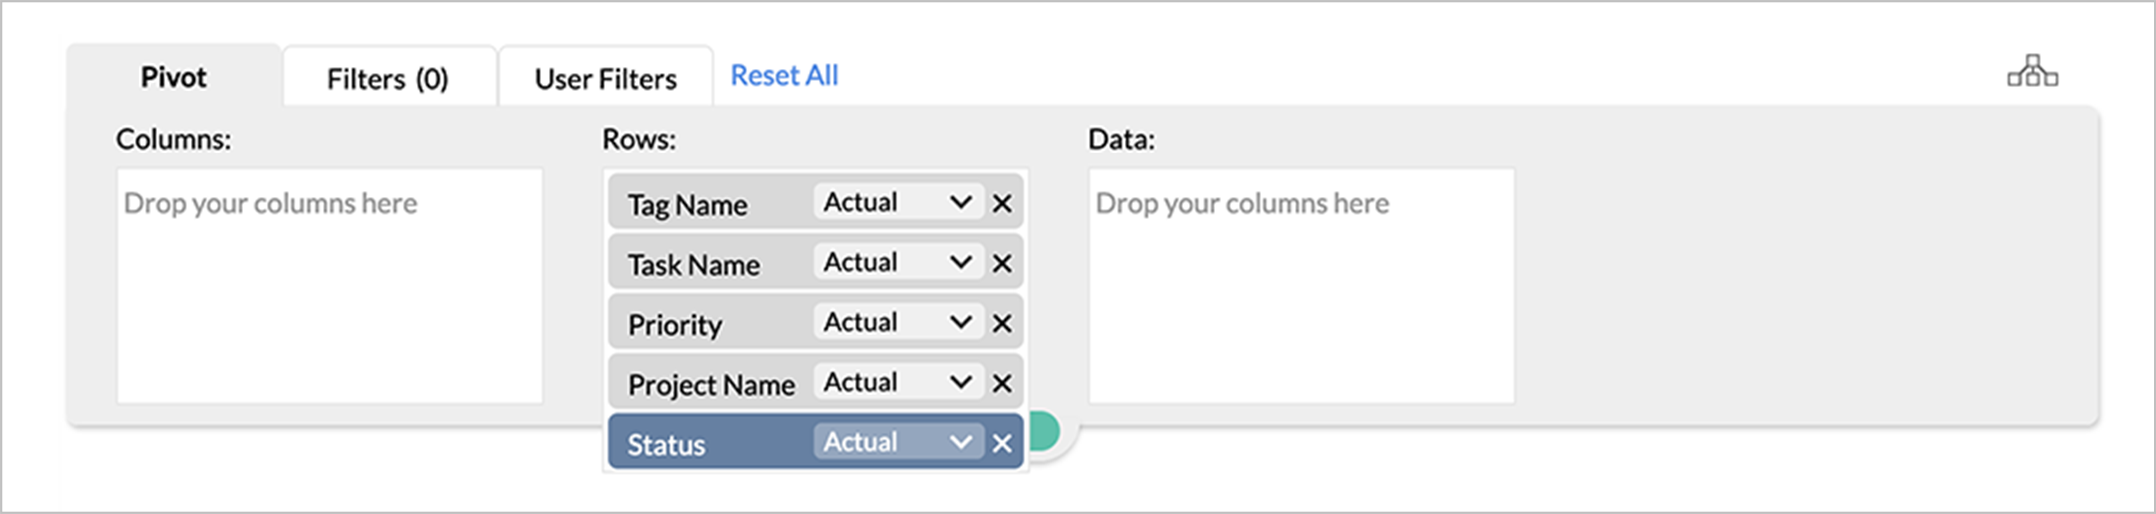
- Create a new pivot over the Tasks table.
- Drop the columns in the Column field as follow.
- Project Name, Priority, Tasks Name and Status from the Tasks table
- Tag Name from the Tags table
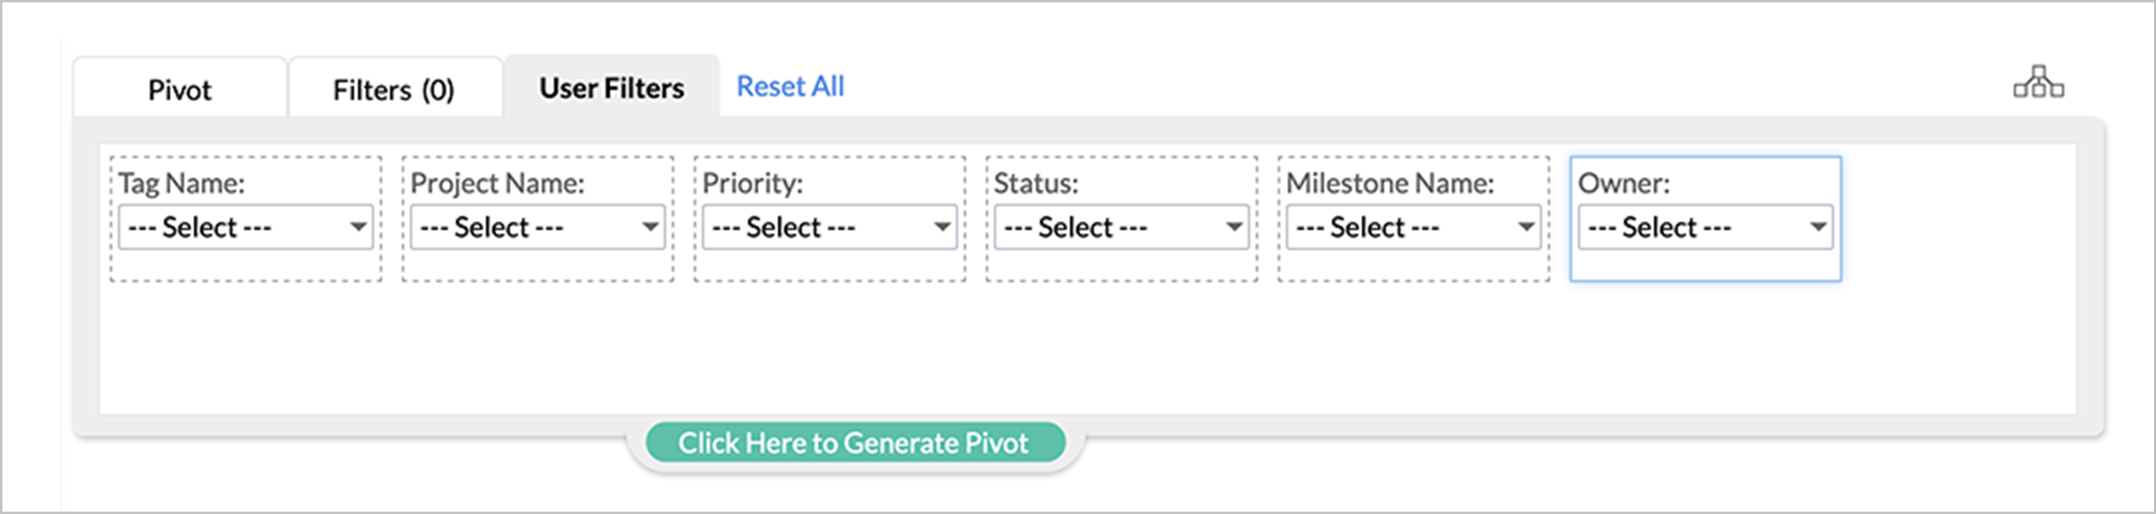
- You can add the Tag Name, Project Name, Priority, Status, Milestone and Owner as User Filter.
Final Report
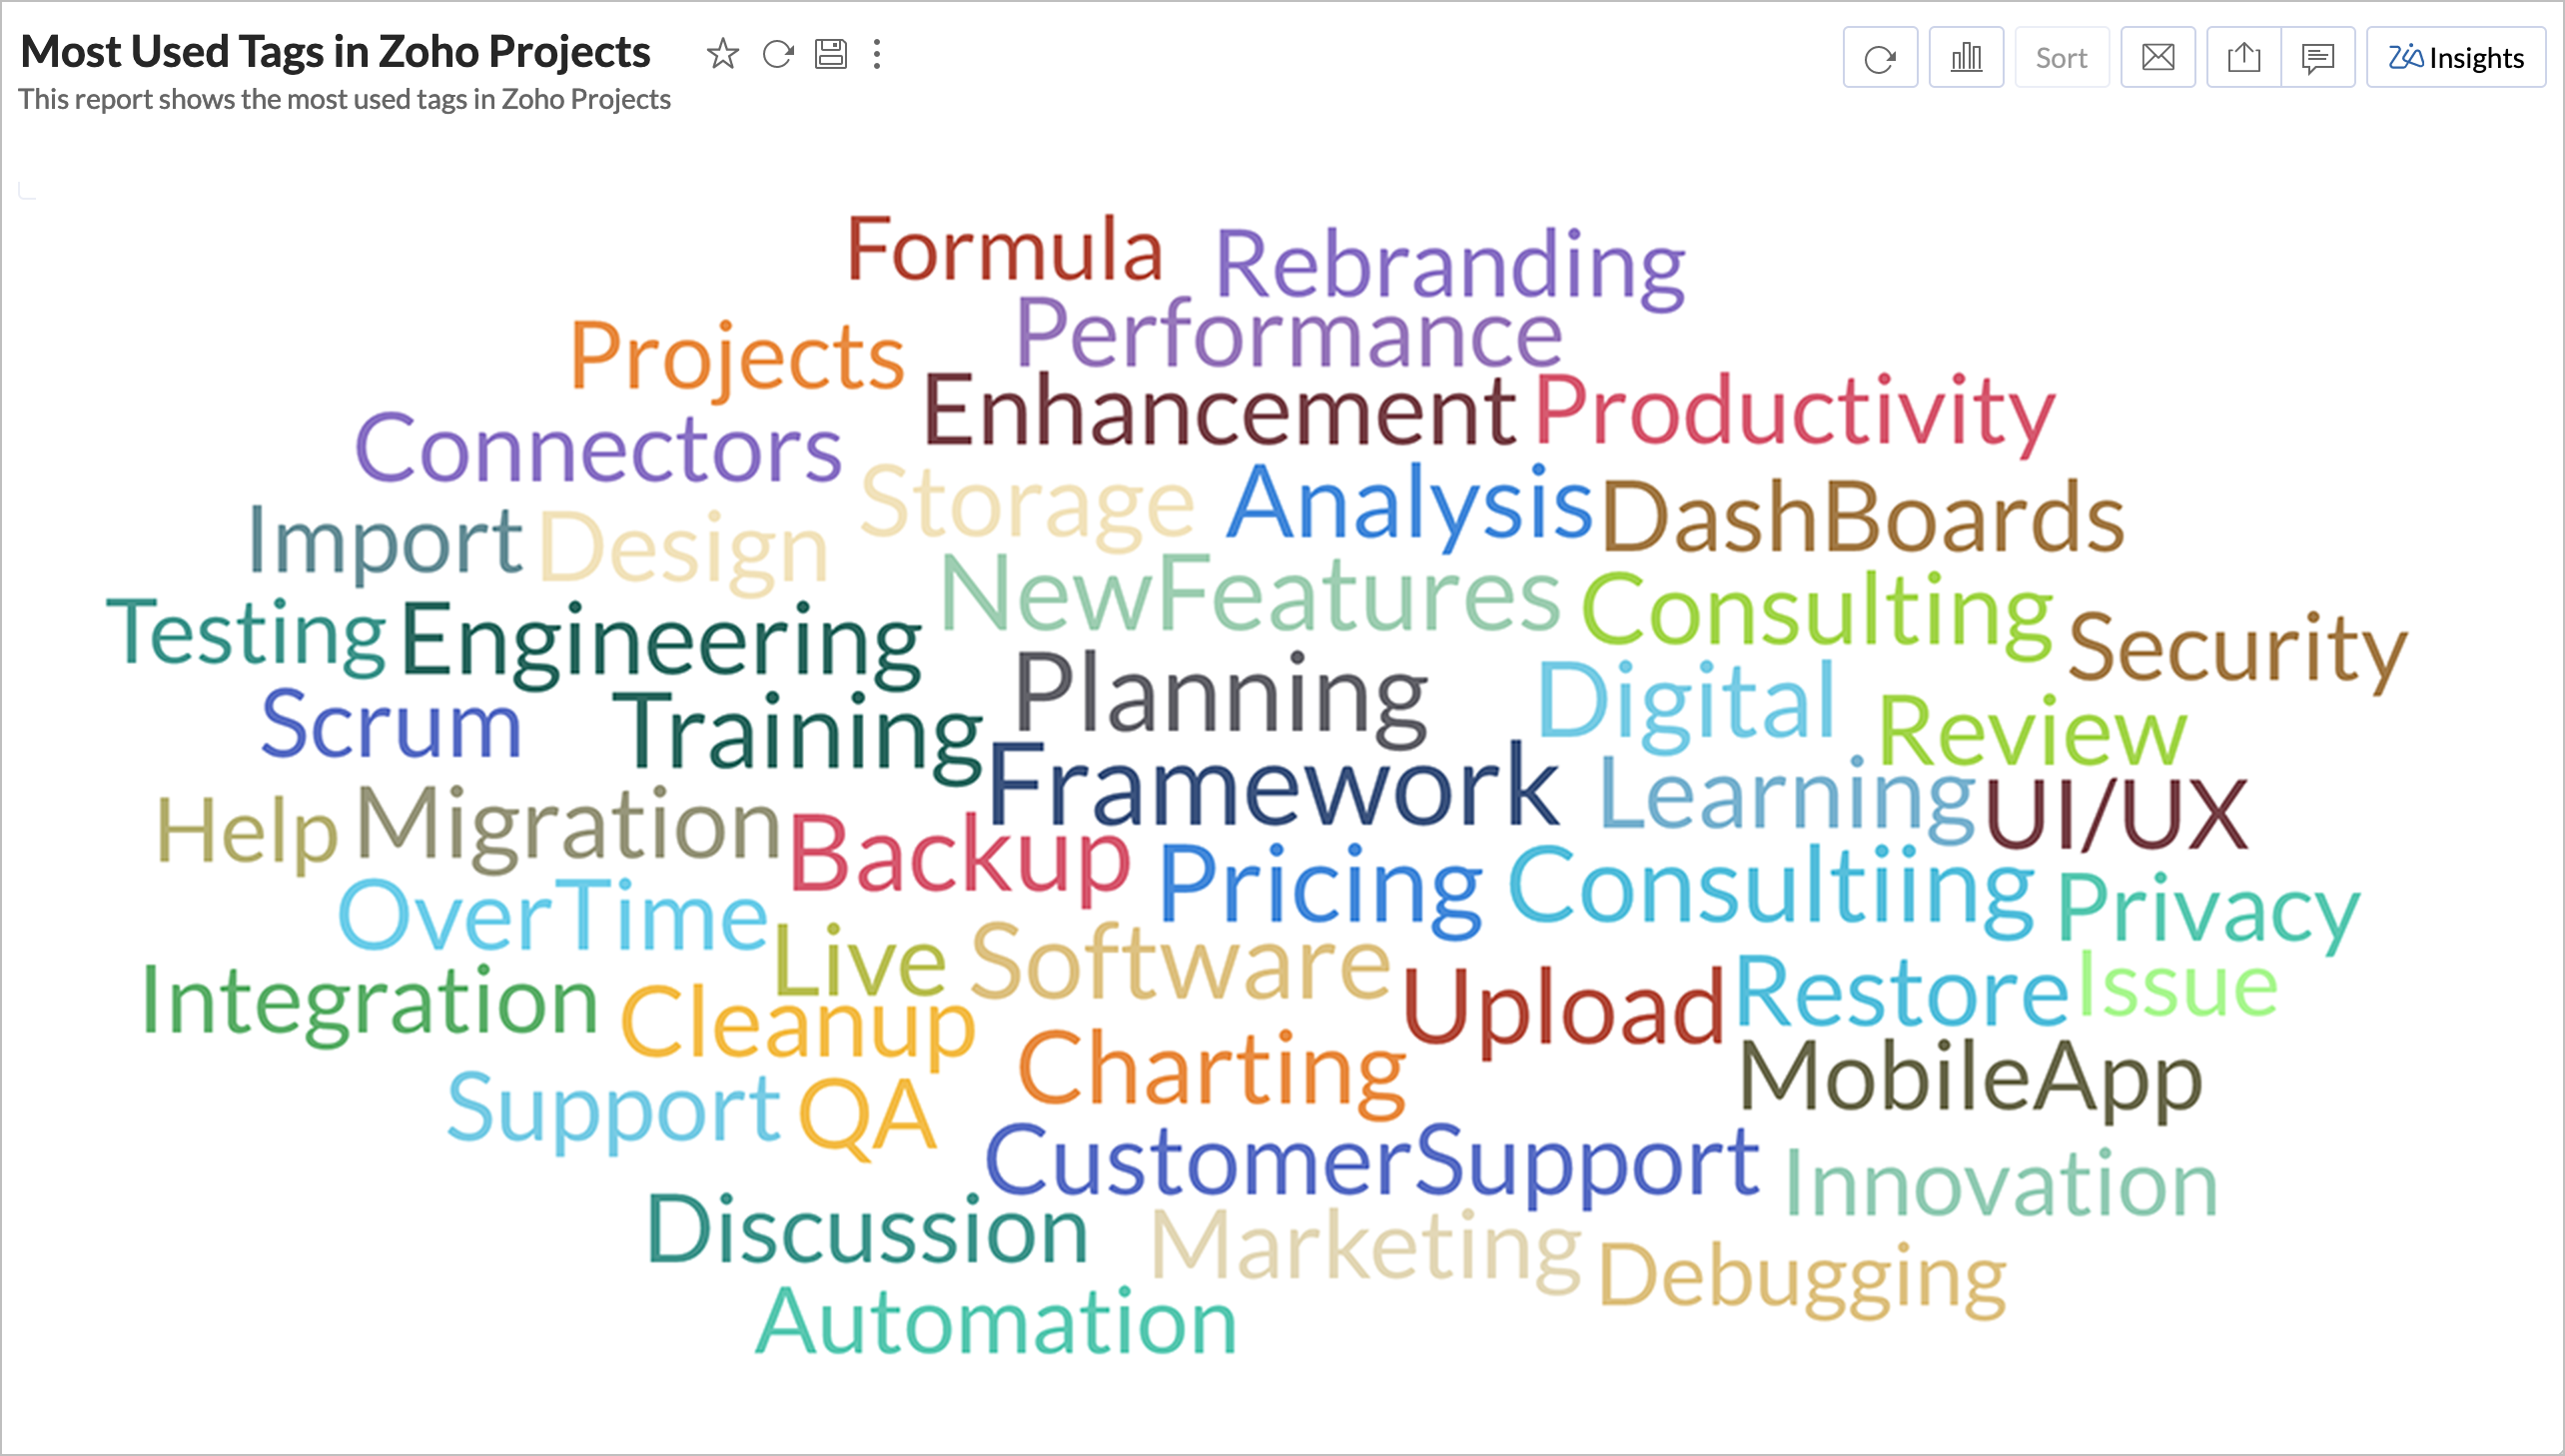
Most Used Tags across the Projects
Now you can visualize the Most Used Tags across the Projects. Follow the below steps to do this.
- Create a new chart over the Tags Consolidation query table.
- Drop the columns as follow
- X-Axis - Tag Name with Actual from the Tags table
- Y-Axis - Tag ID with Count from Tags Consolidation query table
- Color - Tag Name with Actual from the Tags table
- Size - Tag ID with Count from Tags Consolidation query table
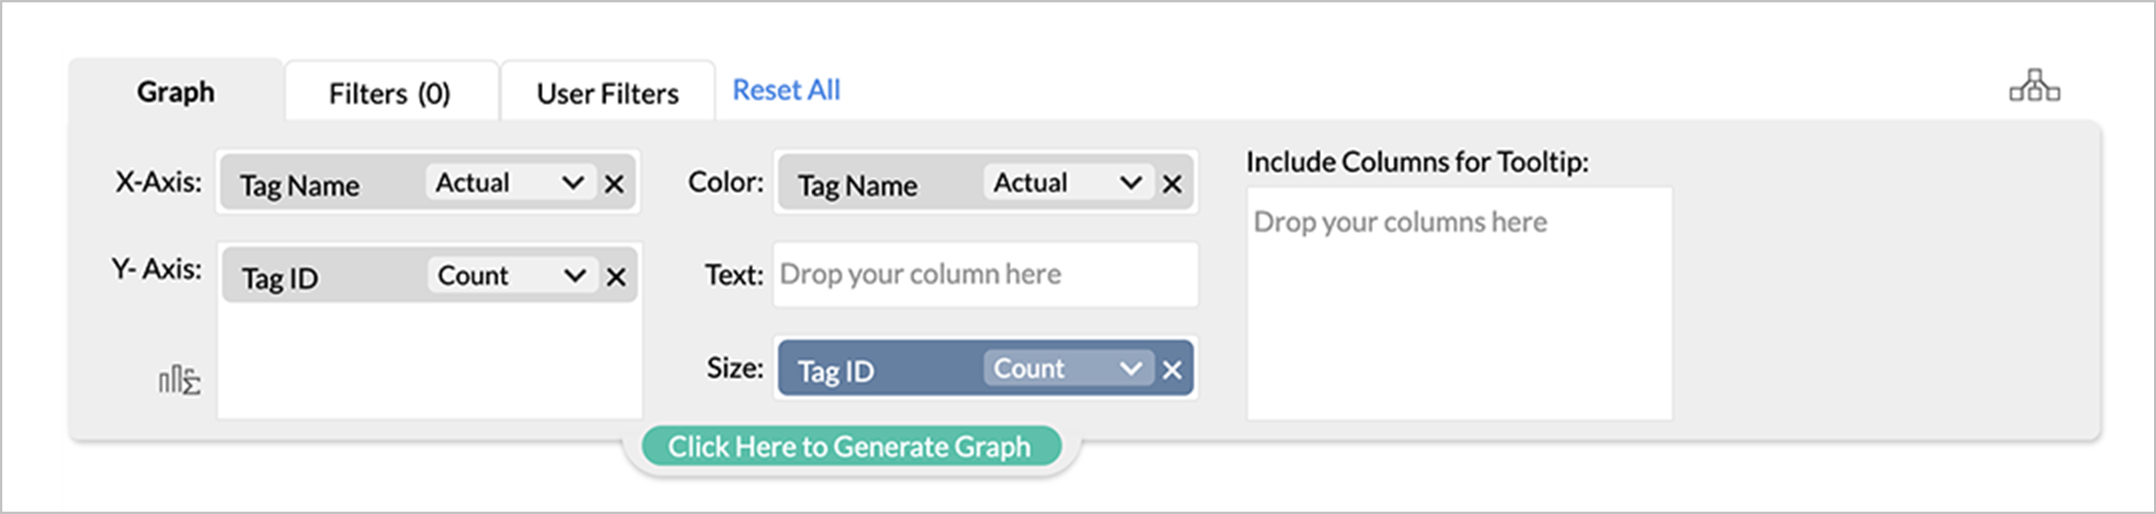
- Click Click here to Generate Graph to create the chart.
- Change the chart type as Word Cloud Chart.
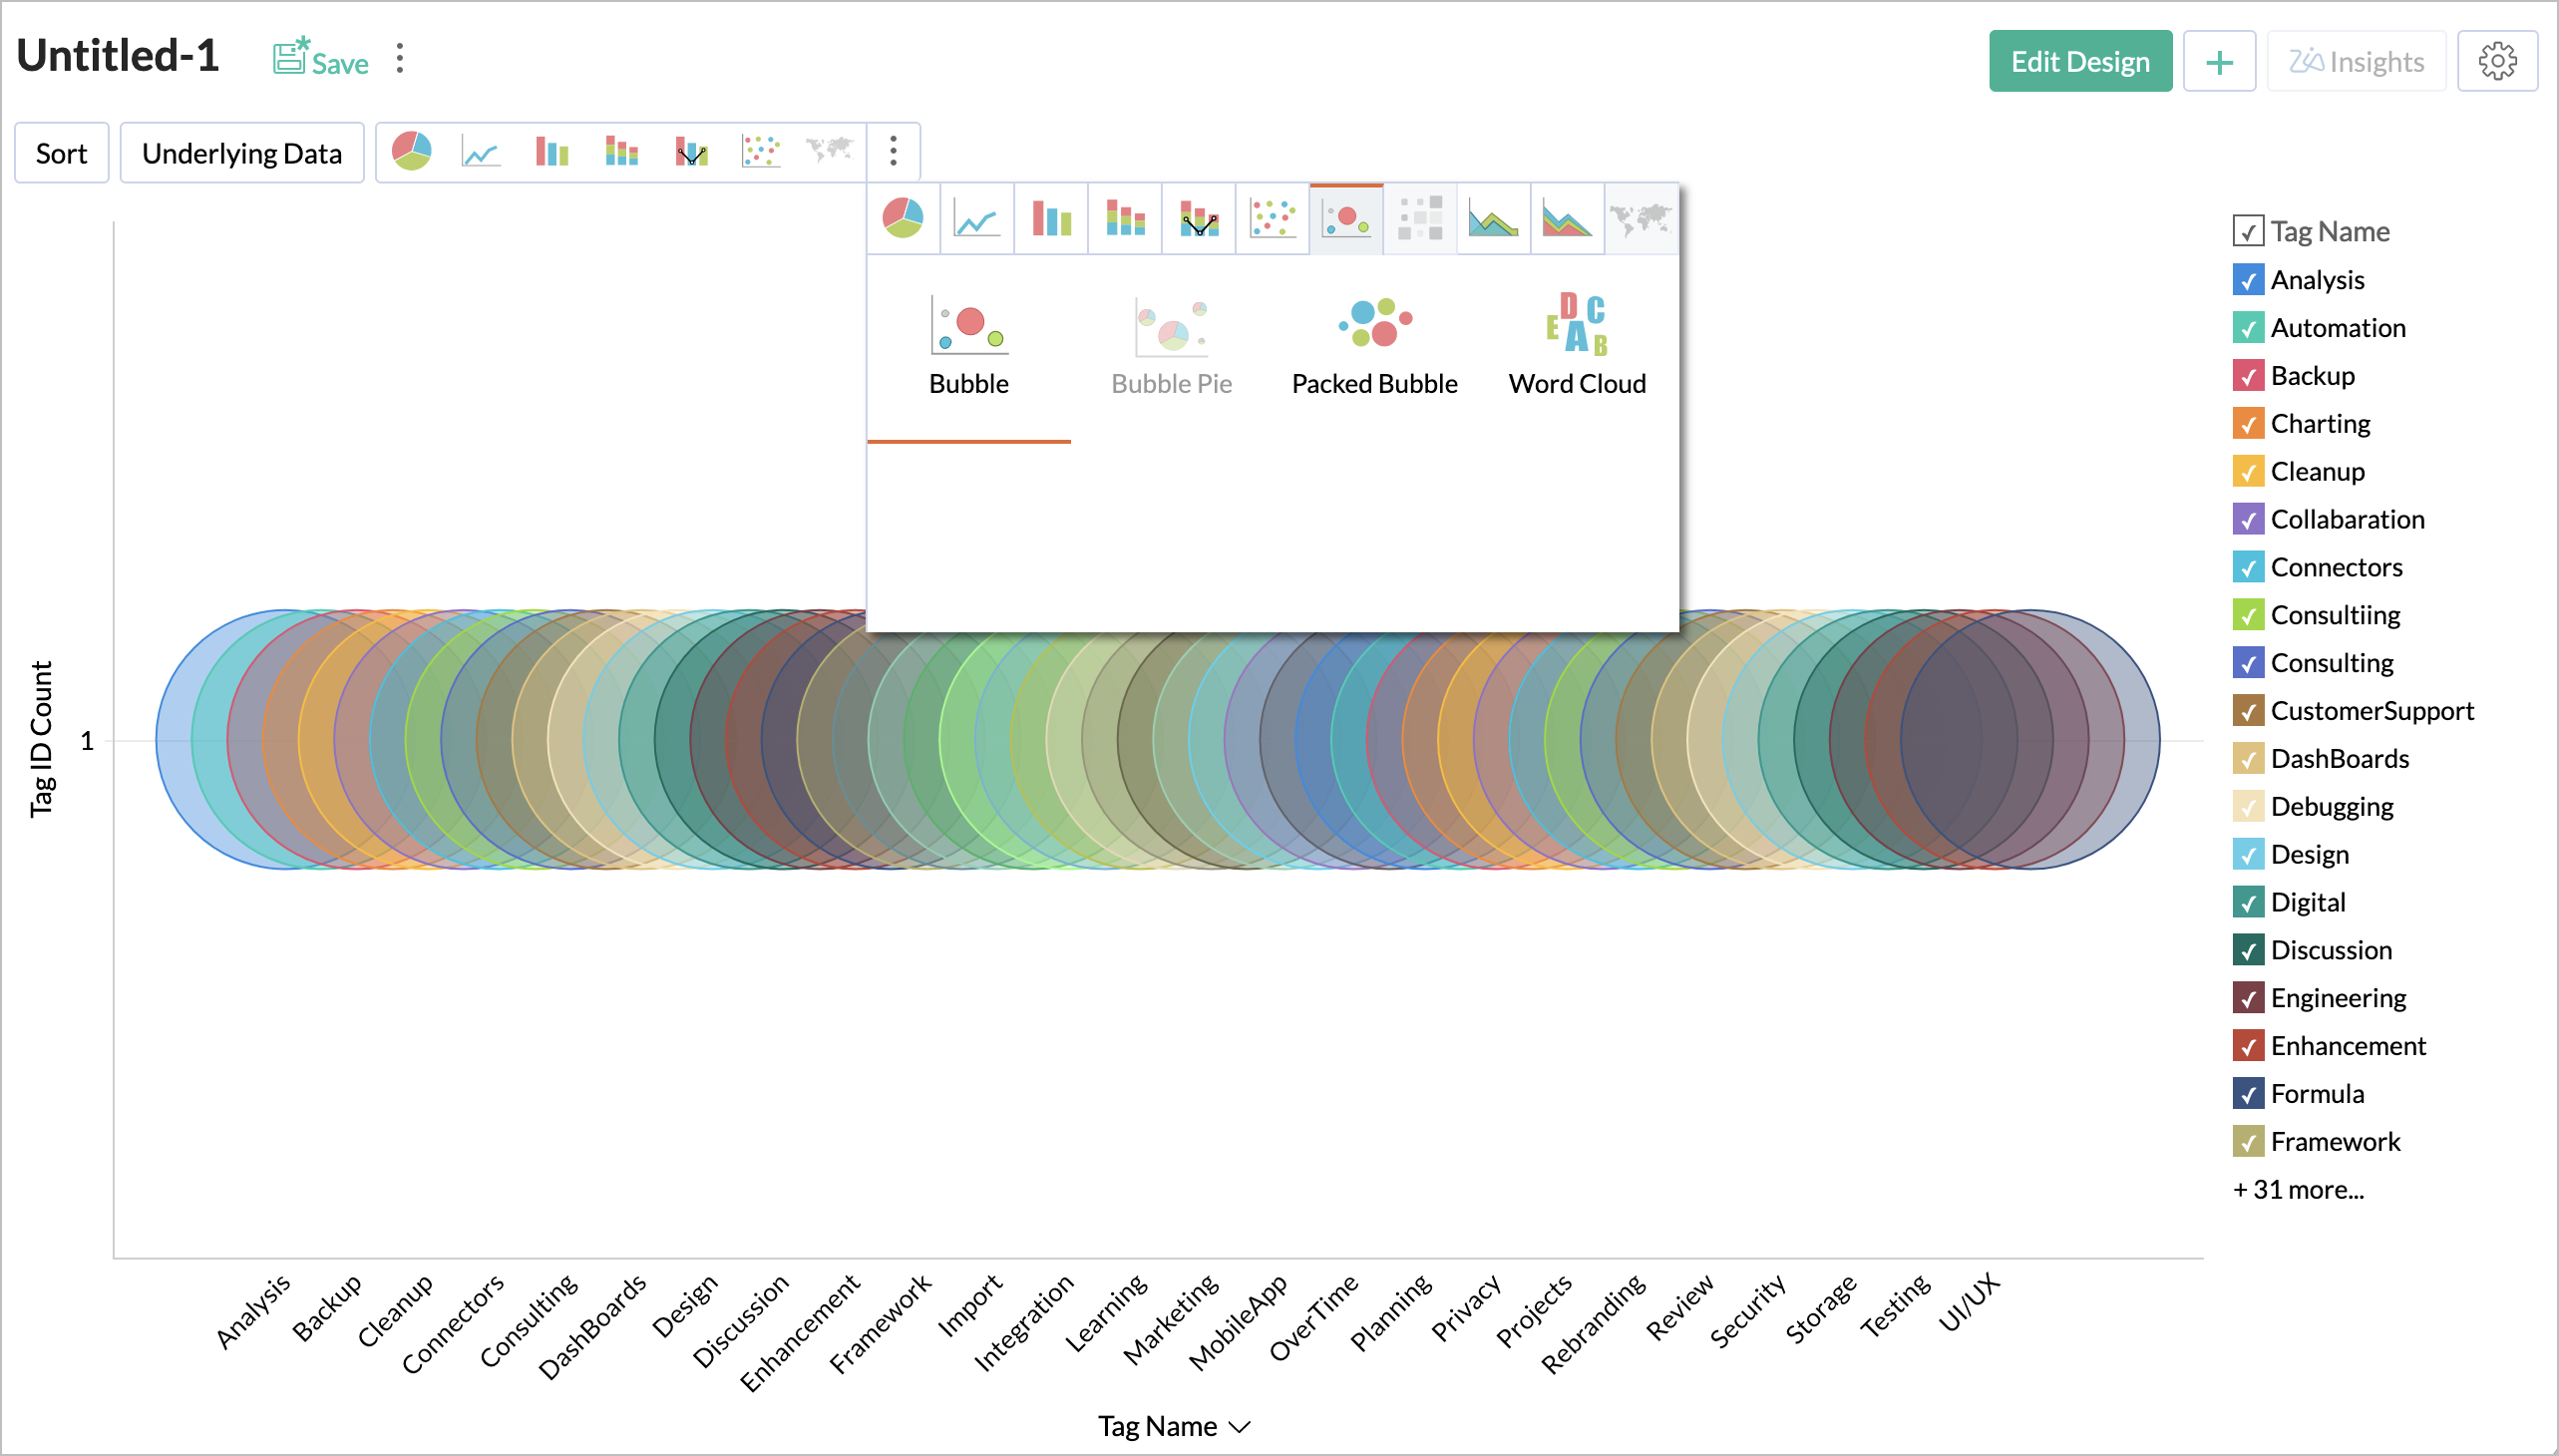
- Final chart is ready save it.