What's New in Zoho Analytics - April 2026
Hello Users!
April brings a fresh set of updates and enhanced capabilities designed to make your analytics more intuitive and efficient. Explore What's New!

Zia Insights in Dashboards
We’re bringing the power of Zia Insights directly into dashboards. No longer limited to individual reports, Zia now analyzes all reports within a dashboard and delivers business-ready insights, helping you connect the dots and take action faster.
It provides insights across key categories such as contribution, seasonal trends, forecasting, and diagnostics, helping you understand what happened, why it happened, and what to do next with clear, actionable recommendations. Learn more.
GenAI Configuration Enhancements
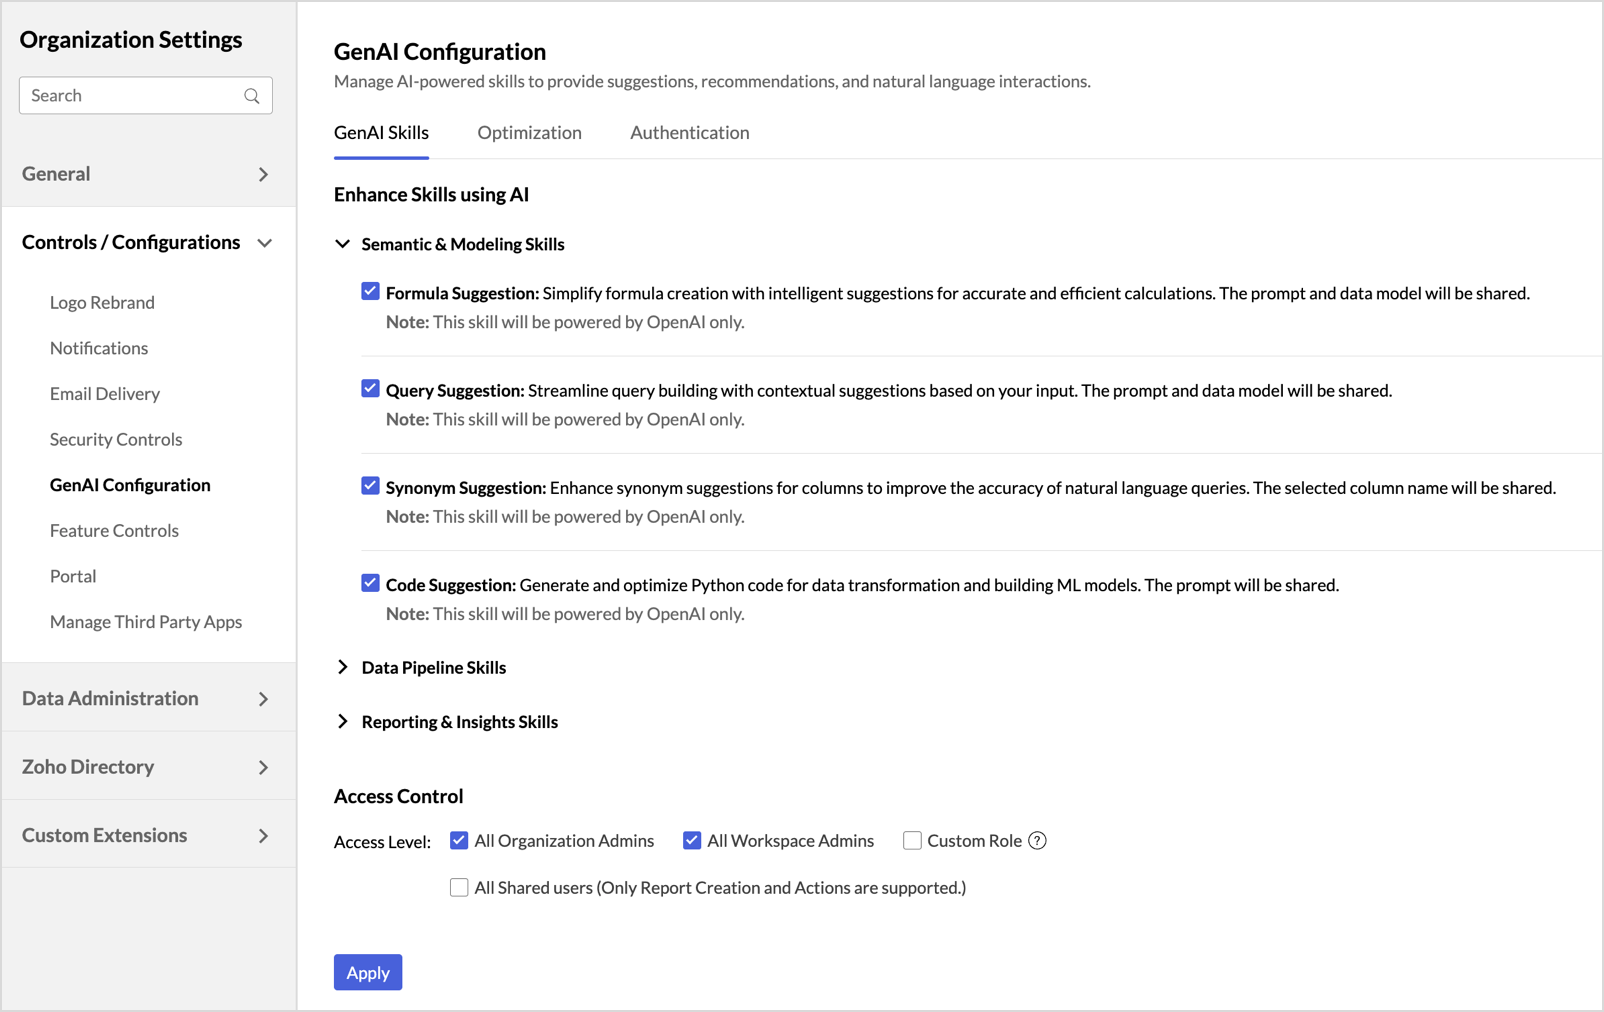
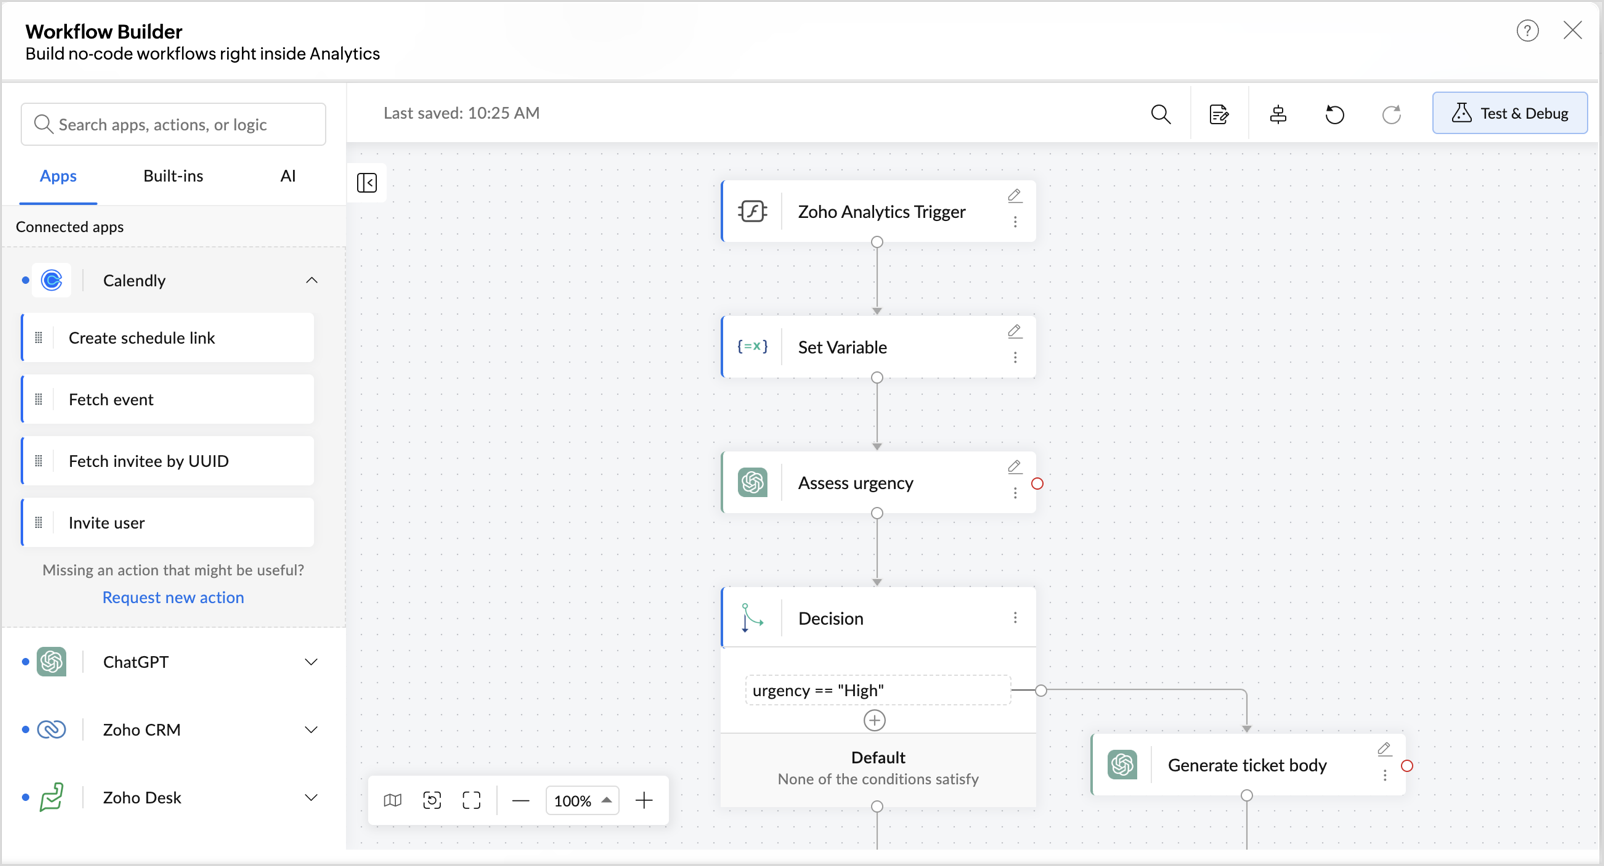
Create Workflows Directly in Zoho Analytics
Zoho Analytics now takes workflow automation a step further. Previously limited to basic actions, you can now build end-to-end workflows that connect multiple applications seamlessly. Trigger actions across different apps directly from your reports and dashboards, enabling you to move from insights to execution without switching applications. Learn more.
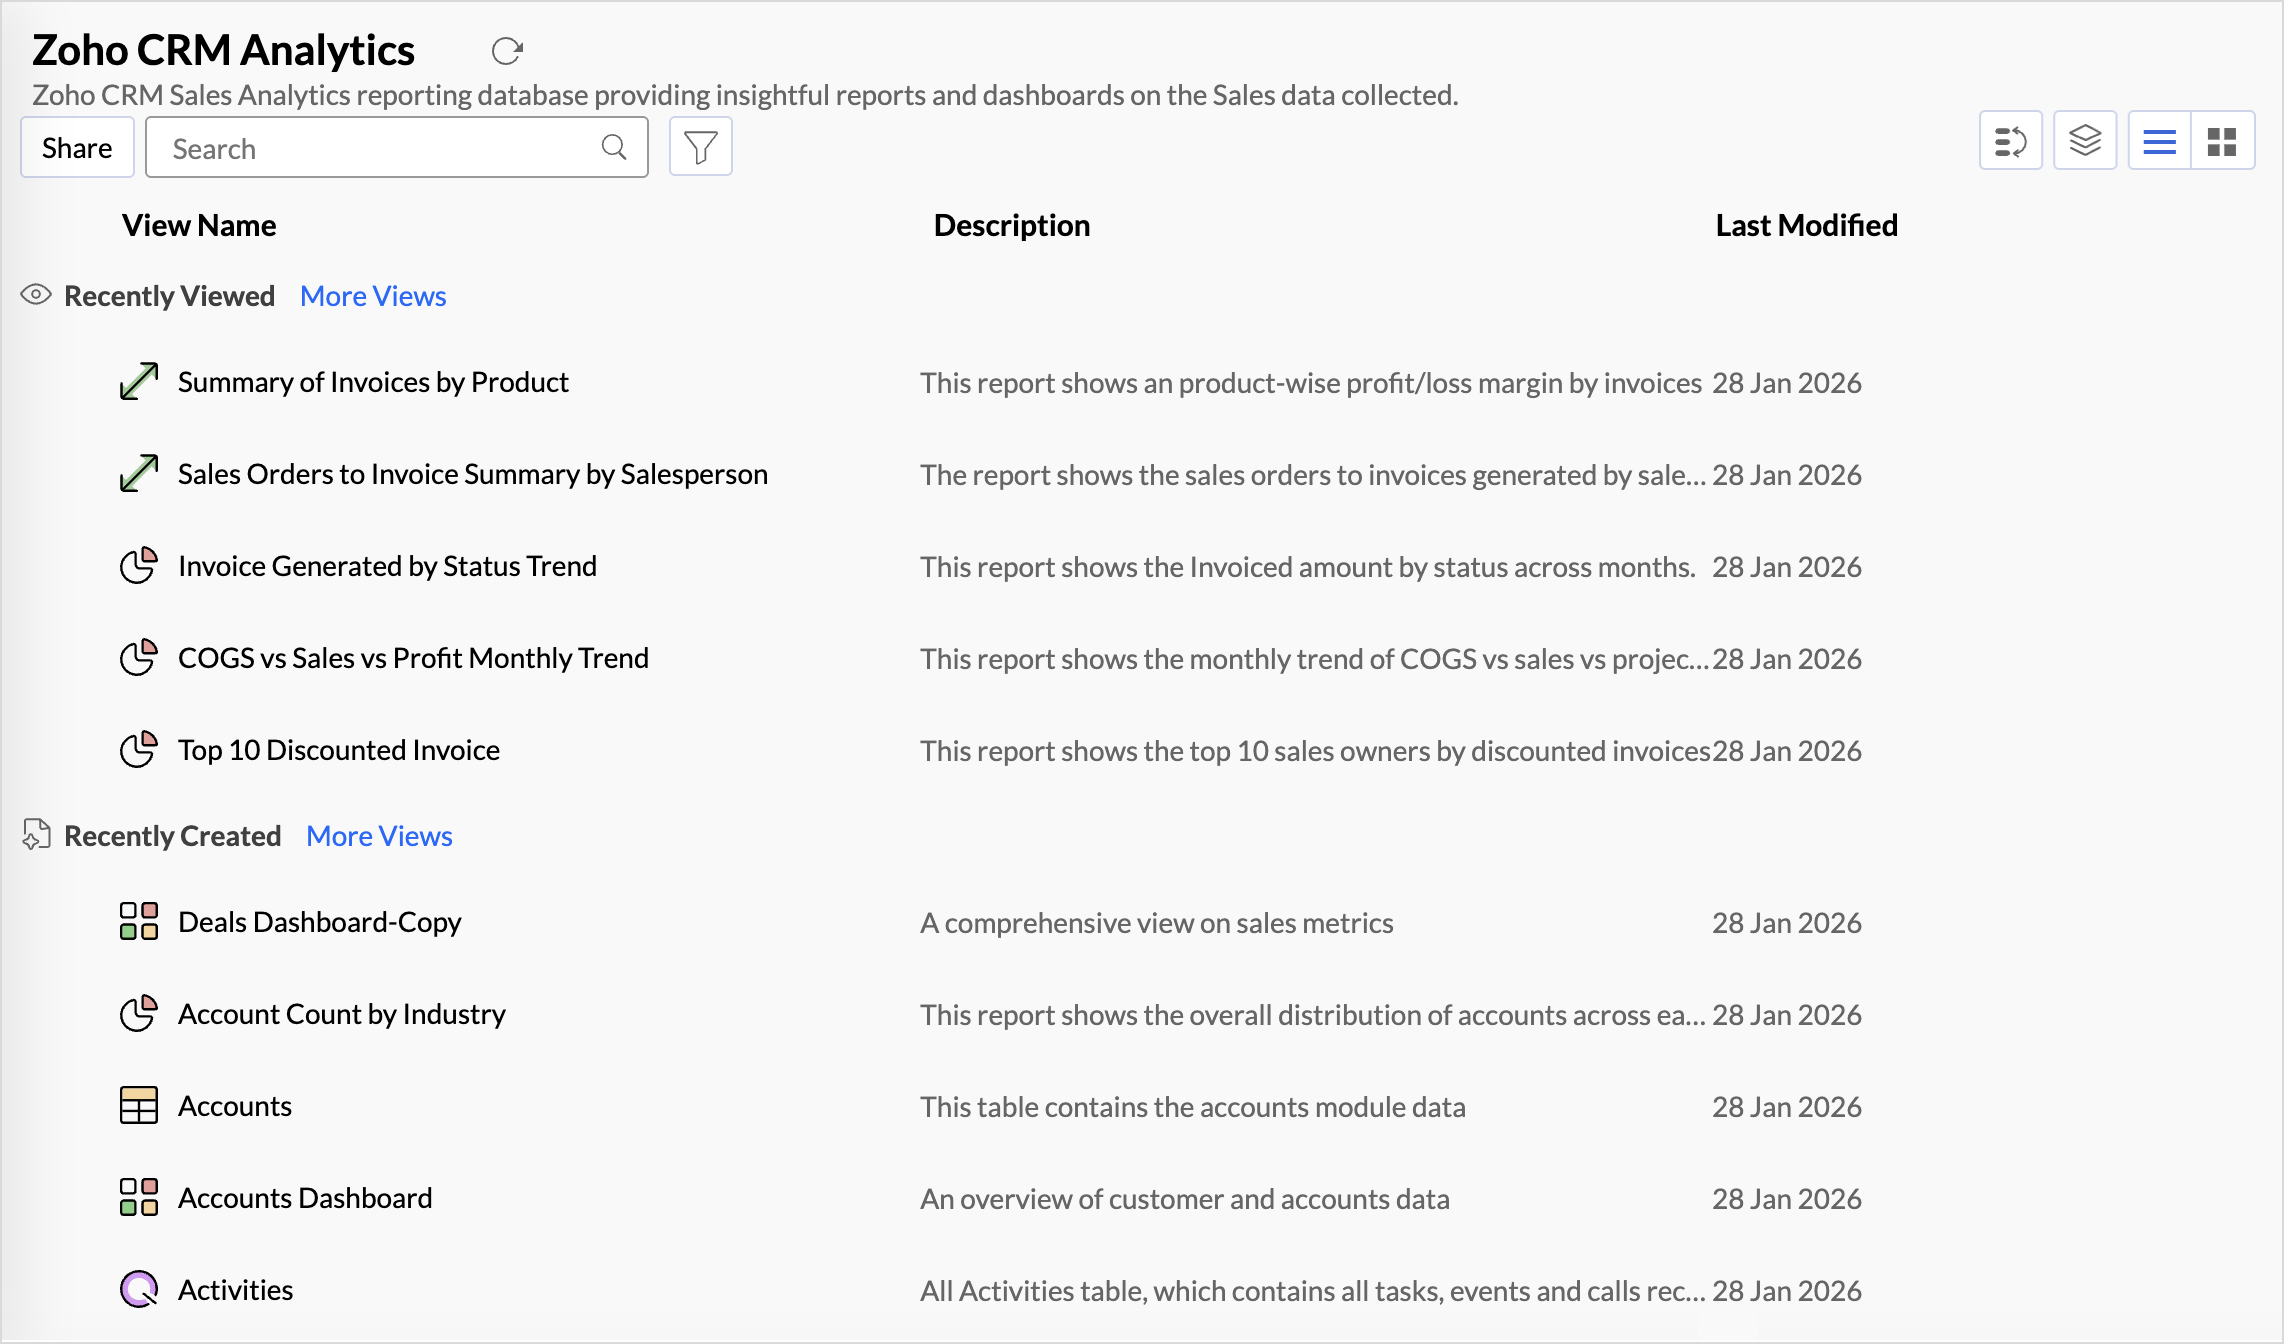
Classified Views
The new Classified View option on the Explorer page enhances how you discover and access reports. Instead of manually searching through folders or lists, views are automatically grouped into meaningful categories such as recently accessed, frequently used, or recently modified, making navigation faster. Learn more.
New Business Applications
Zoho Analytics introduces integration with 2 new applications.
- Notion: Import and analyze your workspace data, including tasks, projects, and databases. Track progress, identify bottlenecks, and build dashboards for better project visibility and team productivity.
- Recurly: Bring in your subscription and billing data to monitor key metrics like MRR, churn, and revenue. Gain insights into customer behavior and optimize your subscription business with interactive reports.
Other Enhancements
- New Modules in Google Ads: We’ve added three new modules to enhance your Google Ads analytics and provide deeper campaign insights: Campaign Geo Performance, Asset Performance, and Assets to analyze location-based results, measure asset effectiveness, and manage all campaign assets in one place.
- Export Dashboards as Excel (ZIP): You can now export dashboards as Excel files bundled in a ZIP. Each report within the dashboard is exported as a separate Excel sheet/file, making it easy to access, share, and analyze the data offline.