What's New in Zoho Analytics - August 2026
Hello Users!
This month puts you in control of how your analytics moves: promote content safely between workspaces with Deployment Management, govern data access and sign-in more precisely, and make your forecasts smarter with external drivers. There's also faster live data, new connectors, and finer scheduling across the board.

Administration & platform
Bigger control over how your analytics content is built, promoted, and accessed.
Deployment Management 
Your analytics content now gets a release pipeline of its own, so you never have to edit reports in a live workspace and hope nothing breaks. Deployment Management connects your workspaces as ordered stages, such as Development, Testing, and Production, letting you build freely, validate at every step, and see exactly what changed before you promote anything. Push to production only when it is ready. Deployments carry only the metadata from one stage to the next, so your live data is never touched, and the full history stays one click away. Head to Organization Settings and create your first deployment flow.
For more information, visit the Deployment Management help document.
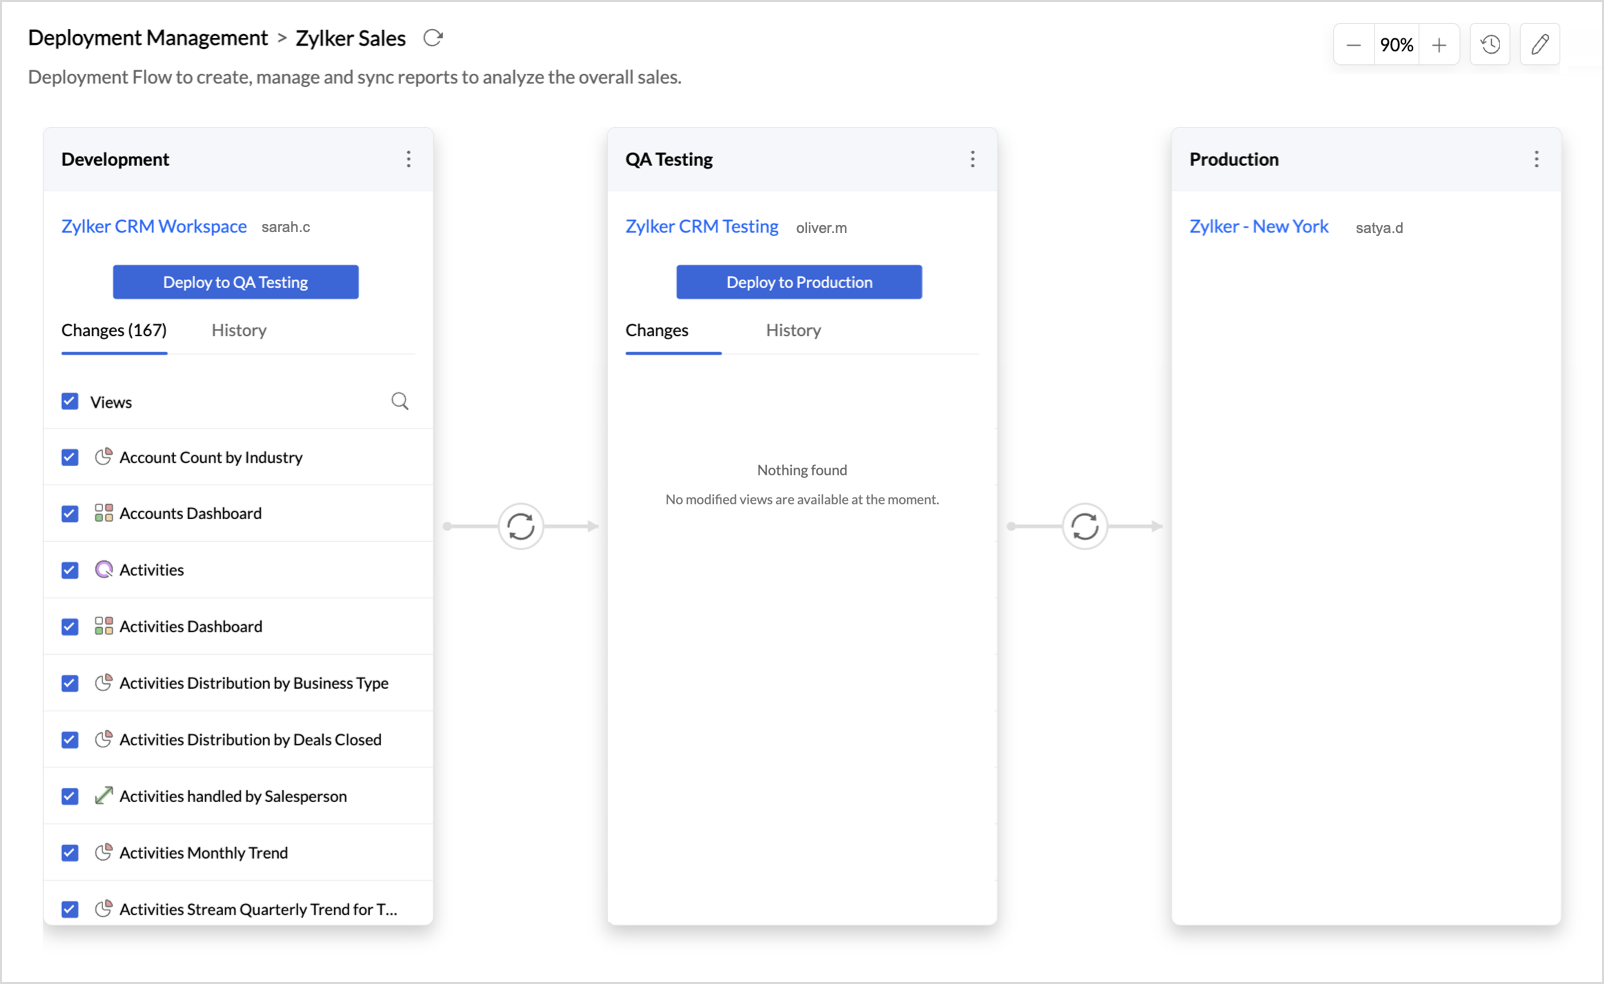
For more information, visit the Deployment Management help document.
Data source permissions for custom roles 
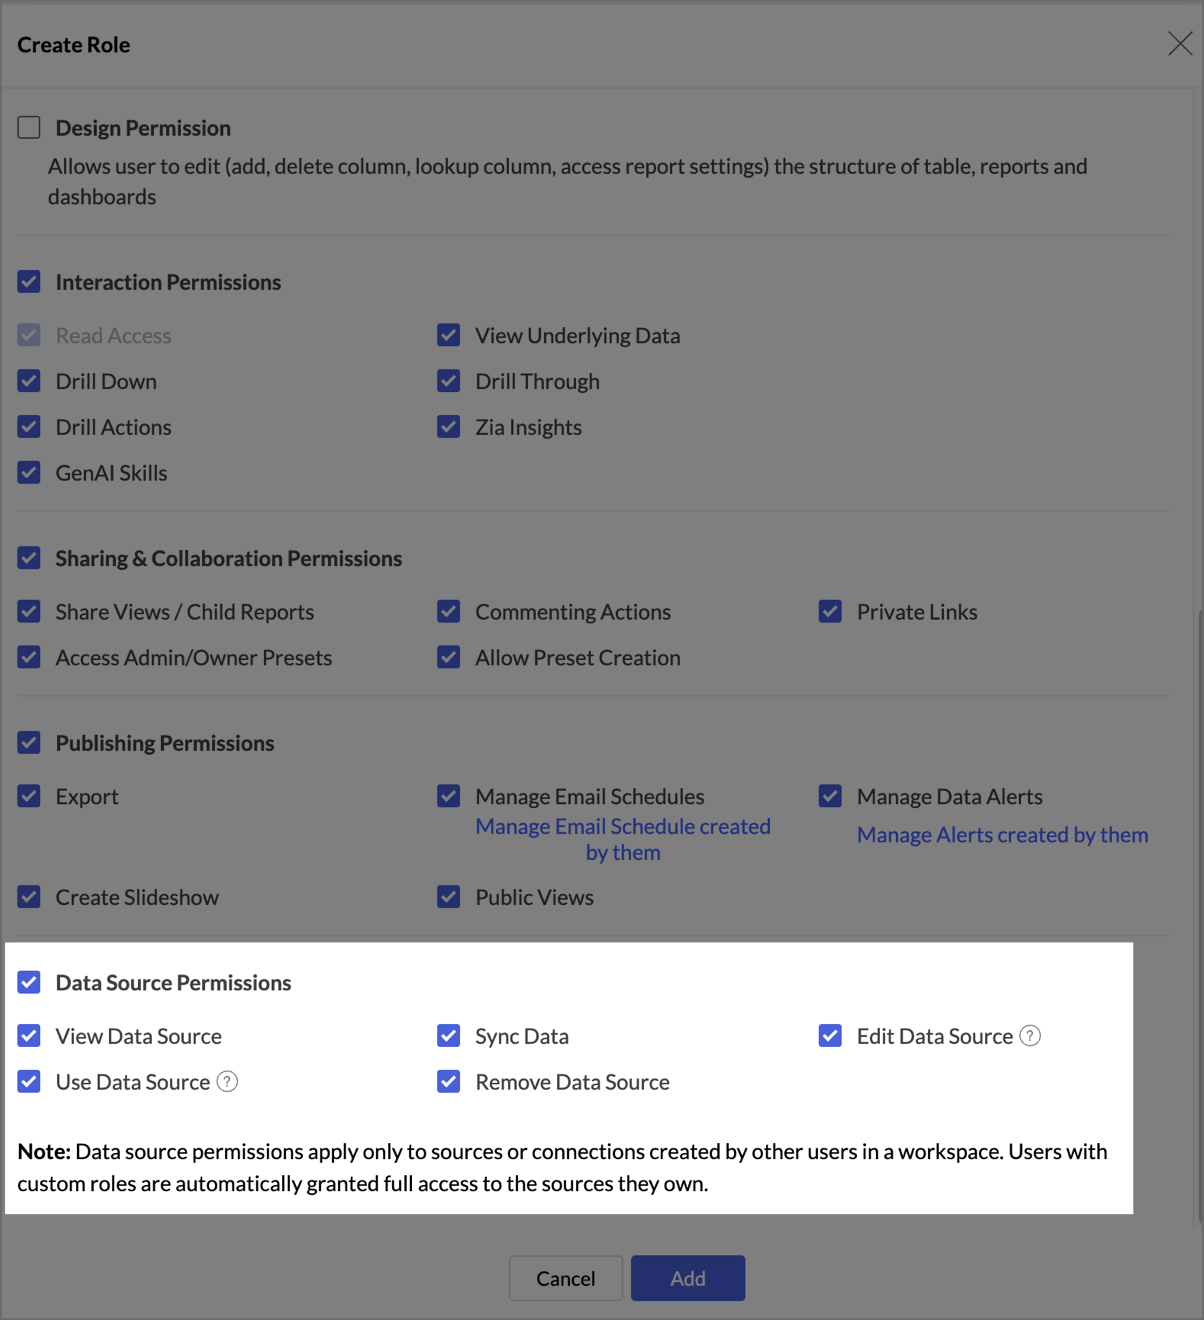
Custom roles with the All Data, Reports And Dashboards access type now include a dedicated set of data source permissions: View, Use, Sync, Edit, and Remove Data Source. Grant exactly the level of data source access each role needs; these permissions apply to essential connectors and to sources created by other users, while users always keep full access to the sources they own.
New sign-in methods for white label portal users 
Zoho Analytics now supports social sign-in for your white label portal. Configure Google, Facebook, LinkedIn, or Microsoft from the new Sign-in Methods tab in White Label Settings, and let your users sign in with an account they already use instead of setting up a new password. For more information, visit the Manage Configuration help document.
Multilevel subfolders 
You can now nest subfolders deeper within your workspace folders, giving you improved flexibility to organize reports and dashboards the way your team actually works.
For more information, visit the Viewing Workspace help document.
For more information, visit the Viewing Workspace help document.
Advanced Analytics
Multivariate forecasting: exogenous variable support 
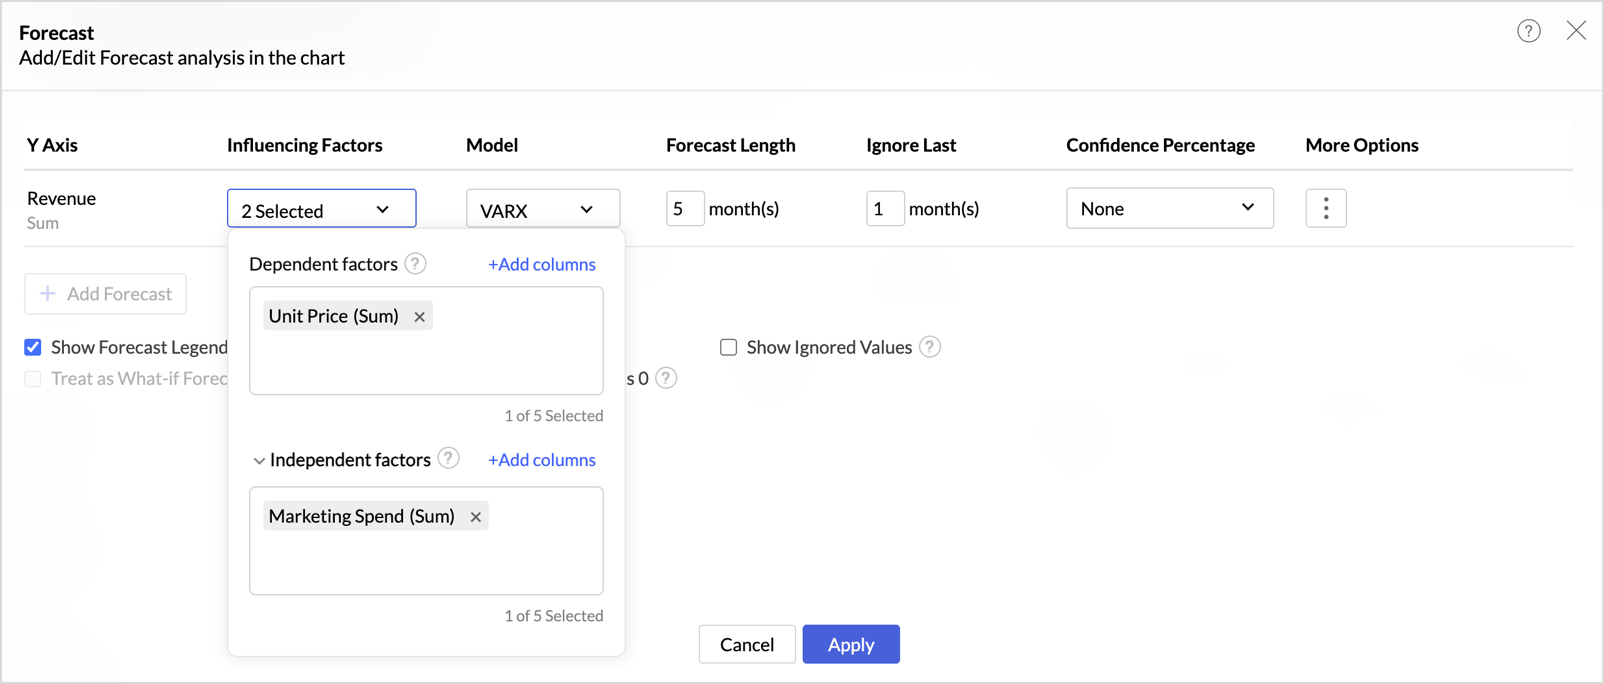
Forecasts can now account for external drivers that influence your metric without being driven by it. When adding influencing factors, you can group them as dependent and independent factors, up to five in total. Dependent factors are endogenous variables that move together with your target, such as revenue or demand when forecasting sales. Independent factors are exogenous variables, such as marketing spend, discounts, or campaign budget, which influence sales but are not driven by it. With dependent factors alone, the VAR model is applied; adding independent factors switches the forecast to VARX (Vector Auto Regression with exogenous variables). The Forecast Model dialog names the model applied and lists the factors used.
For more information, visit the Forecasting help document.
For more information, visit the Forecasting help document.
Data import & connectivity
New sources to connect, and faster access to the ones you already have.
Data Cache for Live Connect 
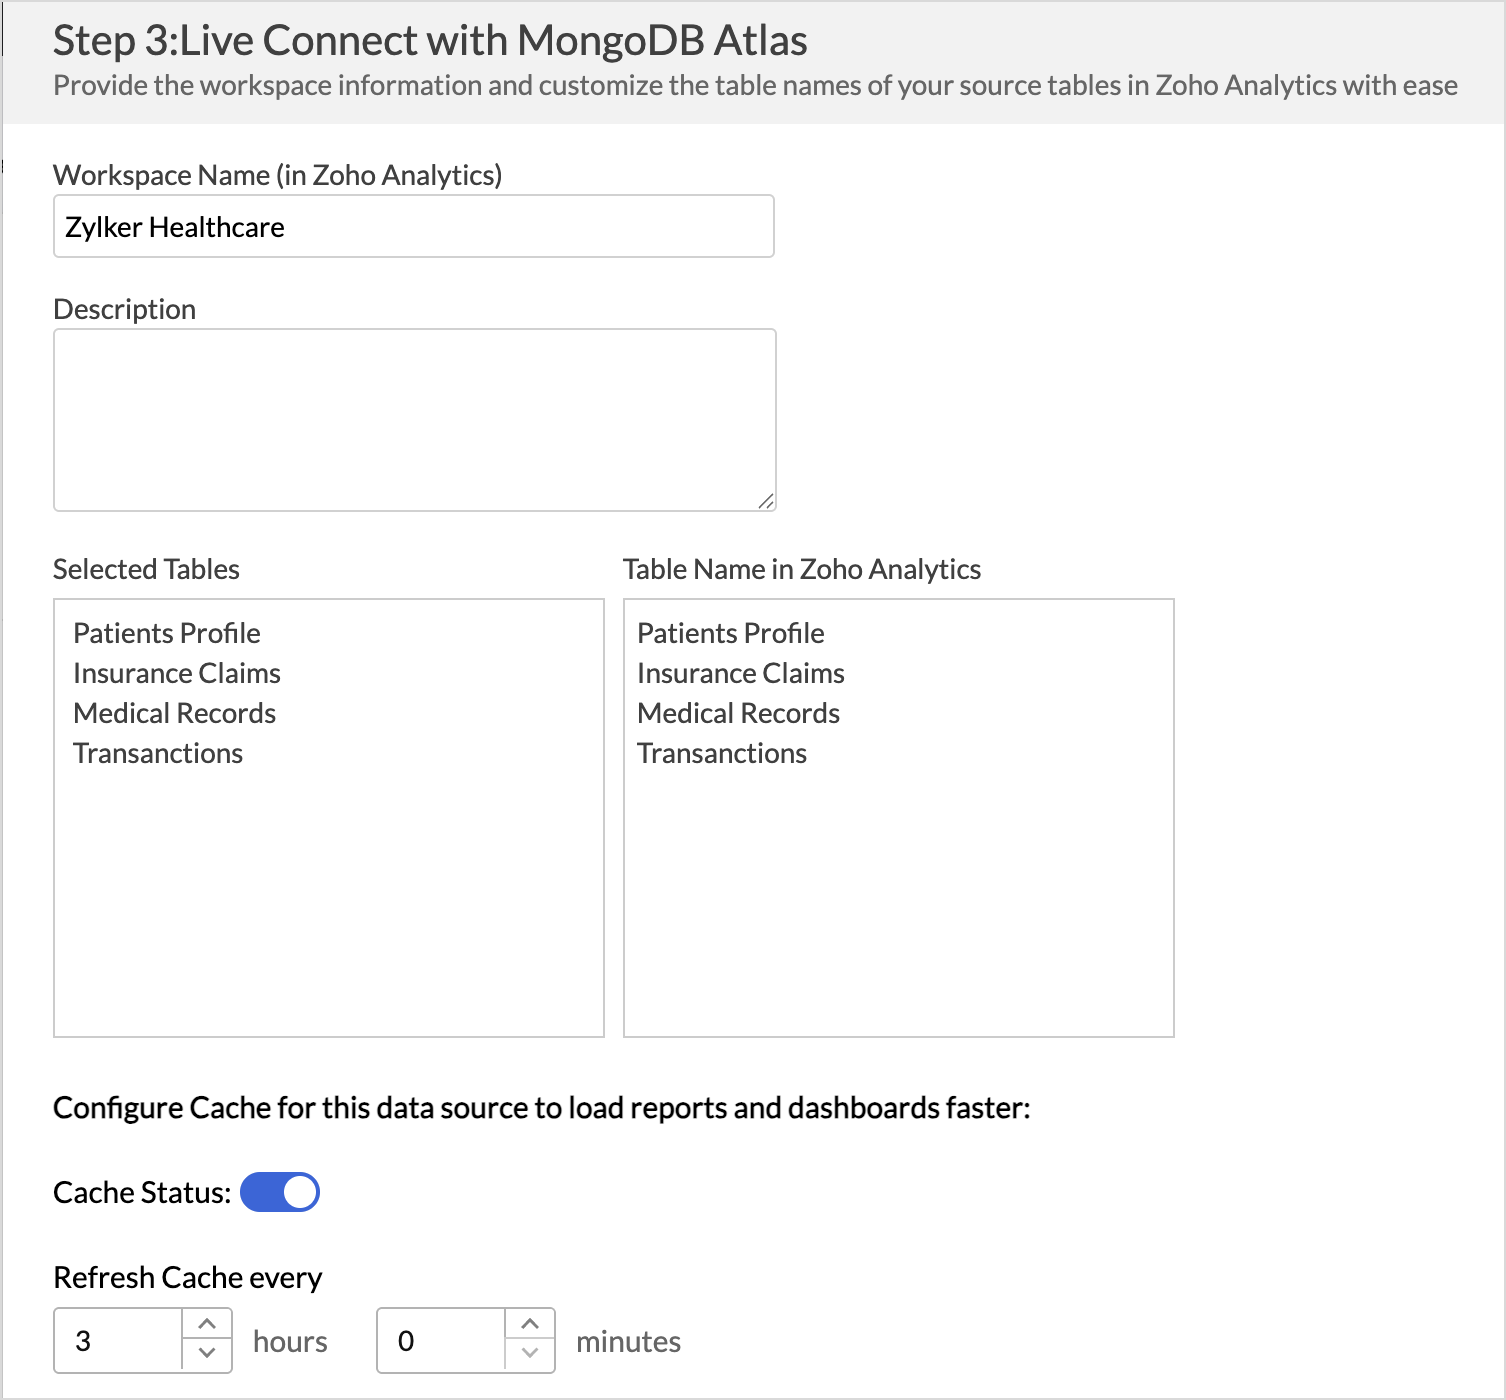
Speed up report and dashboard loading with Data Cache for Live Connect. Zoho Analytics can now cache summary values from your live data source and refresh the cache at an interval you configure, reducing the need to fetch data from the live source for every request. When you need up-to-the-minute numbers, you can still fetch the latest data live whenever needed. For more information, visit the Data Cache for Live Connect help document.
New Connectors 
More business apps and databases you can connect to Zoho Analytics this month:
- Chargebee: Connect your Chargebee data to analyze your subscription billing and revenue. For more information, visit the Chargebee connector help document.
- Help Scout: Bring in your Help Scout data to report on your customer support performance. For more information, visit the Help Scout connector help documentument.
- Supabase: Connect to Supabase as a new database source in Zoho Analytics. For more information, visit the Supabase help document.
Reporting & usability
Compare two metrics in a single widget 
You can now bring two metrics into the same KPI widget. Until now, each widget paired a single metric with a dimension or date; now two metrics (like say, Sales and Cost) can sit together in one view, saving you from building and reading two separate widgets. Try it on any KPI widget and see the comparison for yourself.
For more information, visit the KPI Widgets help document.
For more information, visit the KPI Widgets help document.
Flexible schedules for Data Alerts 
You now have finer control over when Zoho Analytics checks your alert conditions. Monthly schedules let you set an interval of 1 to 12 months, so checks can run monthly, once in two months, or on any longer cycle, and a new Yearly frequency covers annual checks. You can also pick relative-day patterns such as the 1st Sunday or the Last Friday of the month, skip weekends on Hourly and Daily schedules, and set a time zone for each alert.
For more information, visit the Data Alerts help document.
For more information, visit the Data Alerts help document.
Developer platform
New Action APIs for Custom Visualizations 
Four new Action APIs are now available in the Custom Visualizations JS API: invokeViewUnderlyingData, invokeExplainData, invokeDrillThrough, and invokeDrillAction. Each directly invokes the corresponding action for a clicked data point, so your custom visuals can trigger underlying data, explain data, drill through, and drill actions without opening the interaction menu.
For more information, visit the Custom Visualizations page.
For more information, visit the Custom Visualizations page.
That's everything new in Zoho Analytics this August. For the complete list of updates, visit our What's New page.