What's New in Zoho Analytics - February 2026
Hello Users!
Custom Visualizations
One of your most anticipated features is finally here! Custom Visualizations lets you go beyond the built-in chart library and bring your own visual elements to life using third-party JavaScript libraries or custom scripts. Design industry-specific diagrams, specialized plots, or any unique visual format your reporting demands - then configure user-defined settings and manage them all. If you've ever felt limited by standard chart types, this one's for you. Try it out and see what's possible.
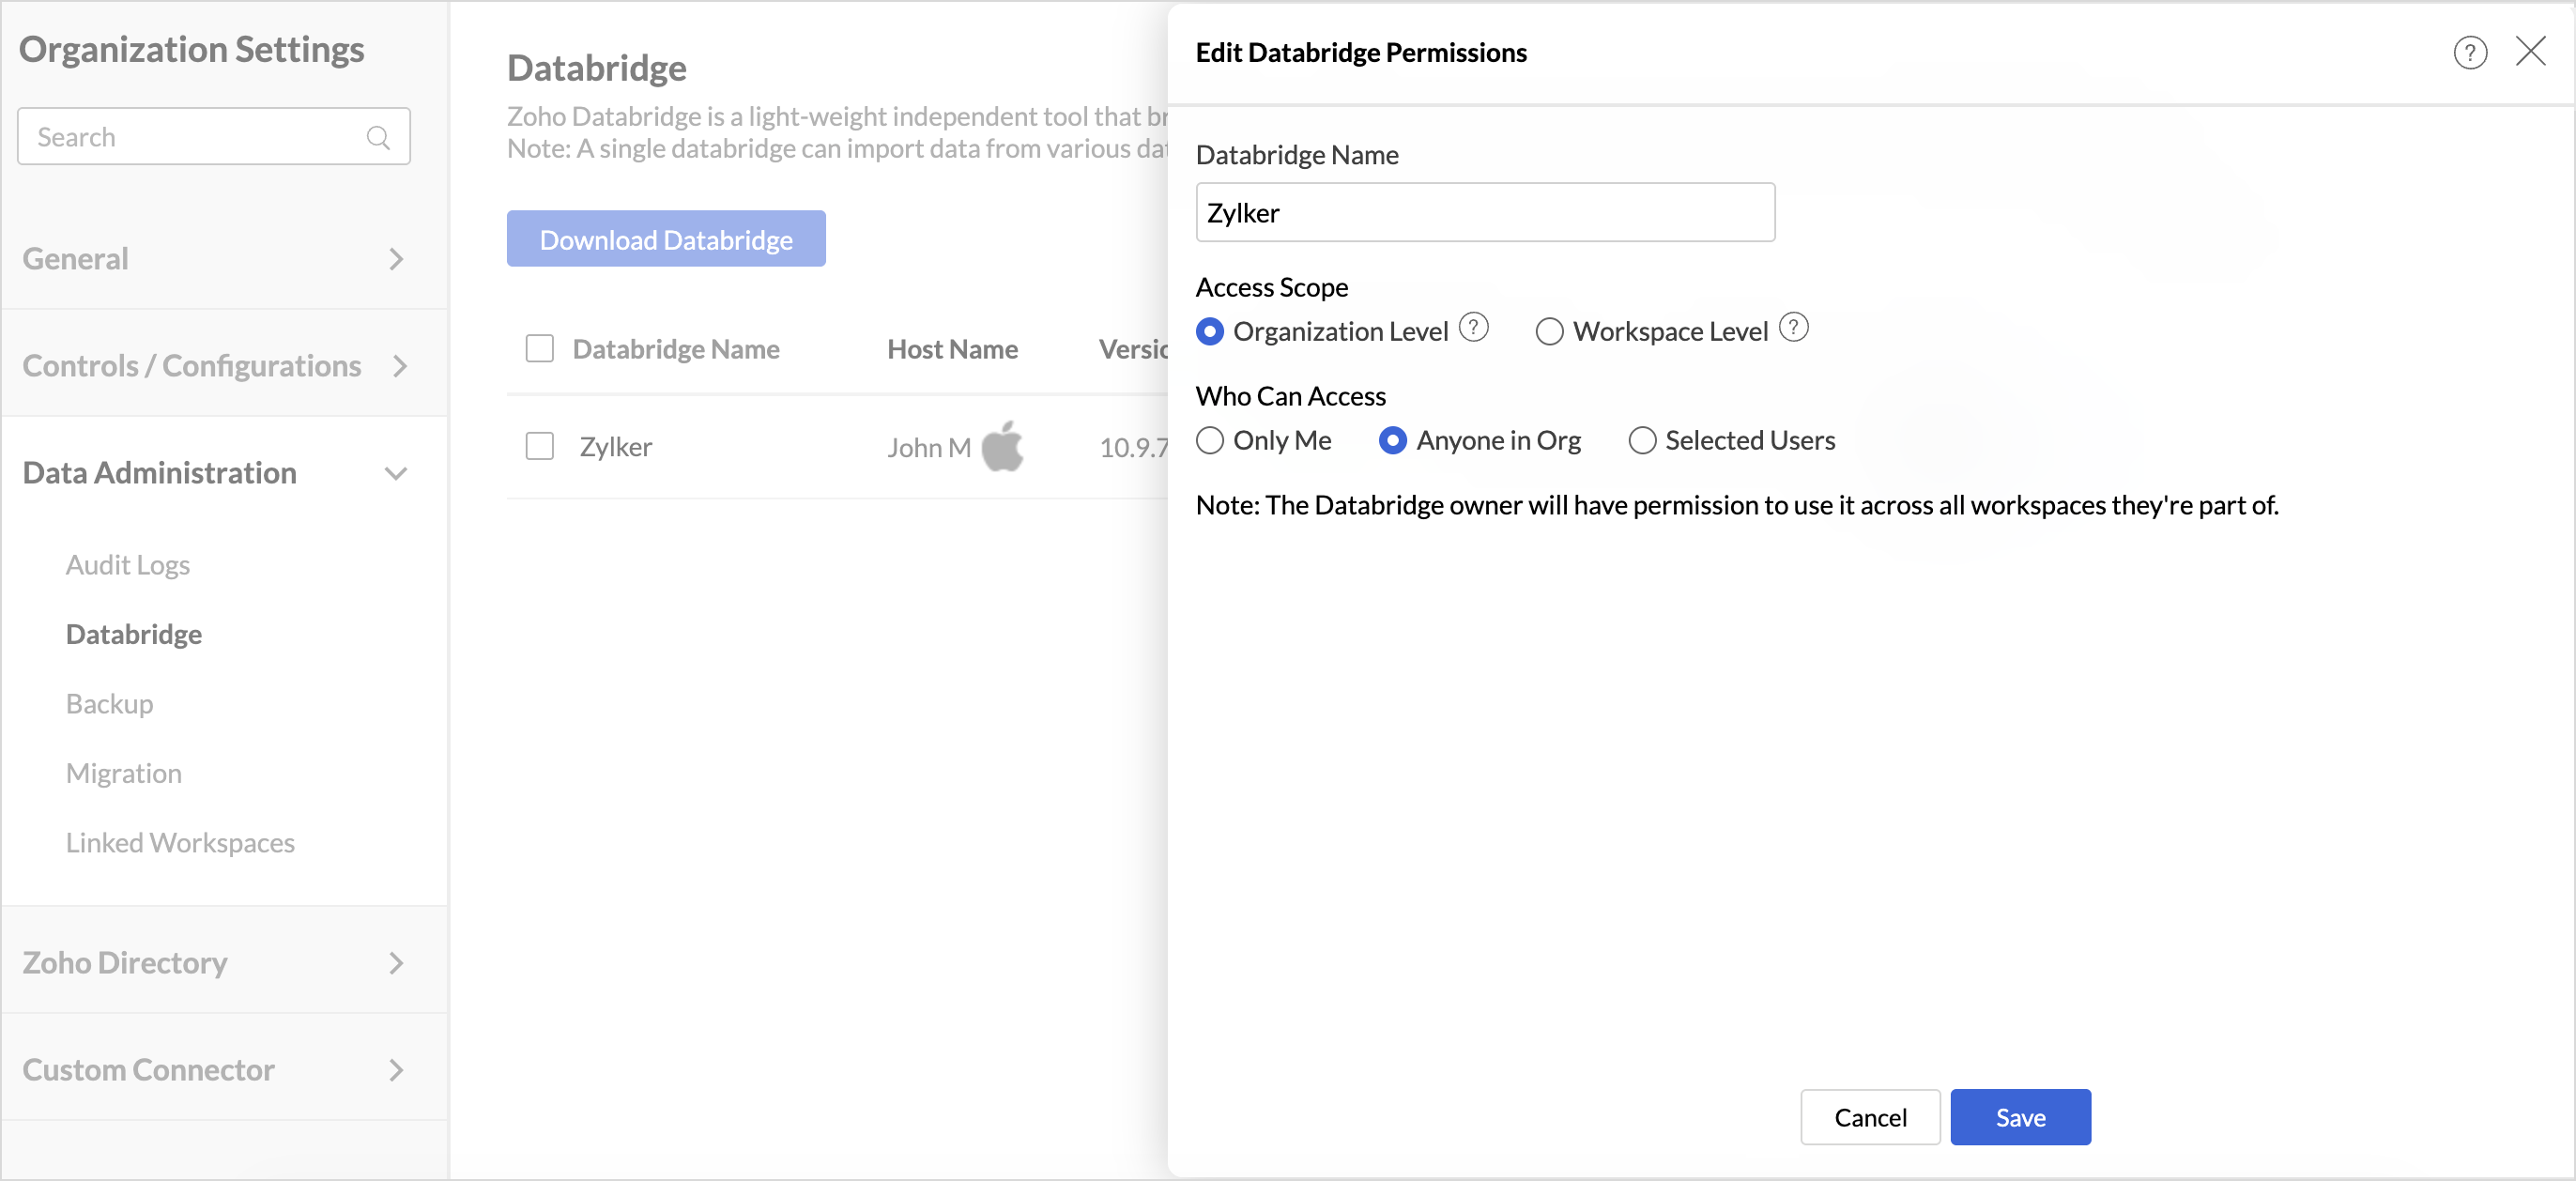
Shared Zoho Databridge
Once a user sets up a Databridge to import data from a database, the same Databridge instance can now be shared with other users in the organization - allowing them to import from the same server without needing a separate installation. Databridge owners can manage access levels and control the scope of sharing.
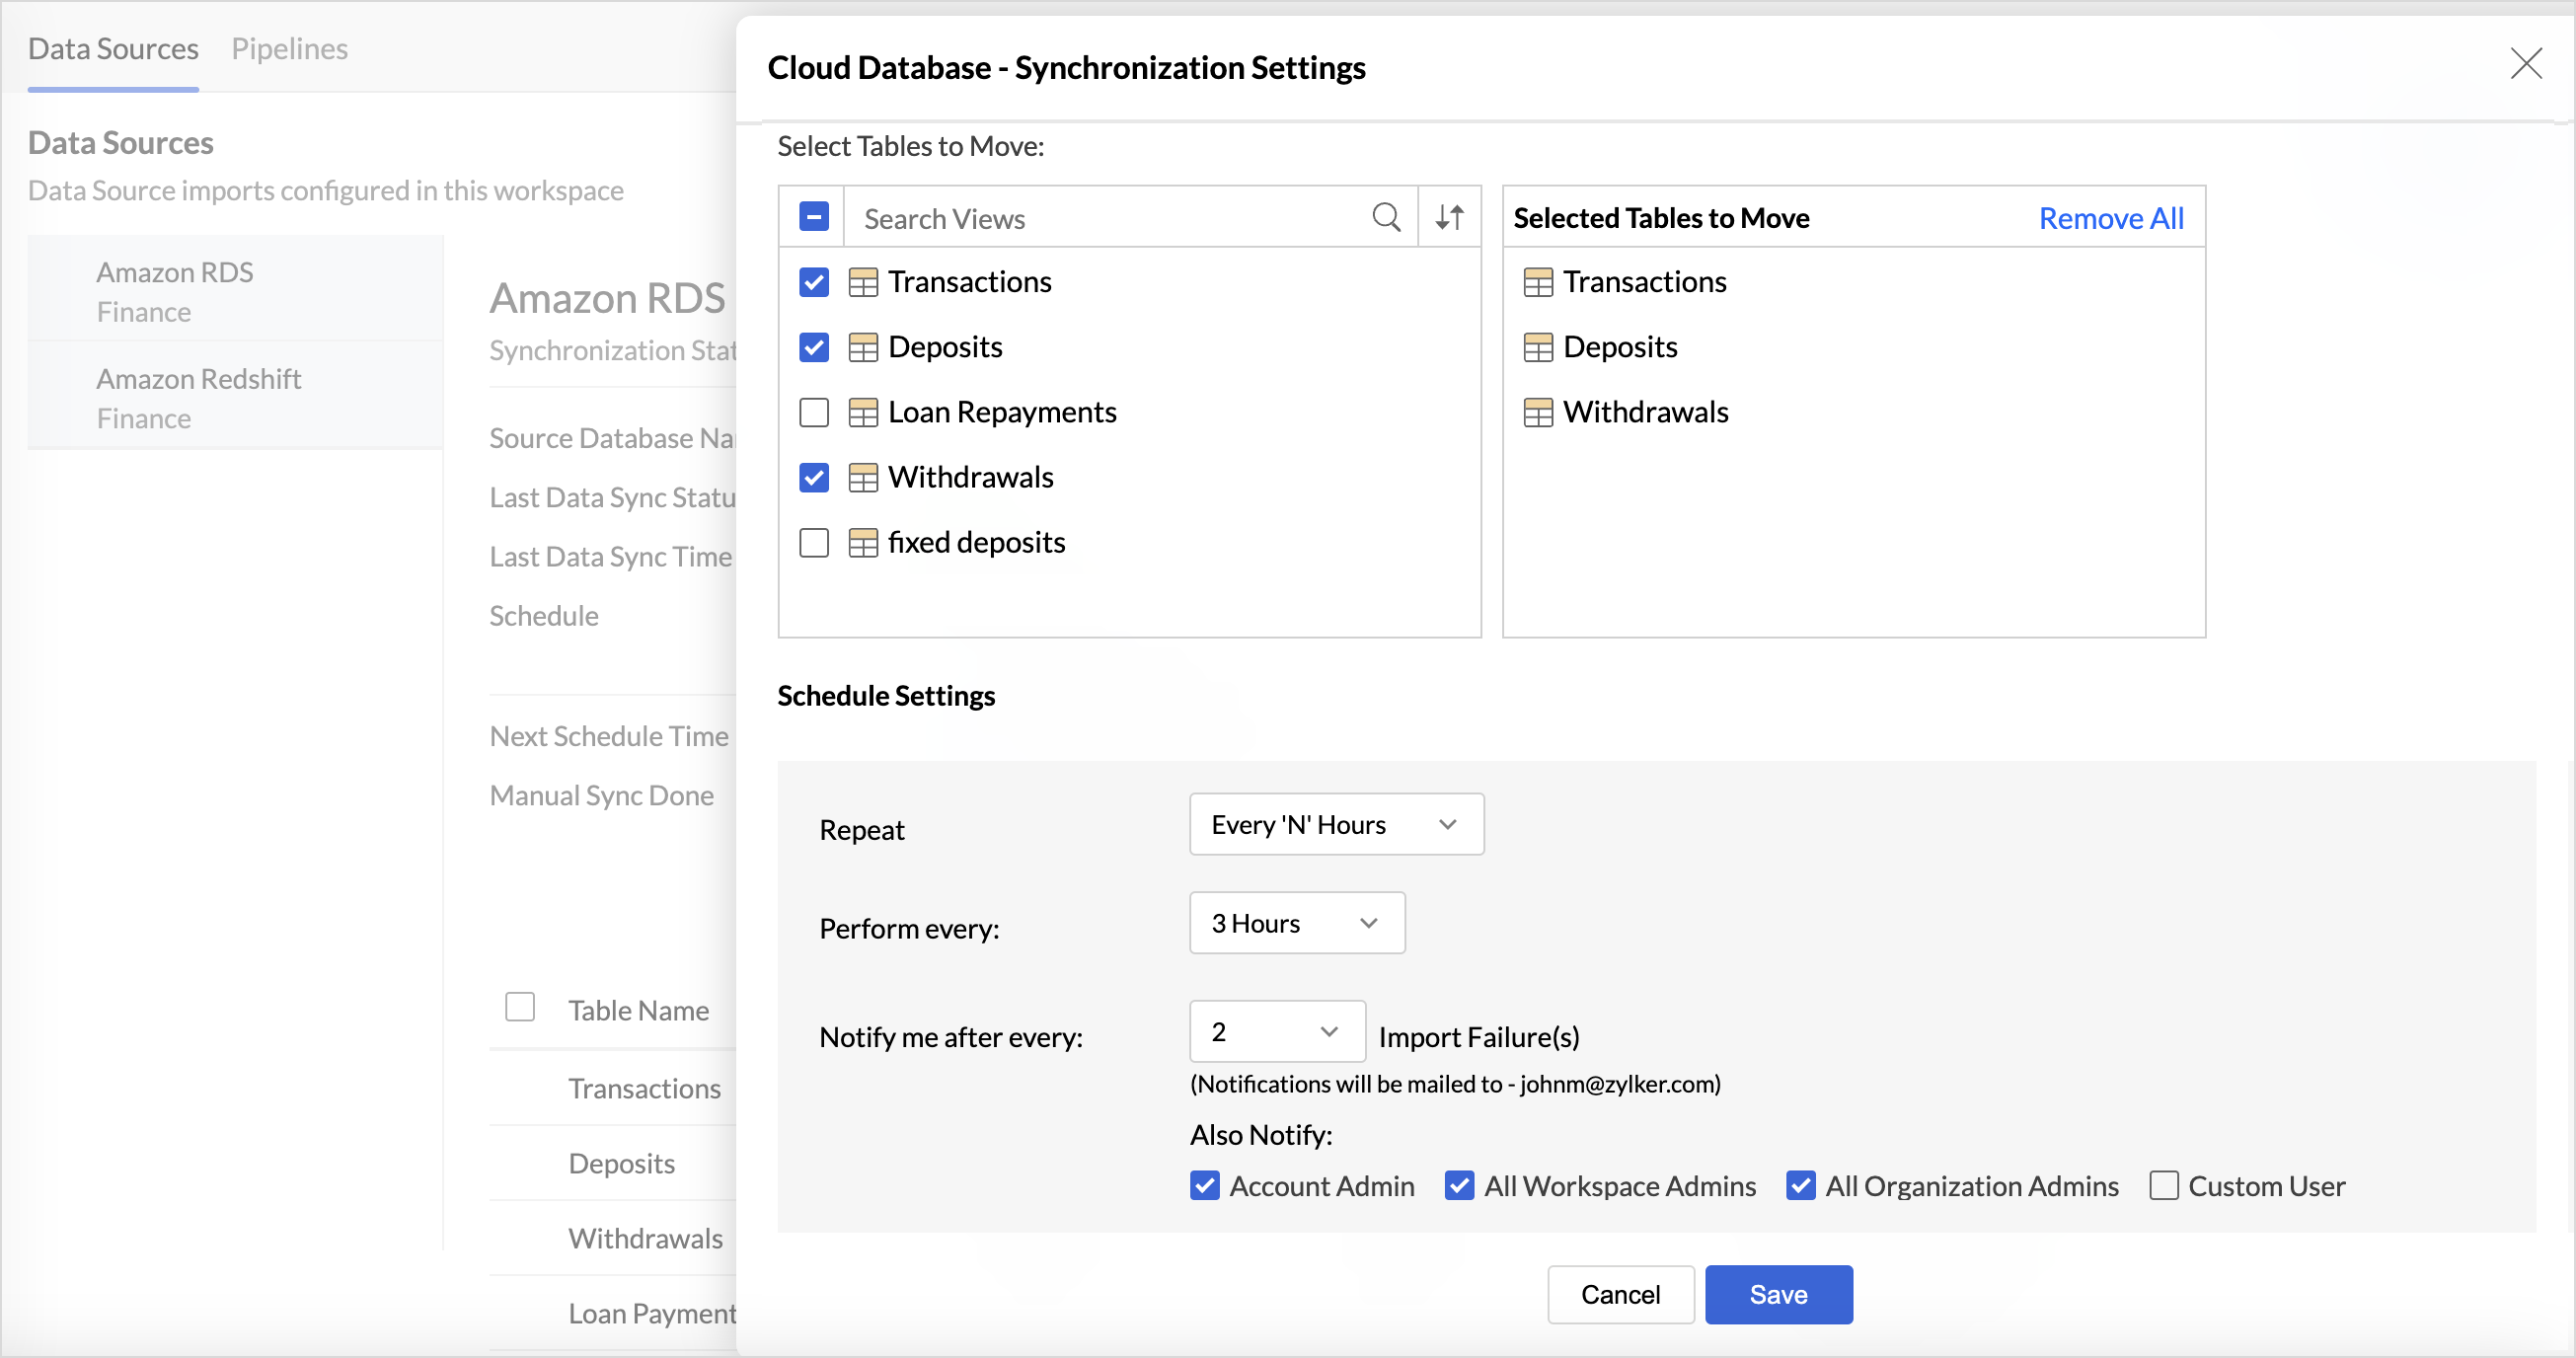
Multiple Schedules for Tables
Multiple import schedules were previously supported only for databases. We've now extended this capability to more data sources like Elasticsearch, Local Files via Databridge, Data Lakes, and OData. This gives you greater flexibility to control refresh frequency across different data sources, ensuring your reports are always working with the most relevant data.
Drill Actions
Drill Actions empower users to go beyond analysis and take operational action directly from their reports. Open records, create new entries, update information, or trigger workflows - all without leaving your analytics environment. This bridges the gap between insight and action, making your data truly actionable.
Remote MCP Server for Zoho Analytics
We've enhanced our MCP Server support with a new Remote MCP Server setup for Zoho Analytics. Your organization can now host a single, centrally managed MCP Server instance and share it with all users over HTTPS - eliminating the need for per-user Docker installs, local credential management, or manual update cycles. One setup, managed centrally, available to everyone.
Code Studio – Domain Allowed List
Security and governance in Code Studio just got stronger. You can now define a Domain Allowed List for your Python scripts - specifying which external APIs and web services are permitted to be accessed. This prevents unauthorized data transfer and gives your organization precise control over external connectivity in code-driven workflows.
Drill Through in Widgets
Drill Through is now available in dashboard widgets. Click on a data point in any widget to navigate to a detailed underlying report, enabling faster root-cause analysis and deeper exploration from your dashboard.

Map Zoom Sync in Dashboards
When your dashboard contains multiple maps, keeping them in sync is now effortless. Map Zoom Sync lets you synchronize pan and zoom movements across all maps in a dashboard simultaneously. Navigate one map, and all others follow - making geographic comparisons and multi-region analyses far more intuitive.
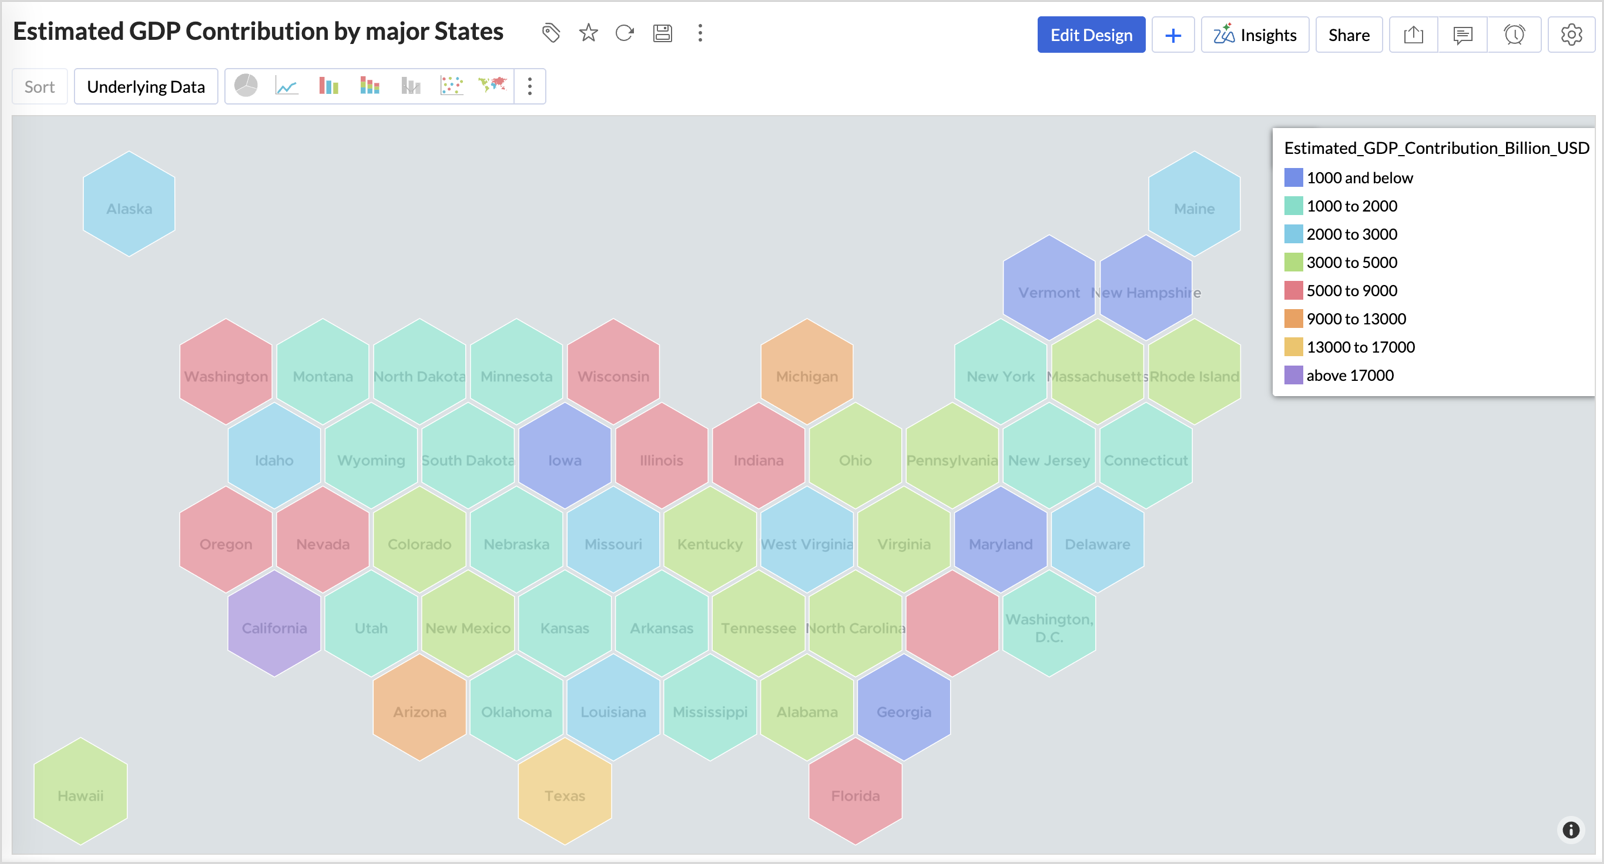
US Hex Bin Projection for Geo Maps
Geo map visualizations now support US Hex Bin projection - a clean, equal-area representation of US state-level data that eliminates the visual bias of traditional geographic maps. Each state is represented as a uniform hexagon, making it easier to compare data across states regardless of their physical size.
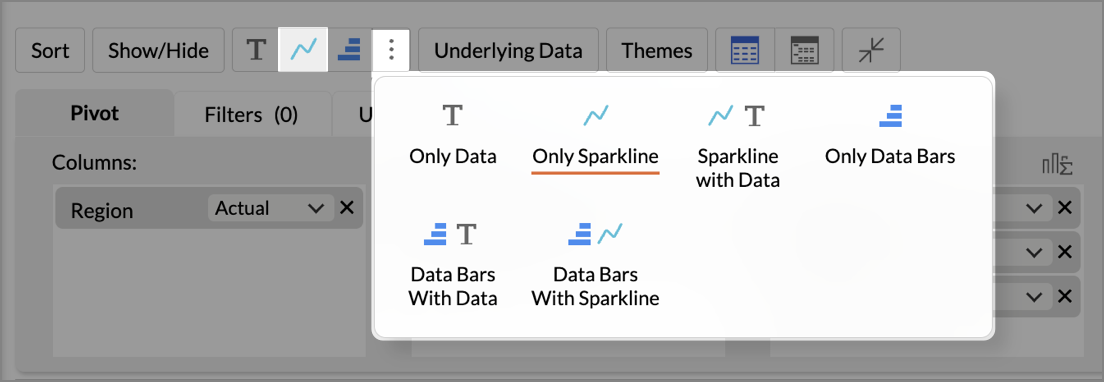
Data Bars with Sparkline in Pivot Tables
You can now display Data Bars and Sparklines together in pivot tables for richer cell-level insights. This helps you compare values and view trends in a single view, making pivot analysis faster and more intuitive - no need to toggle between separate charts and tables.
New Business App Connectors
We've expanded our integration ecosystem with four powerful new connectors:
Zoho ERP
Connect Zoho ERP with Zoho Analytics to analyze your core business processes end-to-end. From procurement and production to finance and distribution, build comprehensive dashboards that give your leadership team a real-time pulse on operational performance.
PayPal
Bring your PayPal transaction data into Zoho Analytics to analyze payment trends, revenue streams, refund patterns, and customer purchase behavior. Track key financial metrics and gain deeper visibility into your payment operations.
Zoho Spend
Integrate Zoho Spend with Zoho Analytics to gain complete visibility into your organizational spending. Analyze expense trends, policy compliance, vendor patterns, and budget utilization — all in one place - to optimize spend management and reduce costs.
Odoo Online
Connect your Odoo Online data with Zoho Analytics to gain a unified view of your business operations. Analyze sales, inventory, finance, and HR data with ready-made reports and dashboards to make faster, data-driven decisions across your entire organization.