Cluster Analysis
Customer Segmentation: Customers can be grouped based on different factors like demographics, regions, and preferences. Grouping helps businesses tailor and strategize marketing efforts that improve sales and retention.
Inventory Management: Efficient inventory management facilitates a streamlined supply chain. Clustering can identify seasonal trends related to product purchases and items that are highly in demand and help manage stocks better.
Points to Note
- A minimum of 5 data points are required for clustering.
- Cluster analysis is supported for scatter plots, bar charts, and bubble charts.
- Cluster analysis is not supported for Forecast, Trend line, and Anomaly analysis.
How to Apply Cluster Analysis
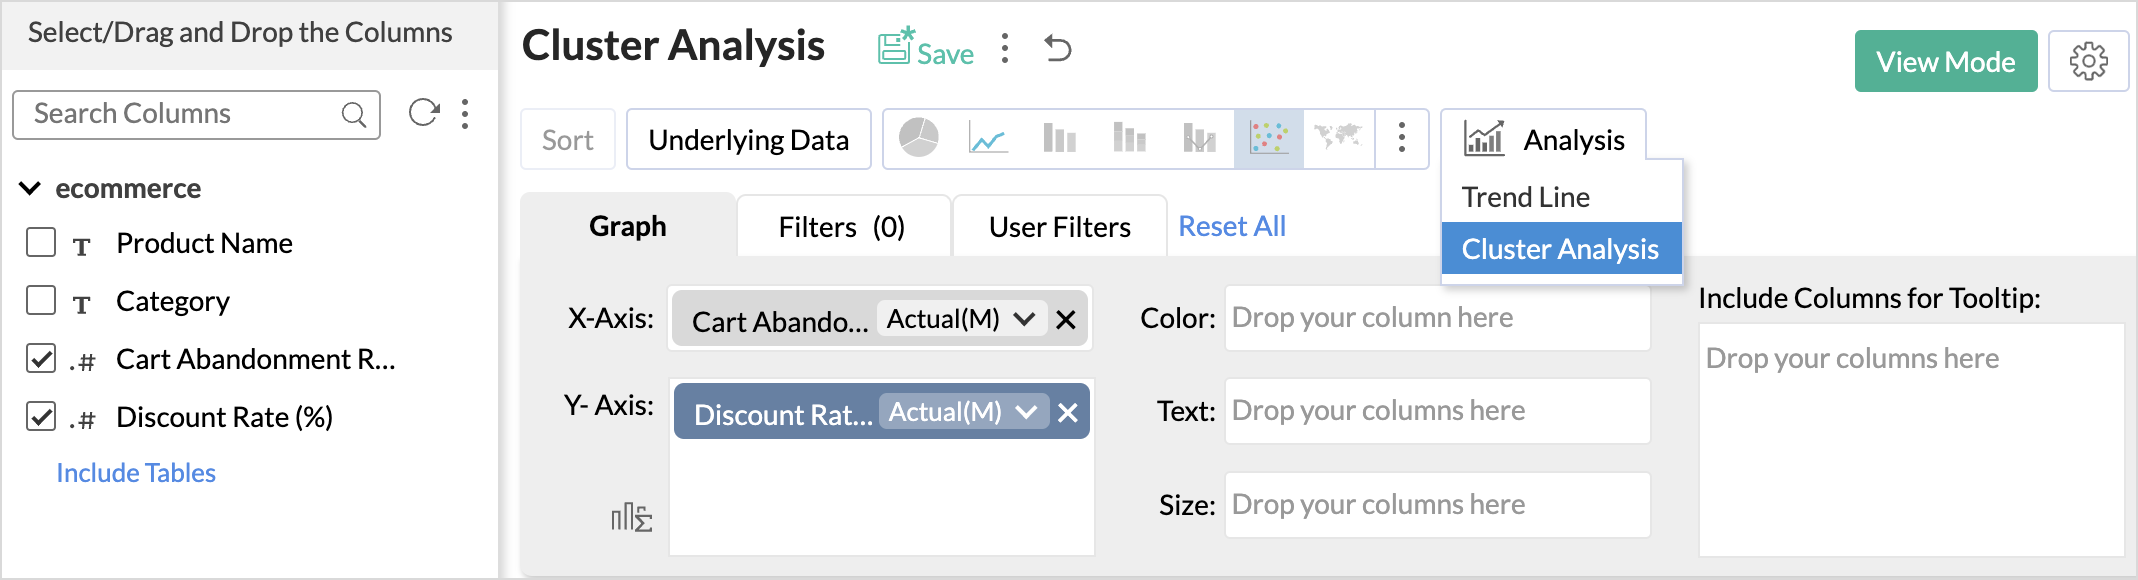
- To conduct a cluster analysis, click the Analysis icon on the tool bar and select Cluster Analysis from the drop-down menu.
- In the Cluster Analysis dialog that opens, click Add Clusters
- The algorithm model is auto selected based on the columns used in the report.
- Factors are the columns based on which the data points are grouped. The columns are listed based on the model selected; all the Numerical Columns available in the data will be listed for K-mean, Categorical columns for K-modes, and both numerical and categorical for K-prototype.
- Specify the number of clusters. A minimum of two clusters and a maximum of 30 clusters can be specified for clustering.
- Choose the Normalization method that should be used to transform the data before clustering. Normalization is the technique used to transform the data to have a common scale.
- Min-Max Scale - In this method, all the data points are rescaled between the ranges of 0 and 1.
- Z-Score - Z-Score represents the number of standard deviations a data point is from the mean of the dataset. This transformation is designed to center the data around a mean of 0 and standardize it so that the standard deviation is 1 for the entire dataset. In this method, all the data points are rescaled between the ranges of -1 and 1.
- For the K- prototype model, specify the Weightage to be given from numerical and categorical factors. The weightage values range from 0.2 to 2. By default, Zoho Analytics gives equal weightage (1.00) to both numerical and categorical factors. Weightage value closer to 0.2 indicates, numerical columns will have more weightage and value closer to 2 indicates,categorical columns will have more weightage.
- Click Apply.
Viewing Cluster Information
This section provides the summary and statistical information that help evaluate the quality of the clusters and how well the data points are grouped. Clusters info option will be enabled once the clustering is applied.
Summary
This section provides the following details:
- This section provides the following details, such as the algorithm used for clustering, Number of Data points, and Number of clusters in to which the data points are clustered.
- The Stop Criteria field gives the reason based on which the clustering process was terminated.
- The Distance formula that was used for clustering.
- Euclidean distance is the method used for K-means algorithm.
- Binary Dissimilarity is the method used for K-modes algorithm.
- The Factors(Columns) and the Normalization method used for clustering.
Performance/Quality Indicators
- CH Index - The Calinski-Harabasz index (CHI) is a metric used to evaluate the quality of a cluster. The CHI calculates the ratio of between-cluster variance to within-cluster variance. A higher CHI value denotes that the clusters are well grouped.
- DB Index - The Davies-Bouldin index (DBI) is another metric to assess the quality of clustering. The DBI is calculated by considering the ratio of the average similarity between each cluster and its most similar cluster, to the average dissimilarity between the clusters.
- Purity - In K-mode clustering, purity is a measure used to evaluate the quality of the clustering results. It assesses how well-defined and internally consistent the clusters are by comparing the dominant class labels within each cluster to the actual class labels in the dataset. The purity score is given in percentage.
Note
- The CH Index and DB Index is calculated for the K-means and K-prototype models
- The Purity indicator is calculated for K-modes and K-prototype clustering models.
Centroid and Cluster Information
This section provides the details specific to each cluster, such as the number of data points in each cluster and the average (centroid) or the mode of the data points for each factor.
Analysis of Variance (ANOVA)
Analysis of variance is calculated only for the K-means algorithm. ANOVA is used to evaluate whether the centroids (or means) of the clusters are significantly different from each other in terms of the values of the factors used for clustering. It is also a statistical significance test that is used to check whether the null hypothesis can be rejected or not during hypothesis testing.
Within the Sum of Squares - It calculates how much the individual data points within each group differ from the mean of that group. This can also be called as Mean Square between the Clusters (MSB).
Between the Sum of Squares - It calculates how much the mean values of different groups differ from the overall mean value. This can also be called as Mean Square within the Clusters (MSW).
F- Statistic Value
The F-Statistic calculates the ratio of the Mean Square Between (MSB) the clusters to the Mean Square Within (MSW) the clusters. If the F-Statistic is greater than the critical value, we can conclude that the data points are well clustered.
P - Value
It helps to decide whether the differences between groups are likely to have occurred by chance or if they are statistically significant.
| Factors | F-Statistic | Between the Sum of Squares | Degrees of Freedom (between clusters) | Within the Sum of Squares | Degrees of Freedom (within clusters) |
| Columns used for clustering | MSB/MSW MSB - Mean Square between clusters MSW- Mean Square within clusters. | Calculates the difference between the means across different clusters A large value indicates that the data points are well clustered and there is no overlapping. | k-1 where, k - number of clusters The between-clusters degrees of freedom is calculated based on the number of clusters (groups) being compared. | Calculates the difference between the means within each cluster. | N-k where,
The within-clusters degrees of freedom is calculated based on the number of observations within each cluster and the number of clusters. |
Algorithms Used for Cluster Analysis
The methods used for clustering depend mainly on the data type of columns based on which the data points are grouped.
K-means
K-means is a ML algorithm for partitioning a dataset into a predefined k number of clusters. Each data point is assigned to a cluster based on the centroid. The goal of this algorithm is to reduce the sum of the distance between the points and corresponding clusters. This method is best suited for grouping data points based on numerical factors. Refer to the section to learn about the working of K- means.
K-modes
K-modes aims to partition a dataset into K clusters, where each cluster contains similar data points. The centroid of each cluster is represented by the most frequent value (mode) for each categorical attribute within the cluster. The algorithm aims to minimize the total dissimilarity between data points and their respective centroids.
K-prototype
K-prototype is used to partition data that contain both numerical and categorical attributes. It calculates the centroid of each clusters using the combination of euclidean distance for numerical features and a matching dissimilarity measure for categorical features. For example, Segmenting customers based on the purchase pattern and age.