Forecasting
Predict future trends and analyze how various factors influence the data trends with advanced forecast models. Forecasting in Zoho Analytics is based on powerful forecasting algorithms that analyze your past data deeply, and come up with the best forecast for the future.

Points to Note
- A minimum of seven data points are required for forecasting.
- Forecast can be applied over Line, Bar chart and its variations, Scatter, Area, combo charts (without bubble), and Pivot table.
- Forecasting is supported for trend lines, what if analysis, and anomaly detection.
- Forecasting can be applied for more than one metric column in the Y-axis.
Data Requirements
A Date dimension in the X-axis and at least one metric column in the Y-axis are required to apply forecast.
How to Apply Forecast in Zoho Analytics
- Drag and drop the required columns into the report builder.
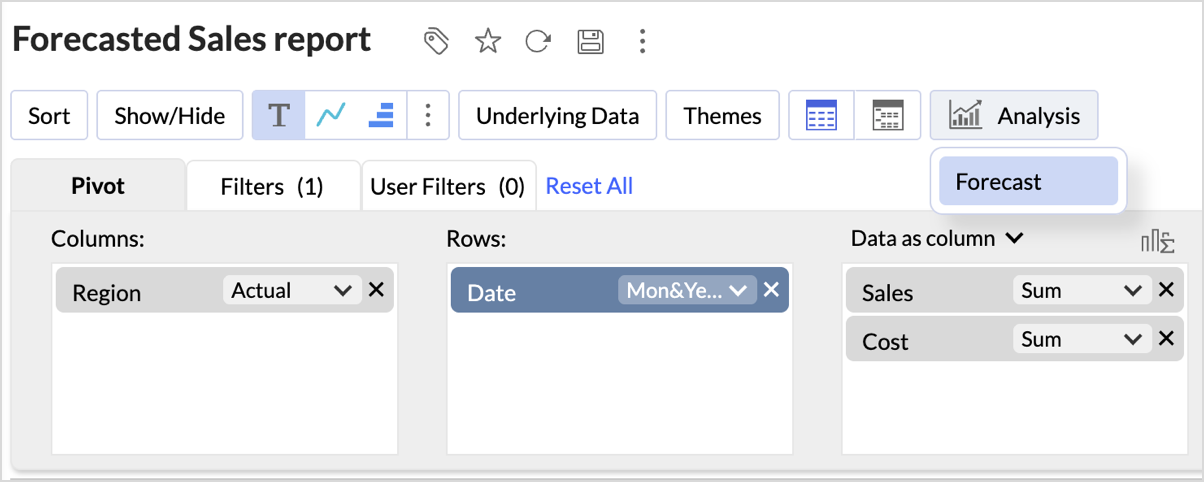
- Click the Analysis icon in the tool bar and select Forecast from the drop-down menu.
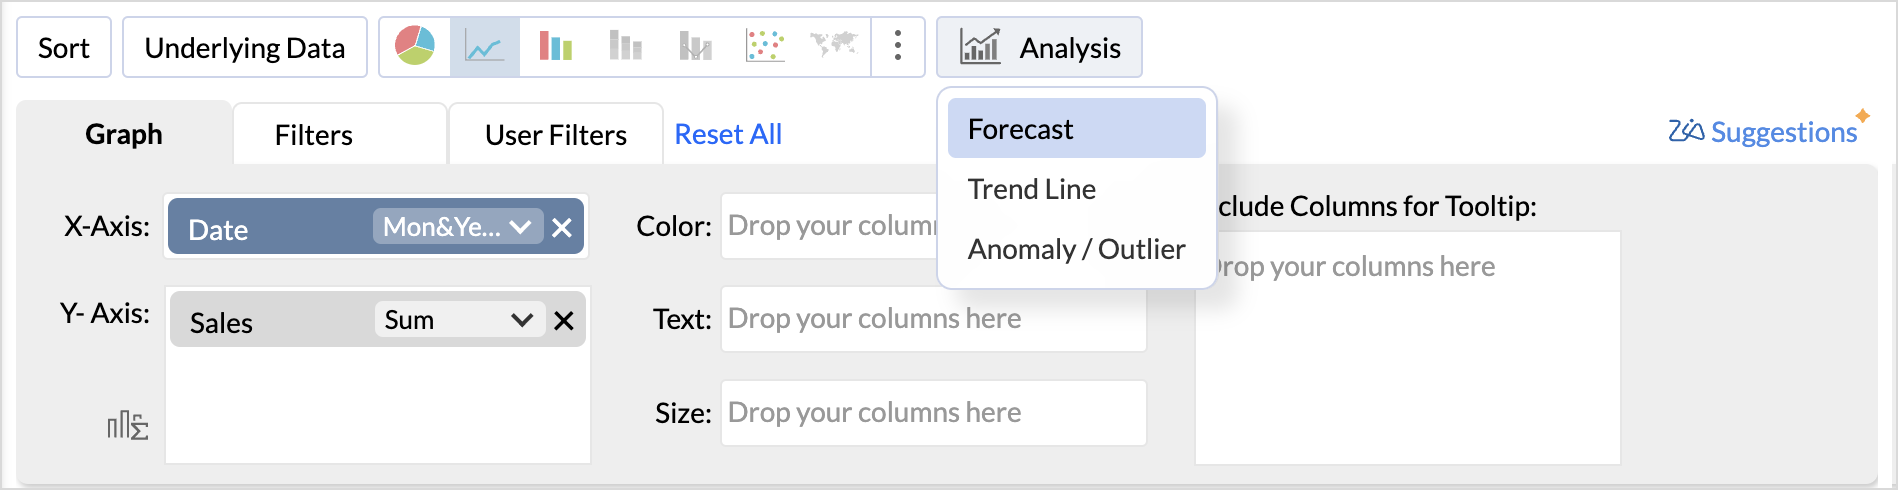
(or)
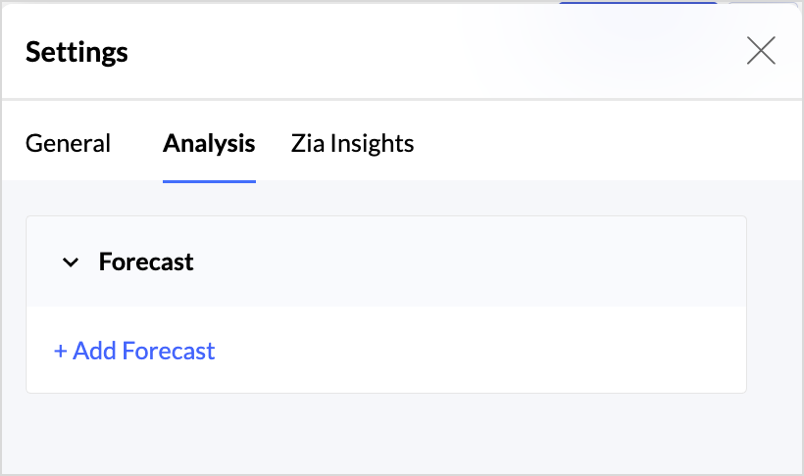
Click the Settings icon on the top right and access the Analysis tab.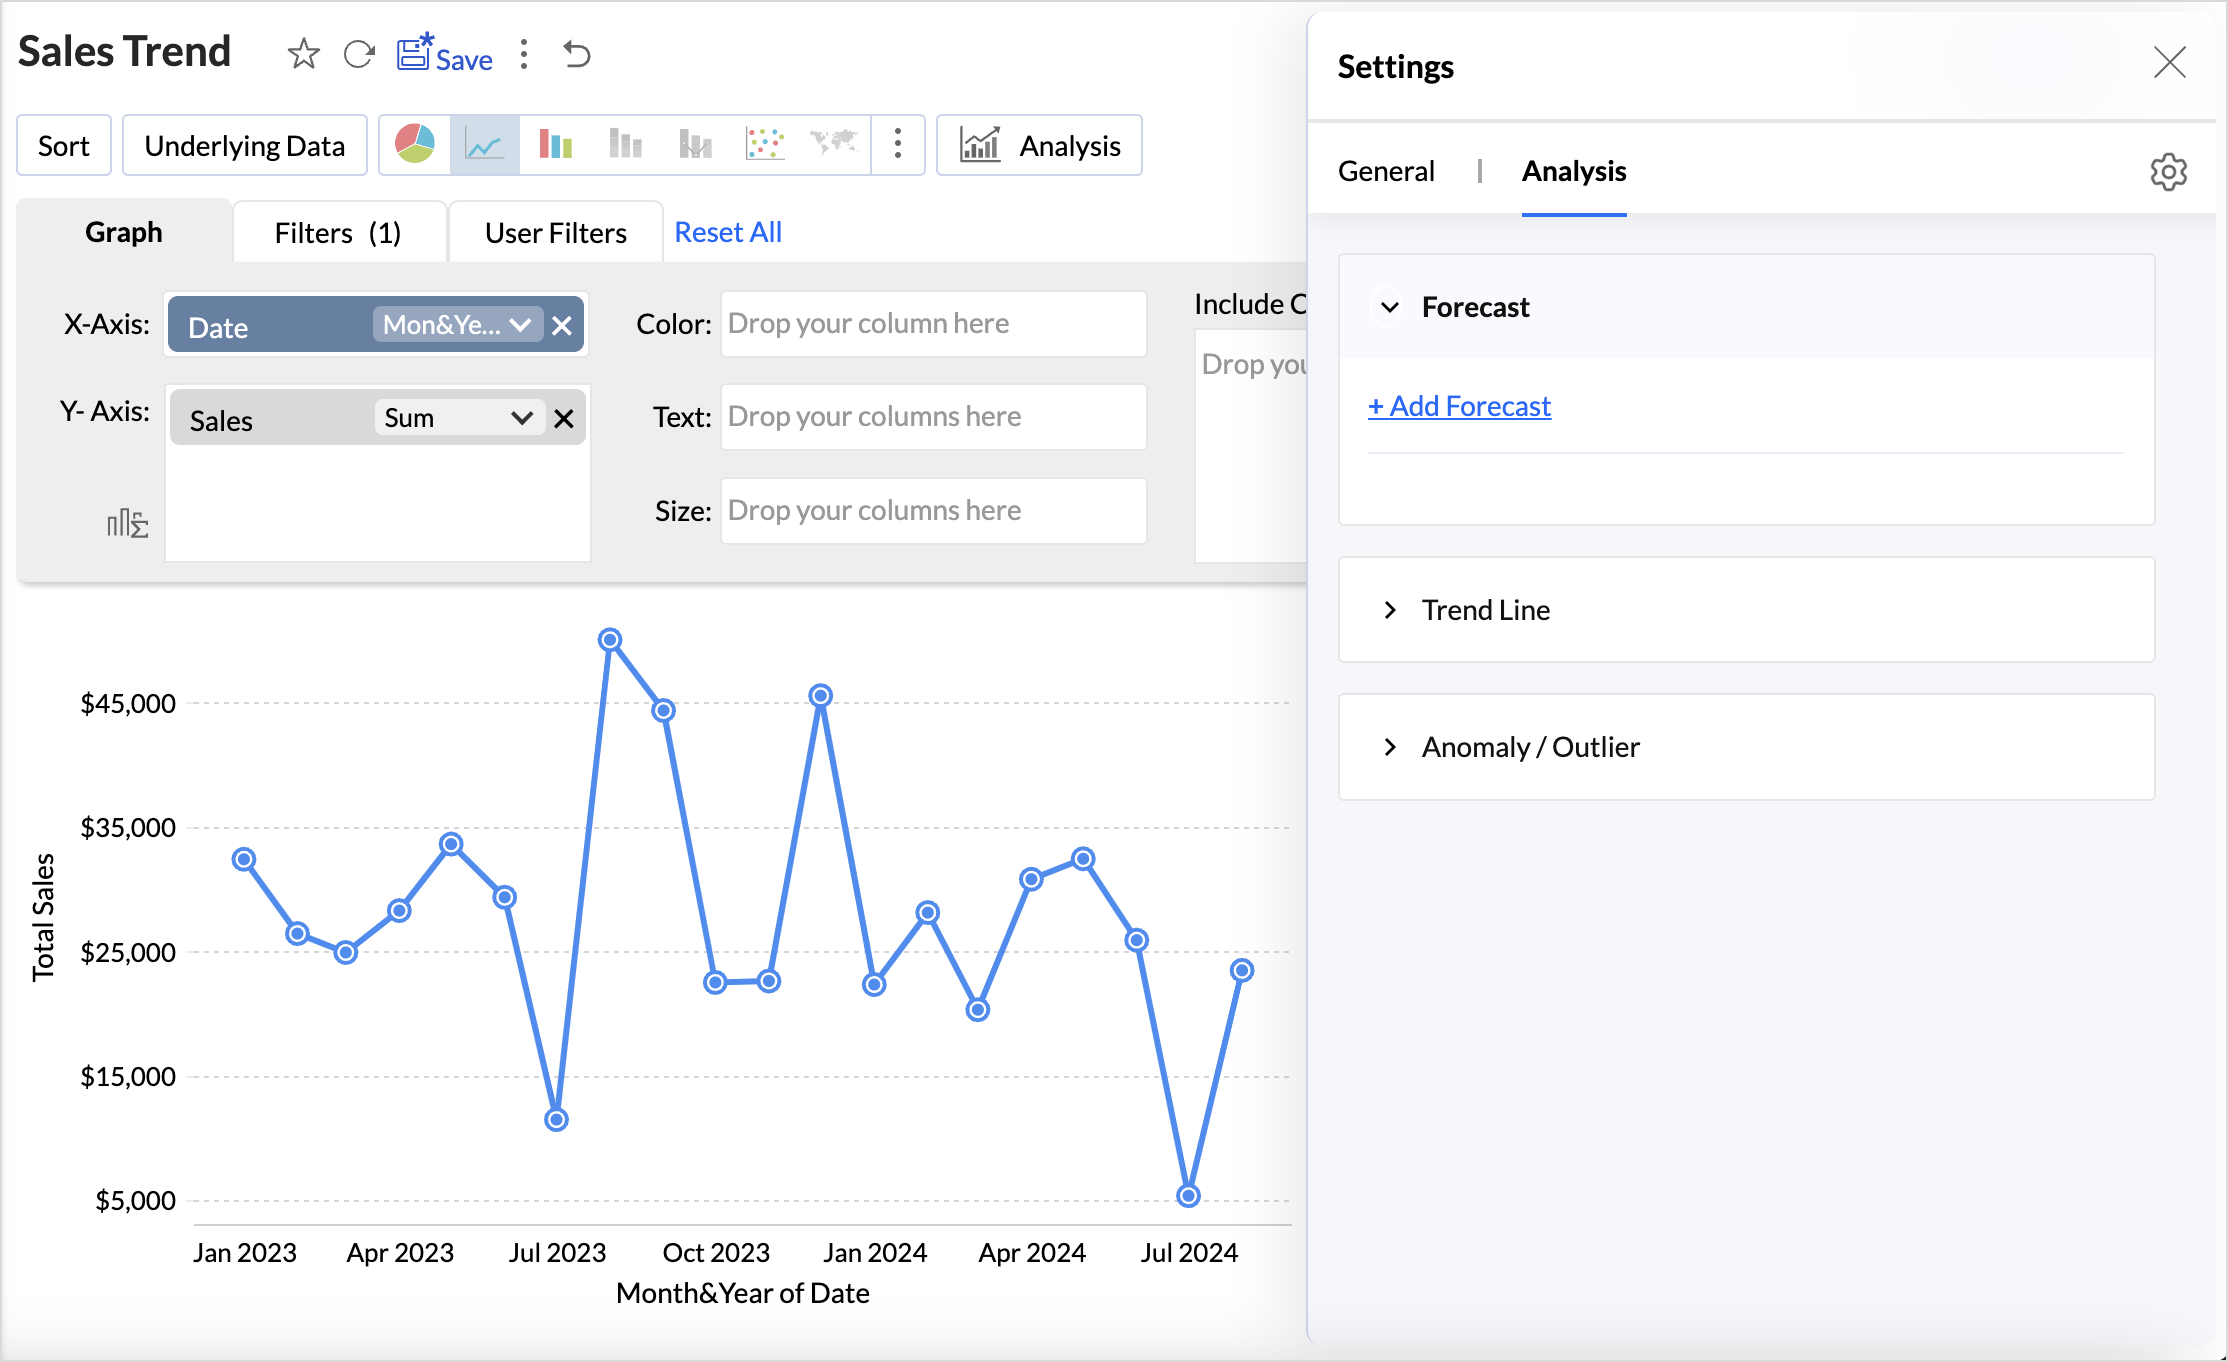
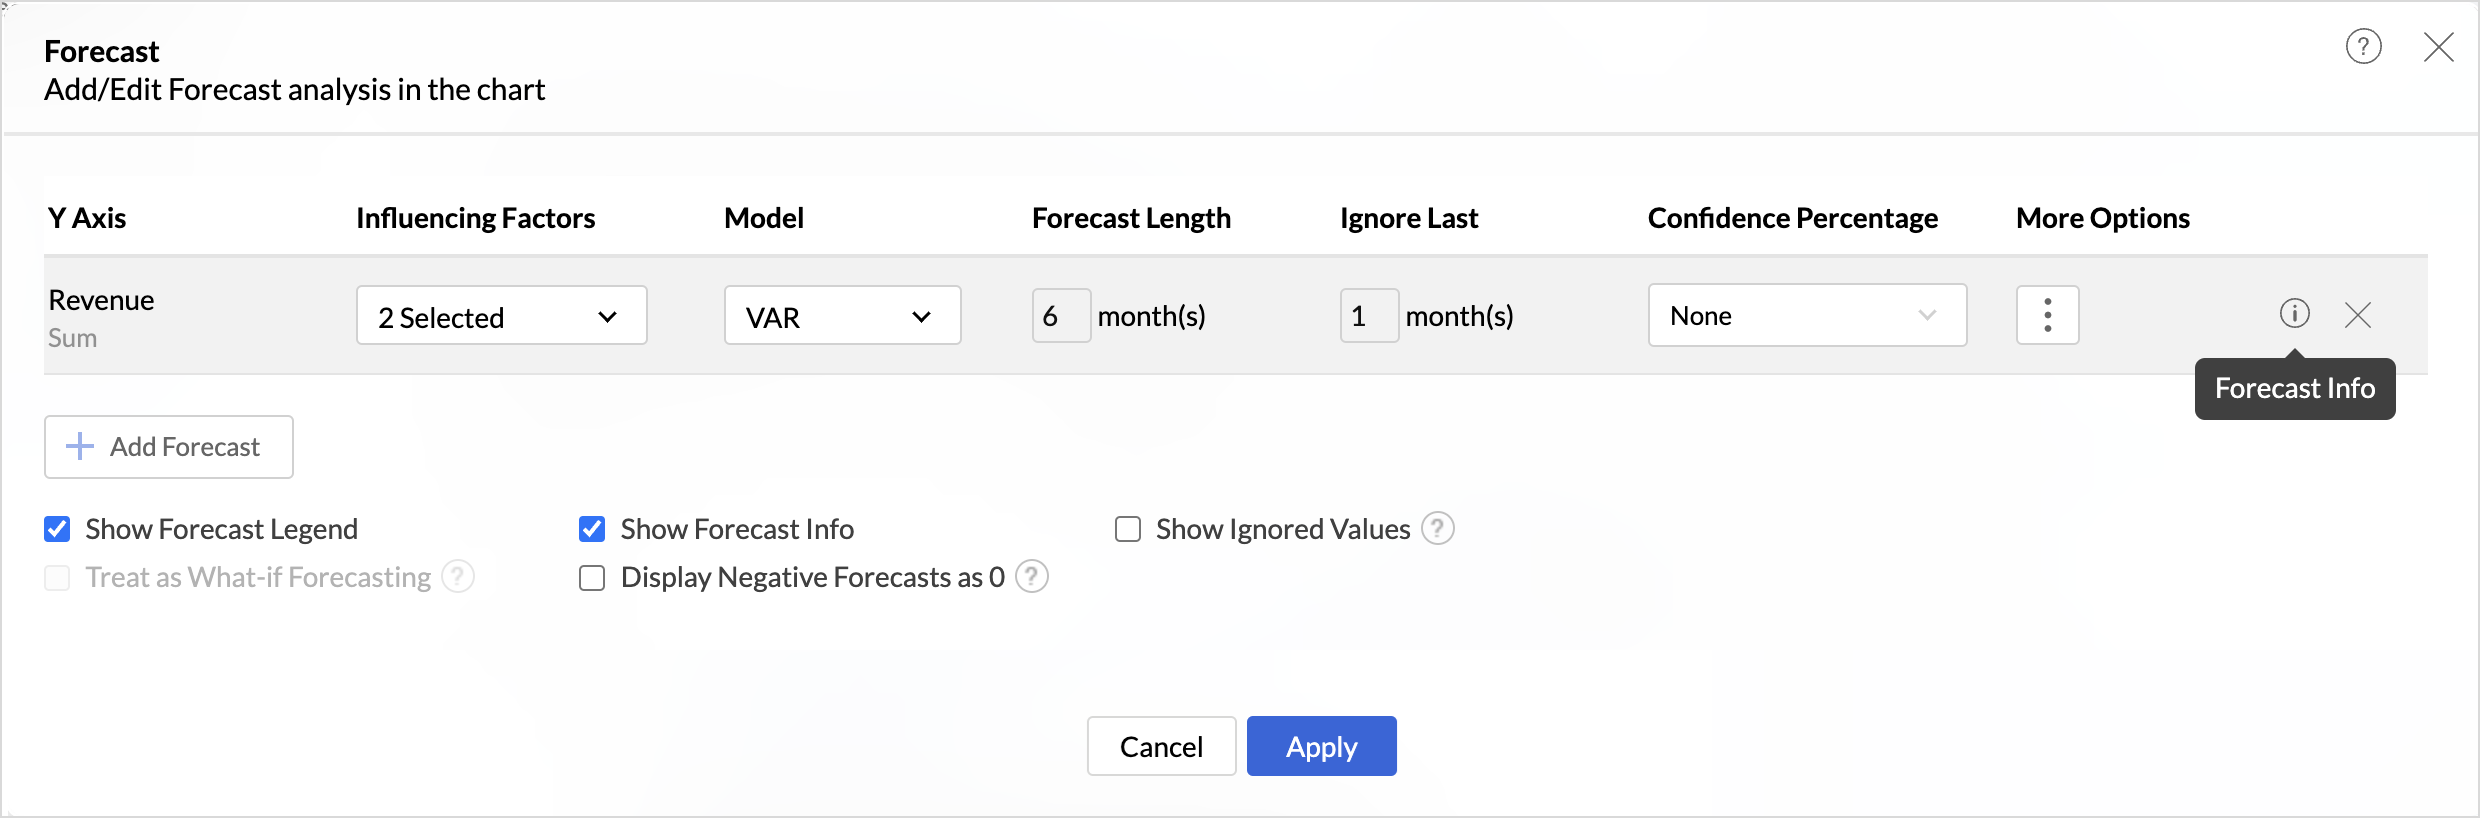
- Click Add Forecast. Select the column for which you intend to forecast values.
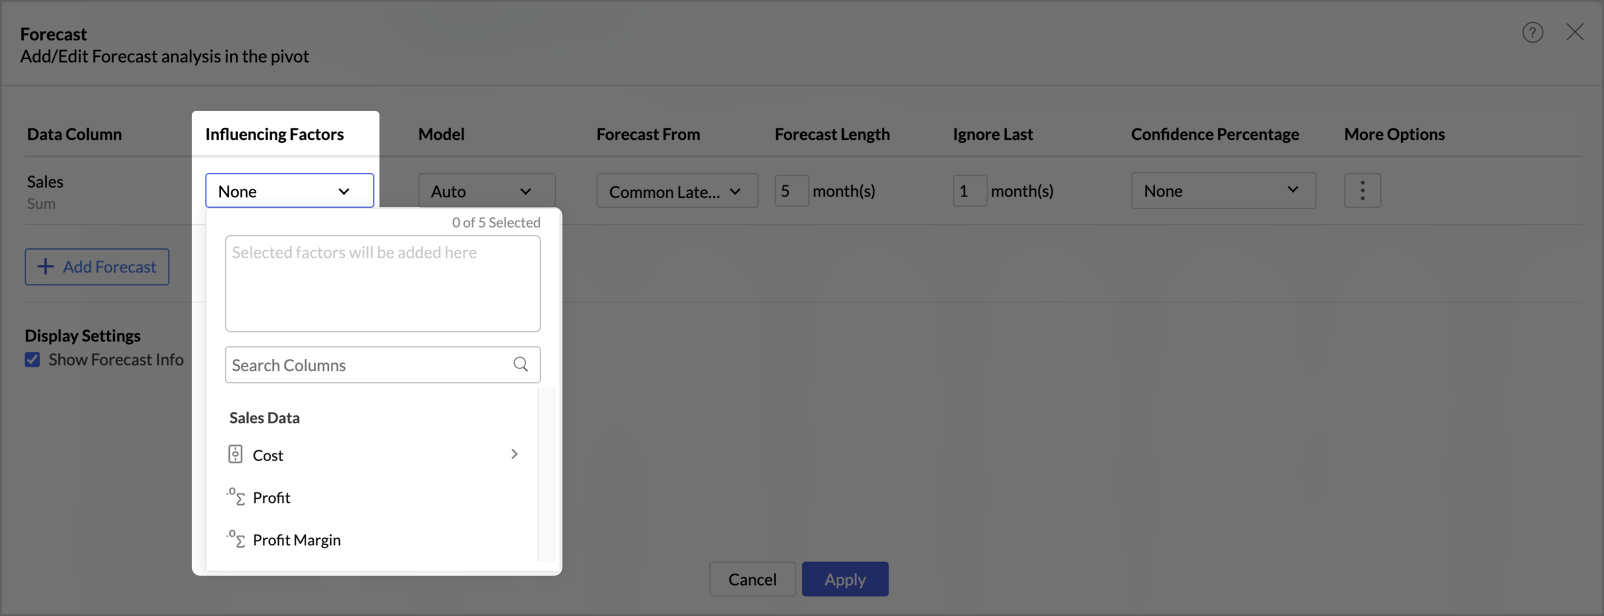
- Influencing Factors are the additional metrics that affect the target metric (y-axis) that is to be forecasted. This helps understand how different factors influence the outcome of the prediction.
Click the drop-down menu to choose the Influencing Factors. A maximum of Five influencing factors can be chosen for forecasting.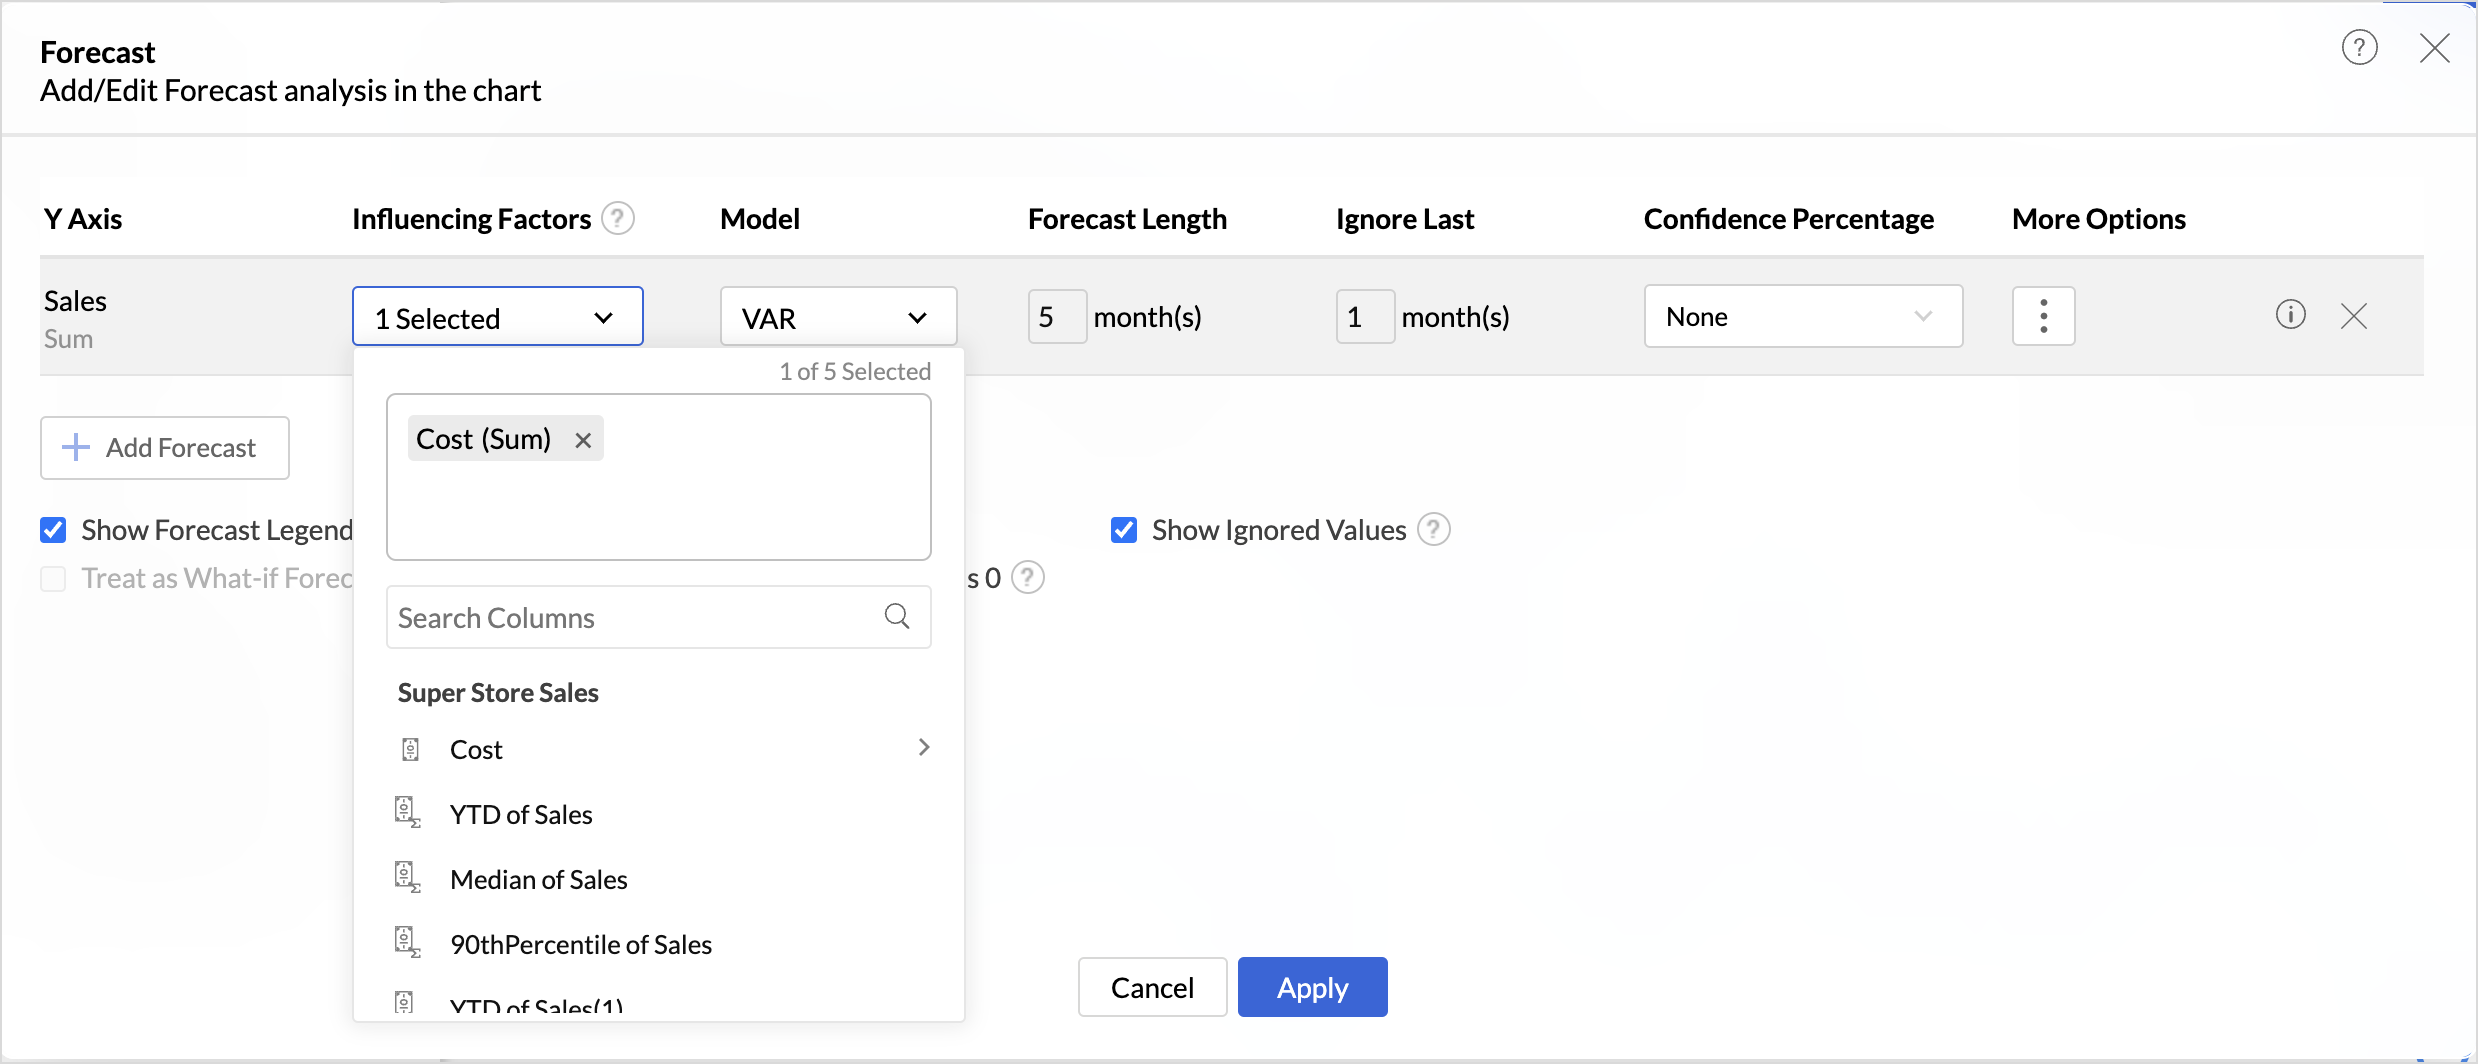
- The best forecast Model is auto selected based on the characteristics of the data. Vector Auto Regression model is applied by default when there are influencing factors chosen for forecast.
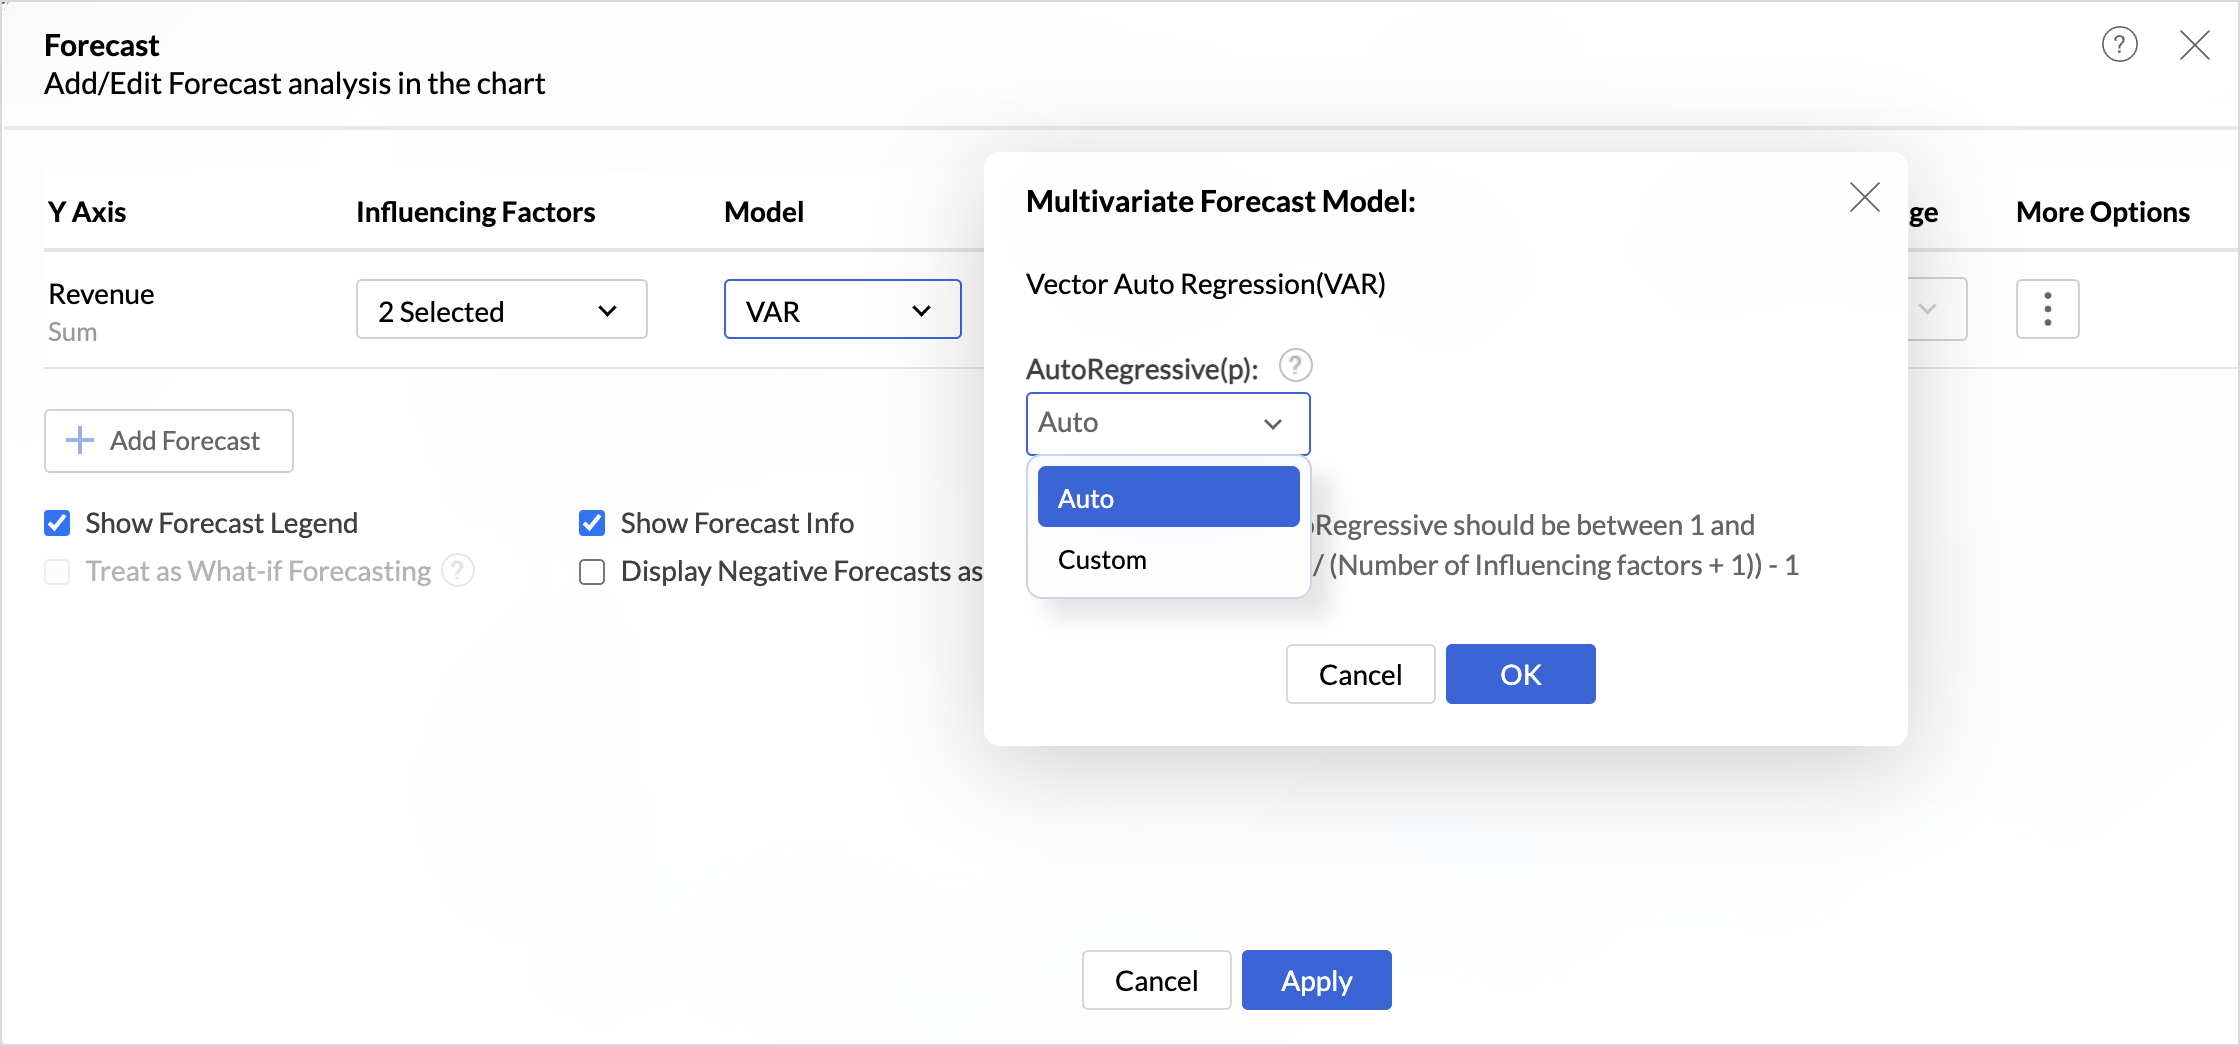
- You can also choose the model that should be used and specify the parameters for analysis. Refer to the Forecasting models article to learn more.
- Specify the number of data points to forecast in the Forecast Length field.
- Specify the number of recent data points to exclude for forecast in the Ignore Last field. For example, if you choose to ignore the last 1 month, the forecast will be based on the data points before that, and the forecast values will begin from the ignored month. This helps exclude incomplete data in cases where the data might be incomplete for the last or current period and to cross-verify if the chosen model predicts the correct value.
- The Confidence Percentage refers to the level of certainty that the forecasted values will likely fall within a specified range.
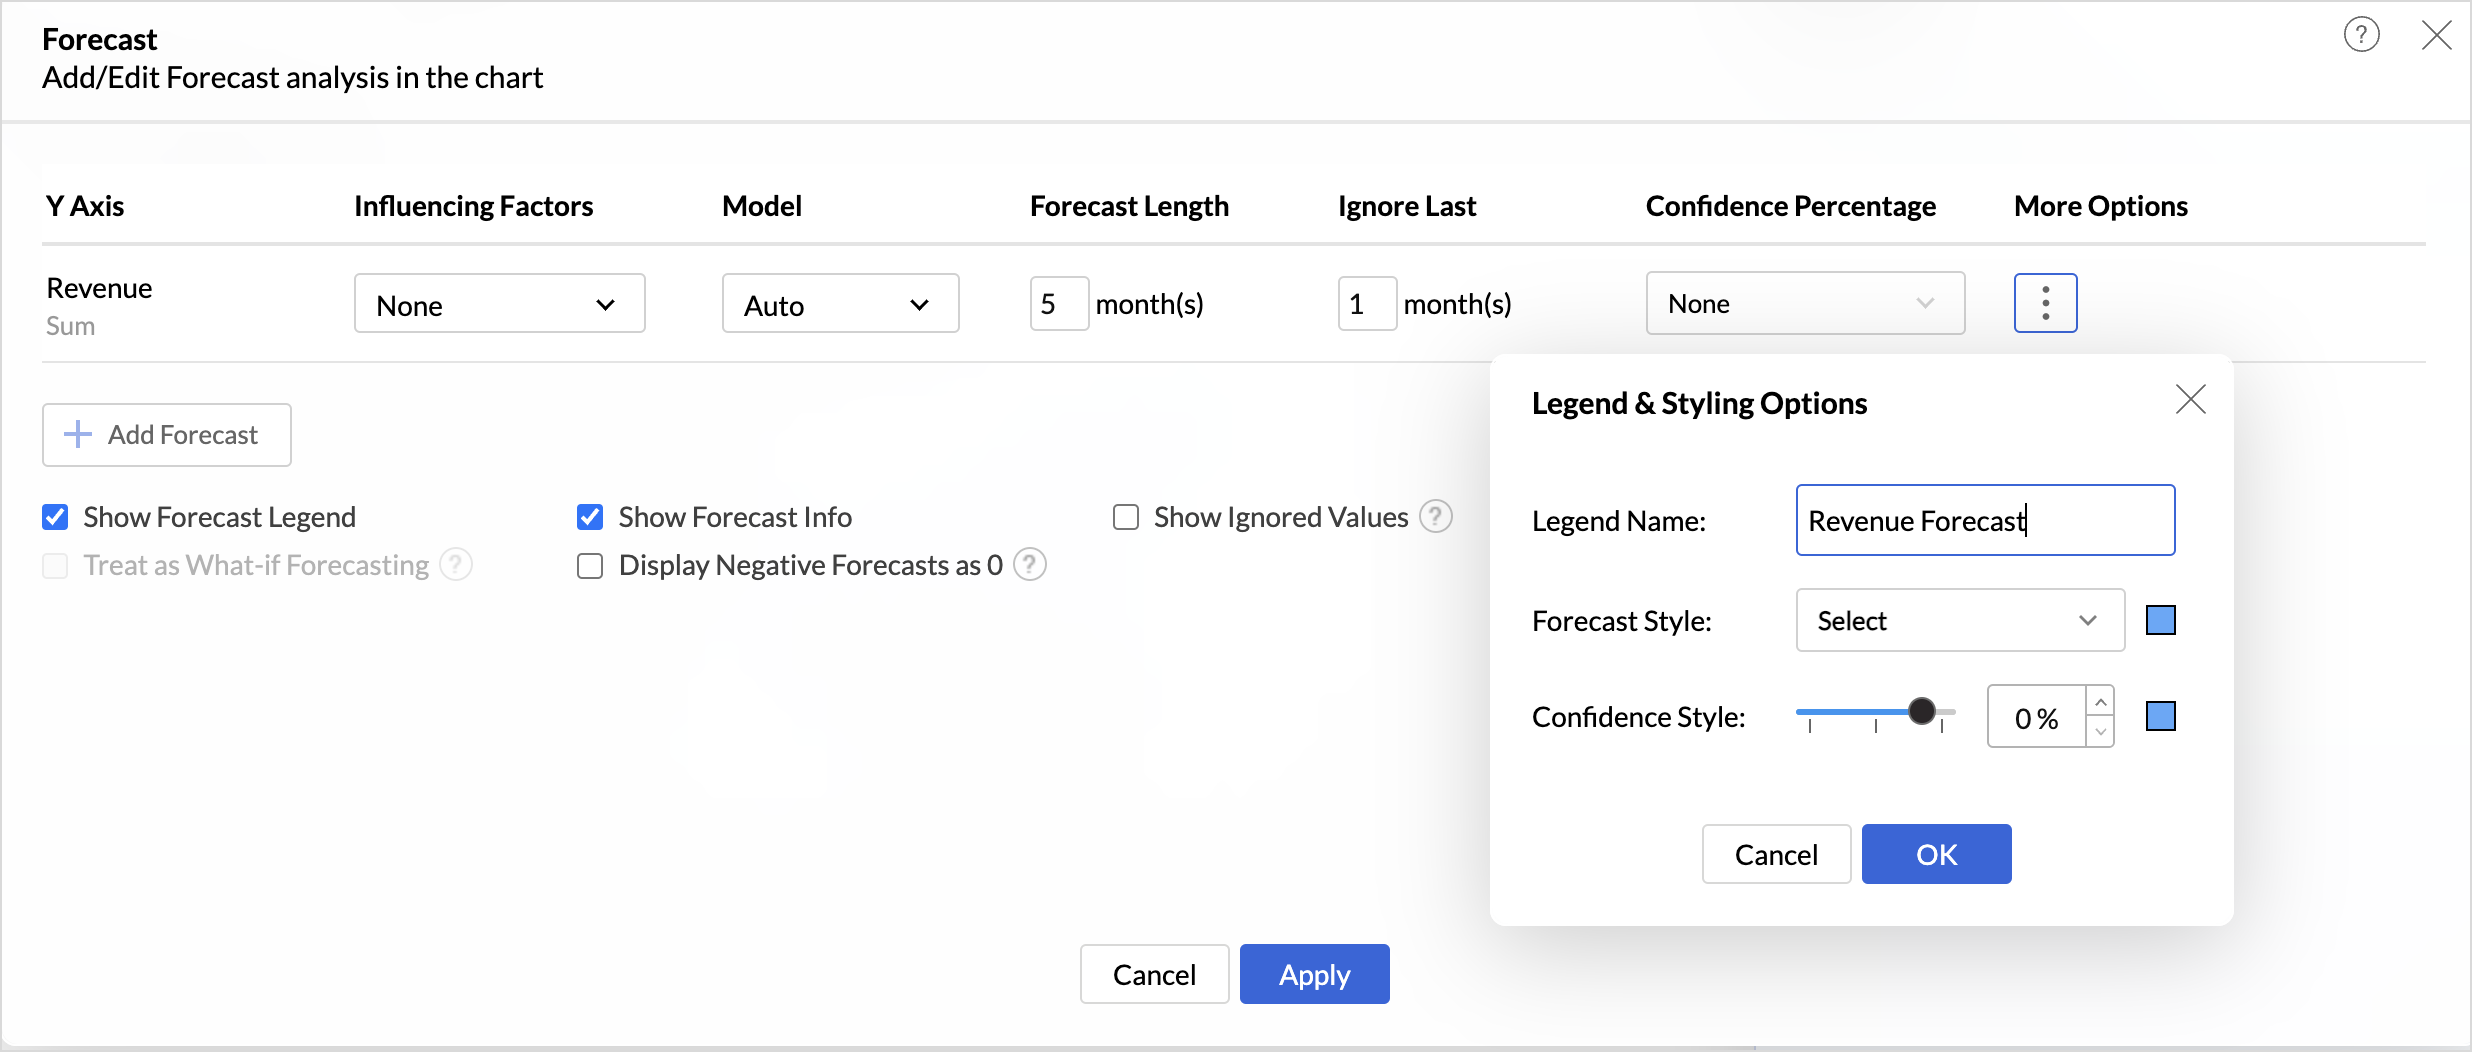
- Click the More Options icon to customize the Legend & Styling options.
- Give a suitable Legend Name for easy identification.
- Choose the Forecast Style option.
- Zoho Analytics allows you to apply forecast for more than one metric column (multiple y-axes).
- Customize the display options as needed.
- The Show Forecast Legend displays a legend to differentiate between the forecasted value and the actual values.
- The Show Forecast info option displays detailed information about the models used for forecasting and performance metrics. Enabled by default, users can access the forecast information in both view and edit modes, regardless of their role.
- Enabling the Show Ignored Values option displays the values that were not considered for forecasting.
- Enabling Display Negative Forecasts as 0 replaces all the negative forecasted values with 0.
- Click Apply.


Applying What-if Analysis over Forecast
Applying what-if analysis over forecasting can help simulate different scenarios to understand how changes in input variables affect the forecasted outcomes. This aids in understanding the impact and equips you to take decisions accordingly.
 Note: Currently, the what-if forecast cannot be applied when influencing factors are chosen.
Treat as What-if Forecasting option applies the what-if analysis only to the forecasted values. Refer to What-If Analysis. article to learn more.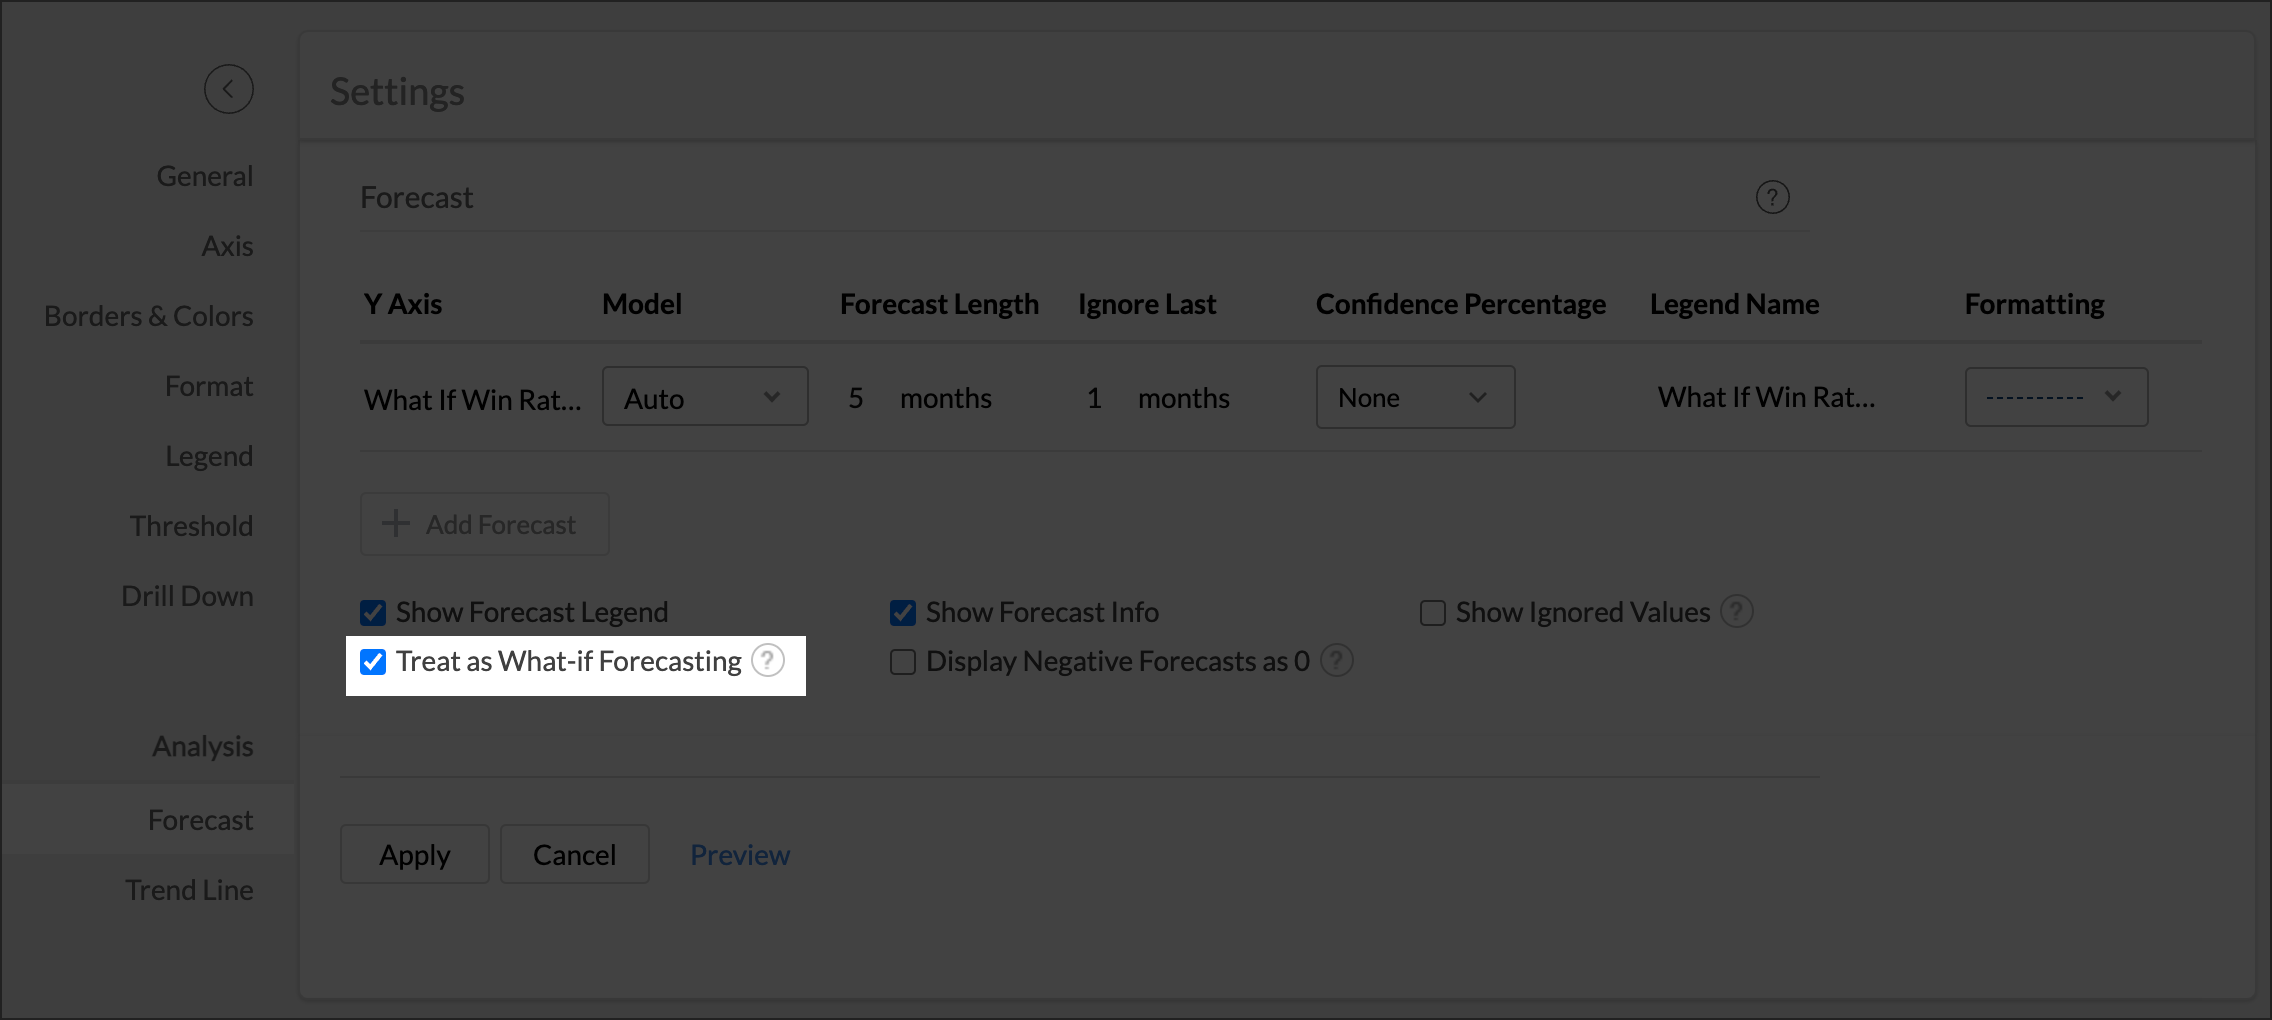
Forecasting in Pivot Tables
You can apply forecasting to a pivot table to predict future values for each measure across every series in the view. Forecasting in pivot tables uses the same forecast models and accuracy measures as chart forecasting, and adds controls suited to the row and column structure of a pivot table. For the concepts shared with charts, such as the forecast models and the performance indicators, refer to Forecast Model Information and How Forecasting Works in Zoho Analytics.
Data requirements
To apply a forecast to a pivot table, place a Date column in the Rows shelf and at least one aggregated measure in the Data section.
The measure can use any aggregate function, including Sum, Minimum, Maximum, Average, and Count, and it can be an aggregate formula or a formula column. The Min and Max of a date column, and aggregate formulas that return a date or a string, cannot be forecasted. You can include group-by columns, including data bucketing columns, alongside the date column.
Supported date combinations
Forecasting works with the following date setups in the Rows shelf:
- A single actual date column. All actual date functions are supported.
- A date hierarchy built from one date column, where the top level is an actual date that anchors the timeline, such as Year or Quarter & Year, followed by seasonal levels of the same date column arranged from the largest time span to the finest, such as Quarter, then Month, then Week, then Day.
Forecasting is disabled in the following cases:
- The first date level is not an actual date. The top level in the Rows shelf must use an actual date function (such as Year or Quarter & Year) to anchor the timeline, and seasonal levels can follow it.
- More than one actual date level is used. Only the top level can use an actual date function.
- The seasonal levels are not in hierarchy order, from the largest time span at the top to the finest below it.
- A seasonal date level is used alongside date levels from a different date column. When you use a seasonal period, all date levels in the Rows shelf must come from the same date column.
Applying forecast to a pivot table
- Build the pivot table with a Date column in the Rows shelf and at least one measure in the Data section.
- Start the forecast in one of the following ways:
- Click Analysis in the toolbar, then click Forecast.
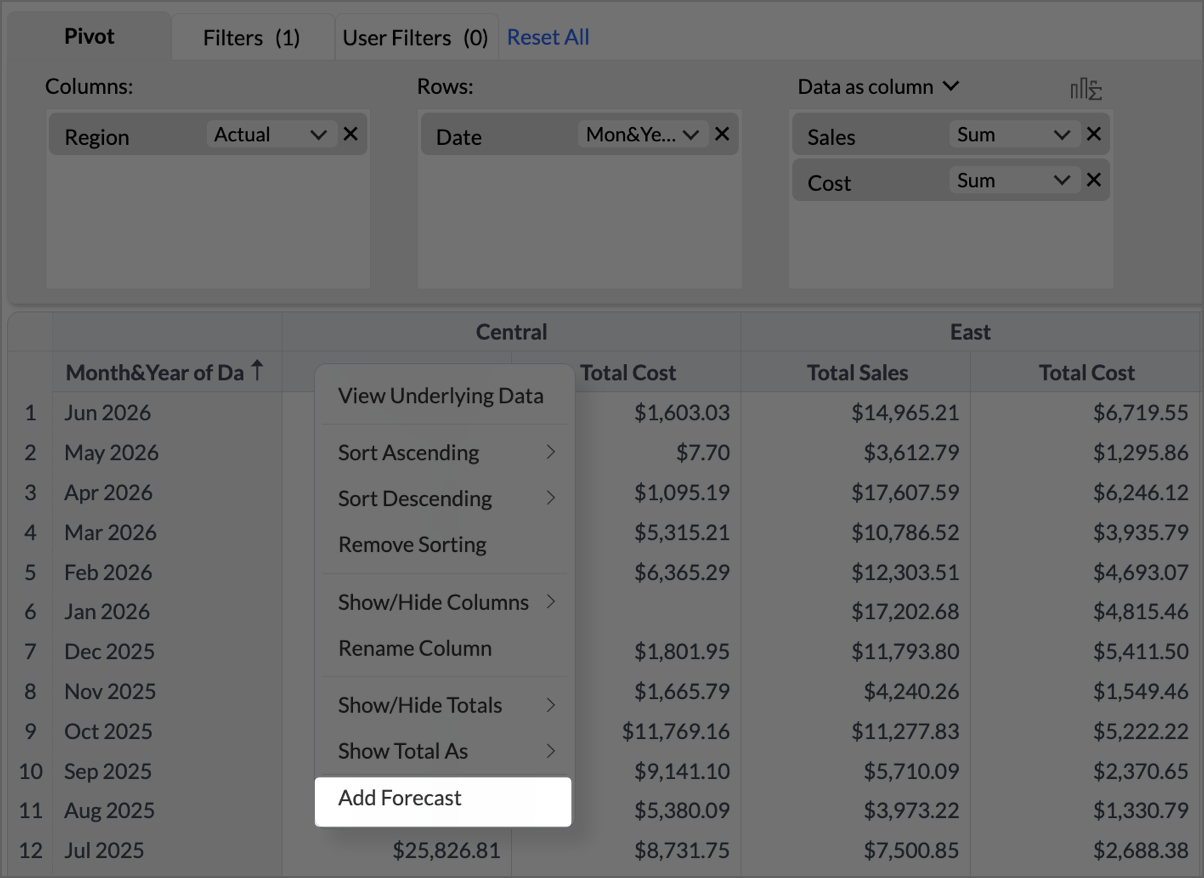
- Right-click any data cell, then click Add Forecast.
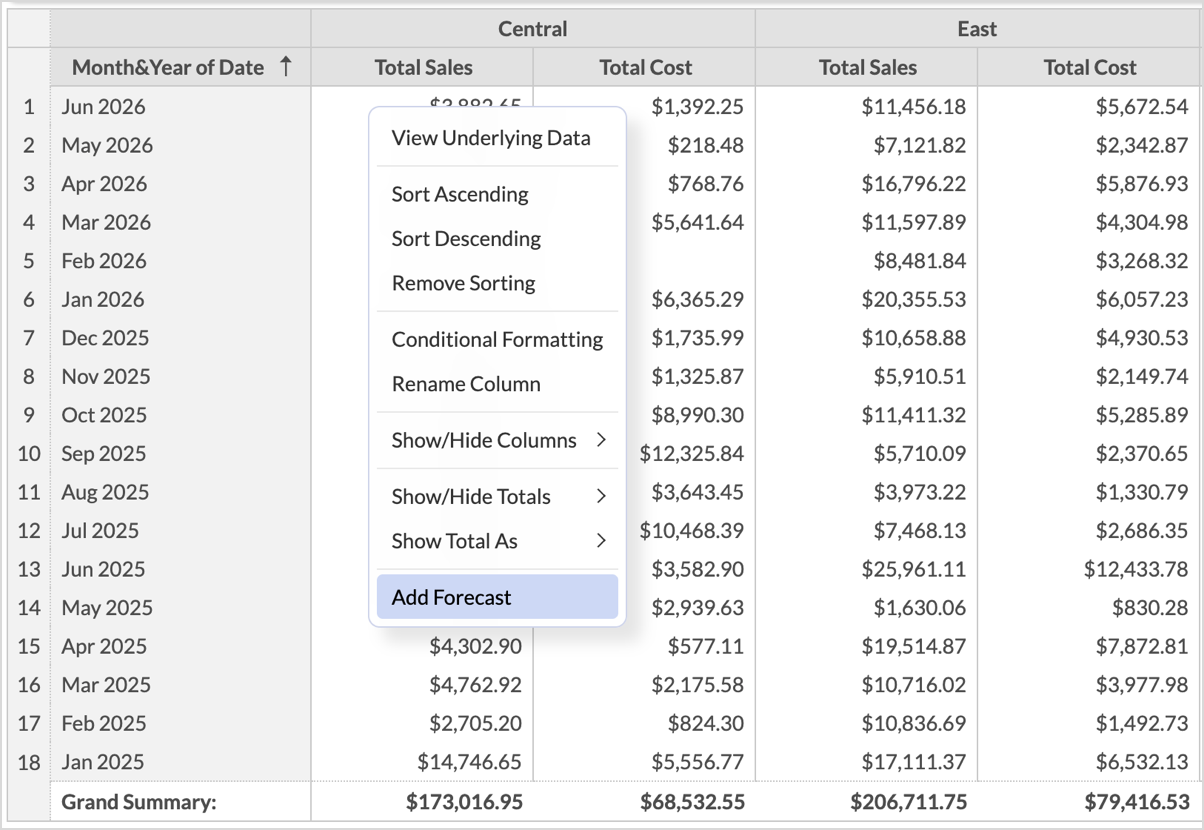
- Right-click a column header, for example Total Sales, then click Add Forecast.
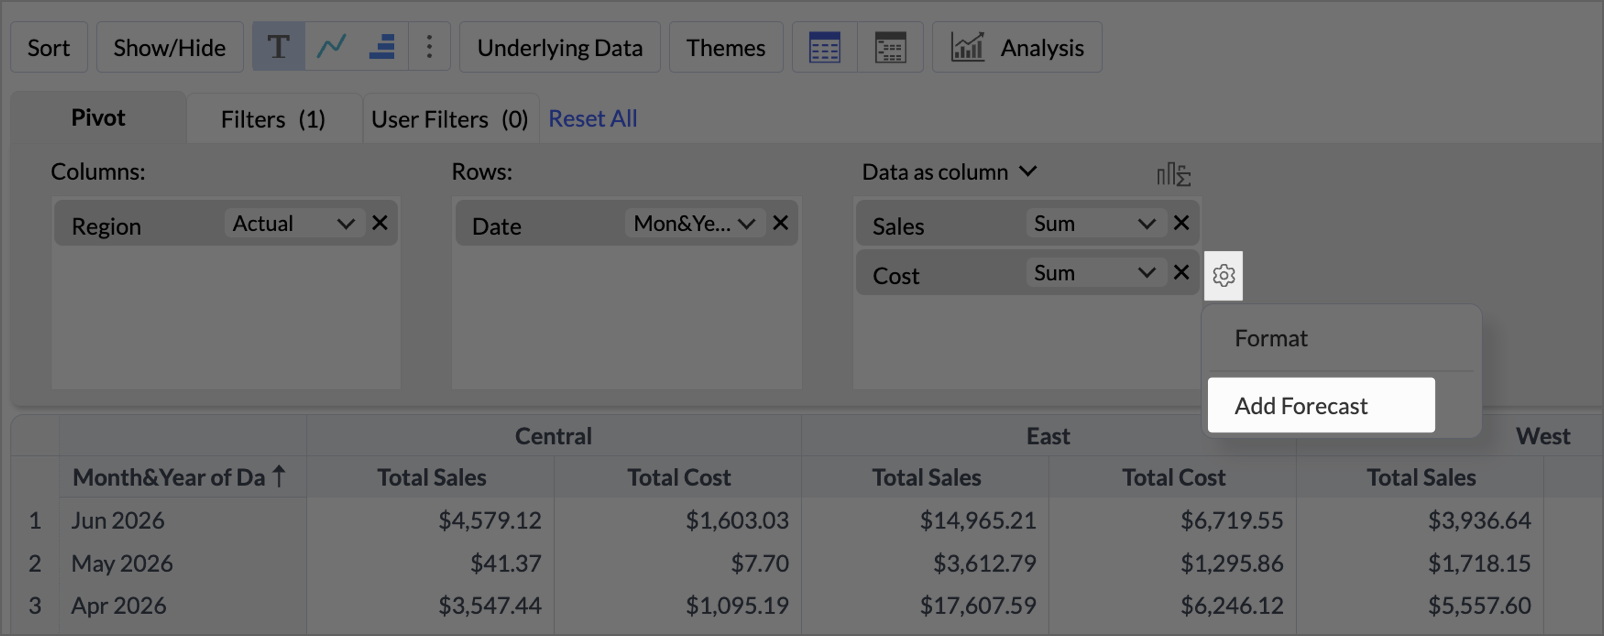
- In the data shelf, hover over a measure to show its settings icon, click the icon, then click Add Forecast.
- Open Settings, select the Analysis tab, expand Forecast, then click + Add Forecast.
- Click Analysis in the toolbar, then click Forecast.
- In the Forecast panel, configure the forecast for each measure as described in Configure the forecast.
- To forecast an additional measure, click + Add Forecast and configure the new row.
- Click Apply.


Configuring the pivot forecast
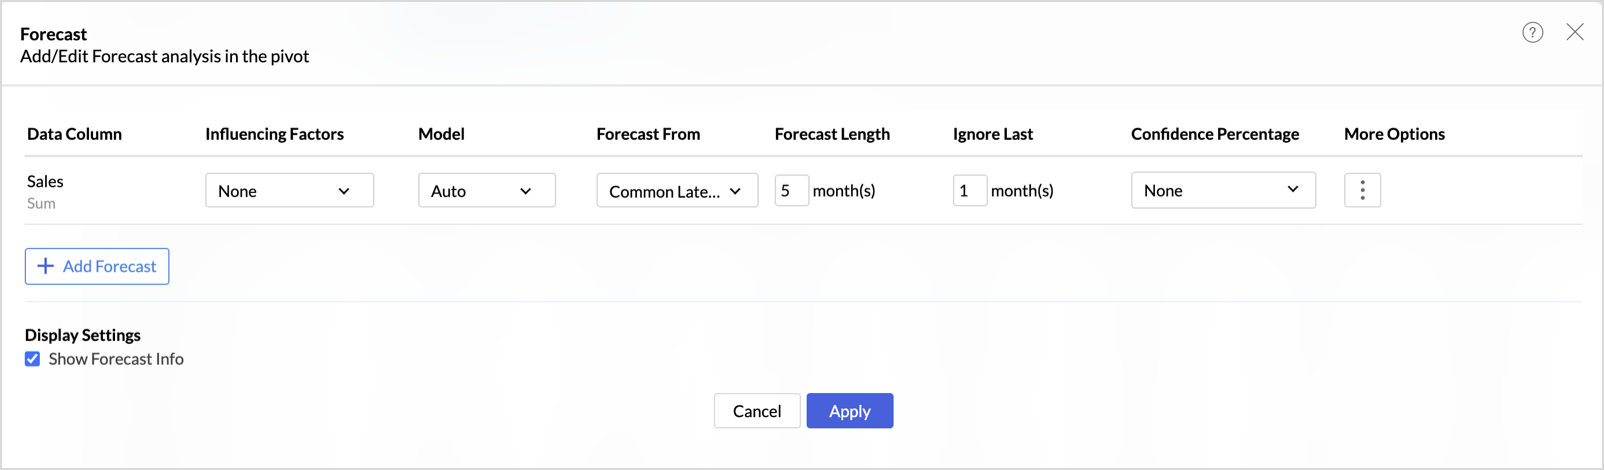
Each row in the Forecast panel configures the forecast for one measure, shown under Data Column. Set the following options for the measure:
- Influencing Factors: Select up to five additional measures whose past values may improve the forecast of the target measure. Click the drop-down, choose a column, then choose its aggregate function. When one or more influencing factors are selected, the Vector Auto Regression model is applied automatically, as in chart forecasting. For more about influencing factors, refer to How to Apply Forecast in Zoho Analytics.
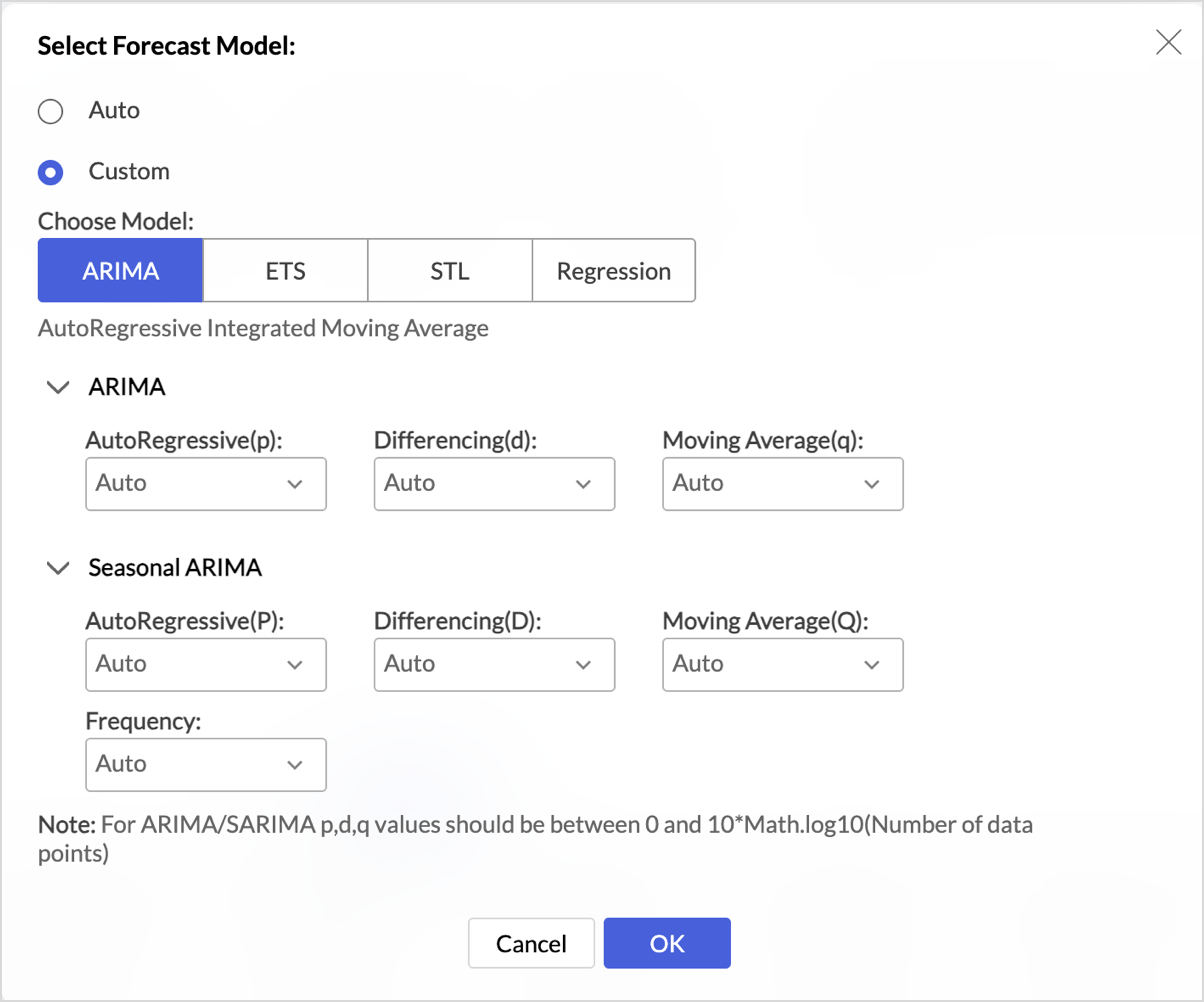
- Model: Choose Auto to let Zoho Analytics select the best model for your data, or choose Custom to select a model and set its parameters. The Custom picker provides ARIMA, ETS, STL, and Regression. For a description of each model and its parameters, refer to the forecasting models article.
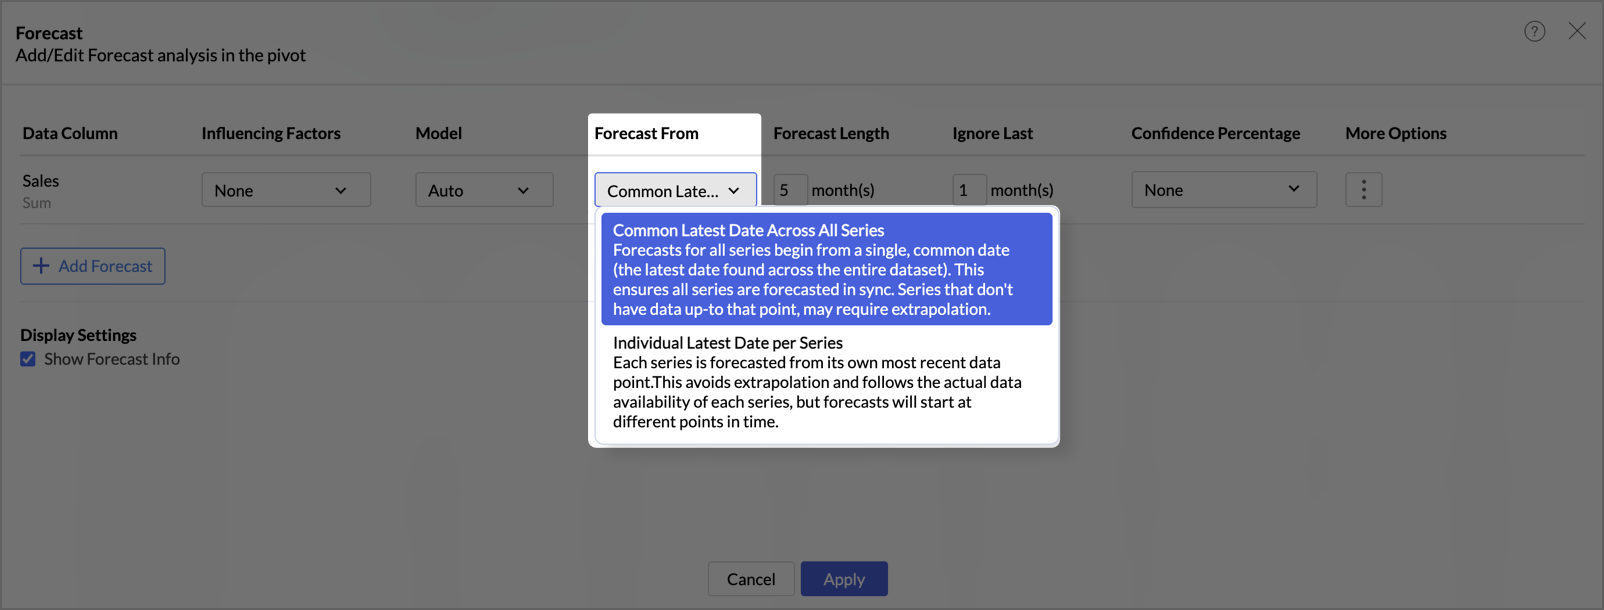
- Forecast From: Choose the point from which the forecast starts. This setting controls how series with different end dates are handled.
- Common Latest Date Across All Series: All series begin forecasting from a single common date, the latest date found across the whole dataset. This keeps the series in sync. Series that do not have data up to that date may require extrapolation.
- Individual Latest Date per Series: Each series begins forecasting from its own most recent data point. This avoids extrapolation and follows the actual data availability of each series, but the series start forecasting at different points in time.
- Forecast Length: Specify the number of future data points to forecast. The unit follows the date period used in the view, such as months.
- Ignore Last: Specify the number of recent data points to exclude from the training data. The forecast is then based on the data before the ignored points, which helps exclude incomplete or unreliable recent periods.
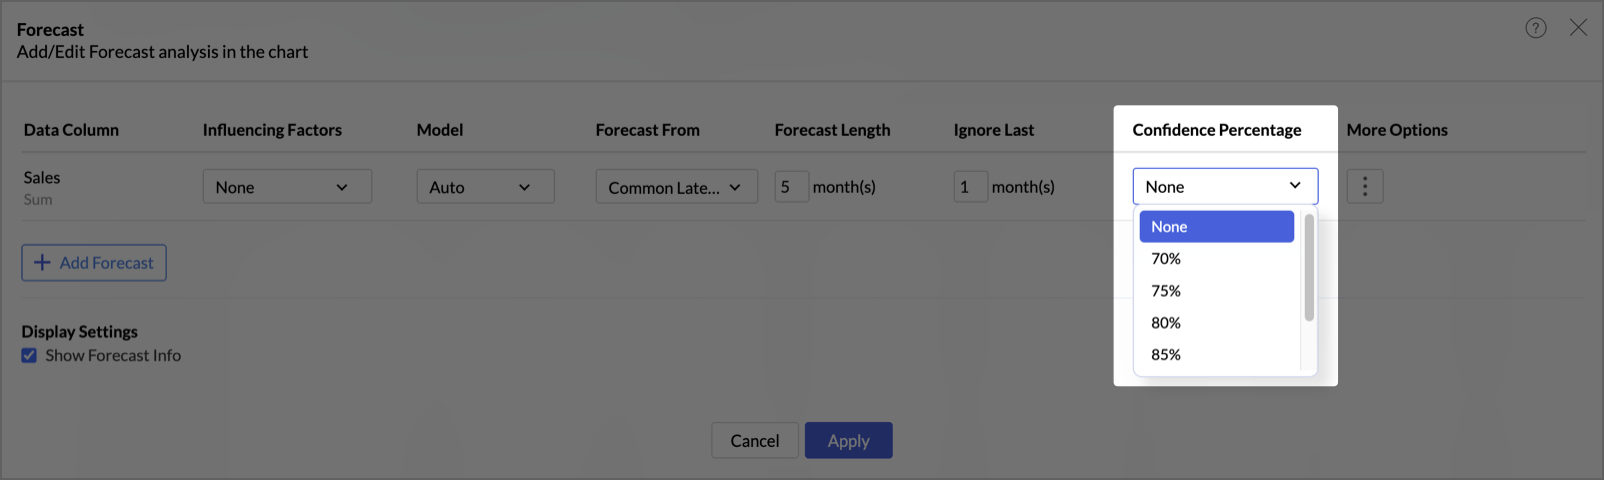
- Confidence Percentage: Choose None, or a confidence level such as 70%, 75%, 80%, 85%, 90%, or 95%. The confidence level sets the certainty that the forecasted values fall within the displayed range.
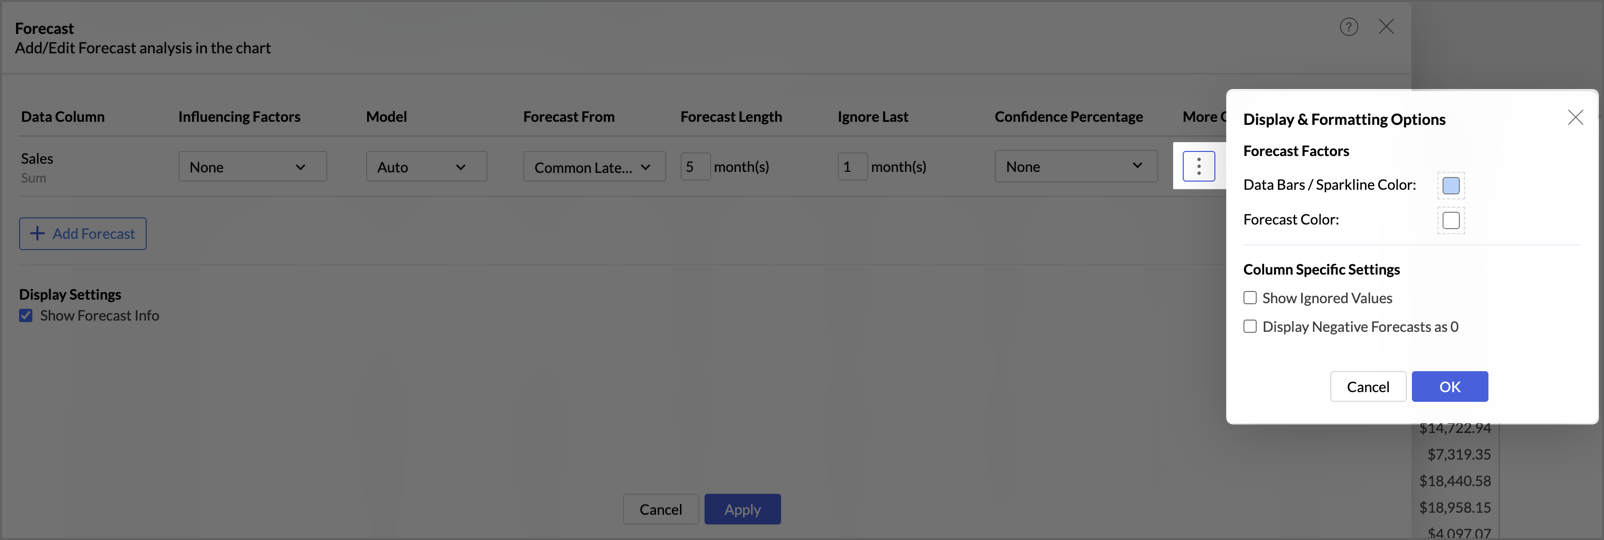
- More Options: Click the More Options icon to open Display & Formatting Options for that measure. These per-measure settings override the common settings.
- Under Forecast Factors, set the Data Bars / Sparkline Color and the Forecast Color. These colour settings apply only when data bars or sparklines are enabled for the measure.
- Under Column Specific Settings, enable Show Ignored Values to display the points excluded by Ignore Last, and enable Display Negative Forecasts as 0 to replace negative forecasted values with zero.


Under Display Settings at the bottom of the panel, enable Show Forecast Info to make the forecast model information available for the report. This is a common setting that applies to all forecasted measures.
How forecasted values appear in the pivot table
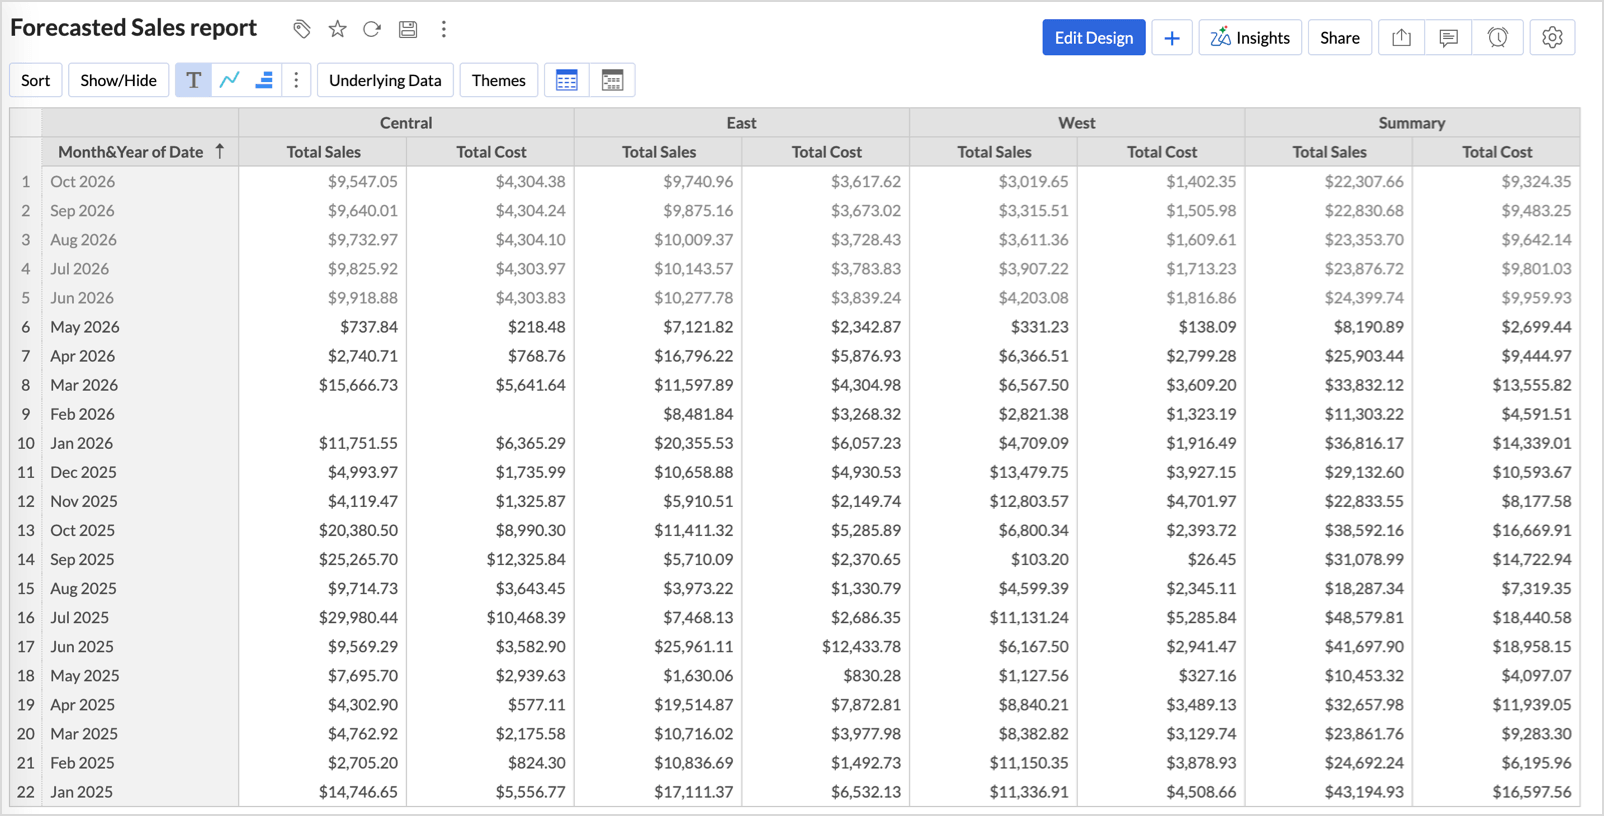
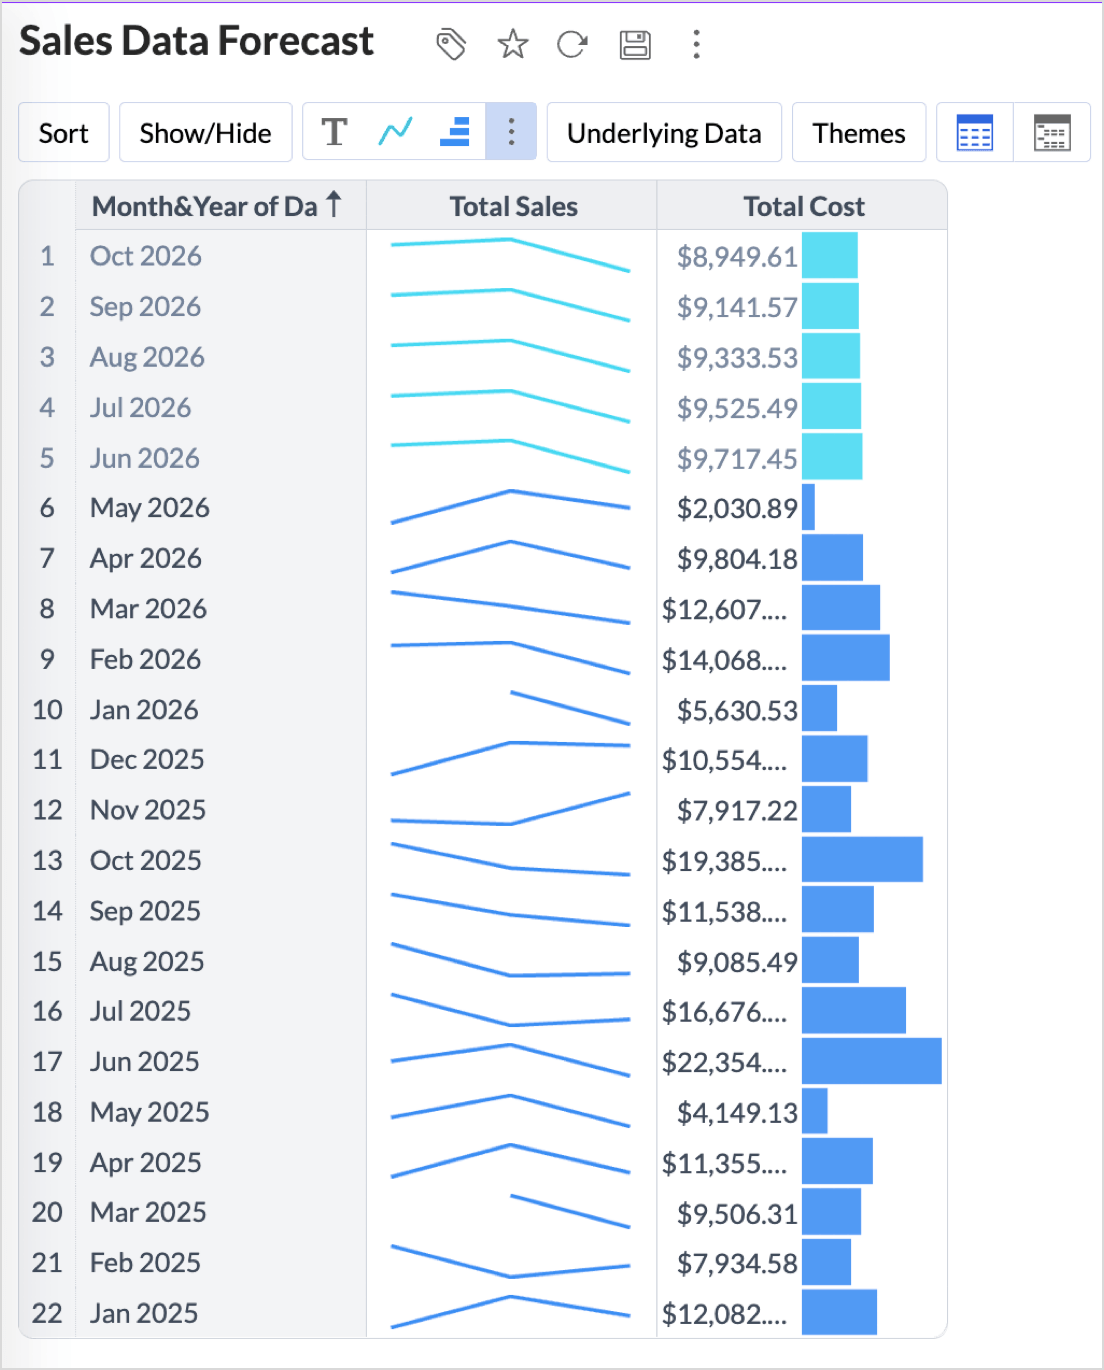
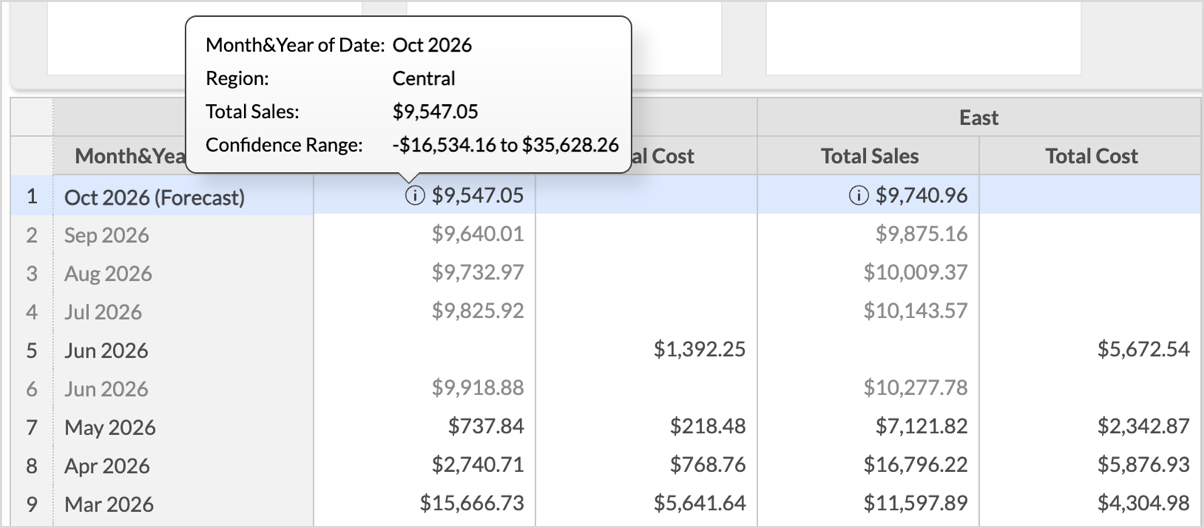
After you apply a forecast, the forecasted rows are added to the pivot table and shown in a lighter font to distinguish them from the actual values. The forecasted period is labelled in the Date column, for example Oct 2026 (Forecast).
Forecasted values can also be displayed as data bars or sparklines, in the same way as actual values. The forecasted portion uses the Forecast Color set under More Options, so it stays distinct from the actual data.
When you hover over a forecasted value, an information icon appears next to it. Clicking the icon shows a tooltip with the segment details, the date, and the measure value. When a confidence percentage is set, the tooltip also shows a Confidence Range with the lower and upper limits of the forecast.
Viewing the forecast model information
The forecast model information shows the model used and the statistics that describe its accuracy, for each forecasted measure. It is available after a forecast is applied and Show Forecast Info is enabled.
To open it, right-click a forecasted value, then click Forecast Info (or) Hover over a forcasted value and click the info icon.
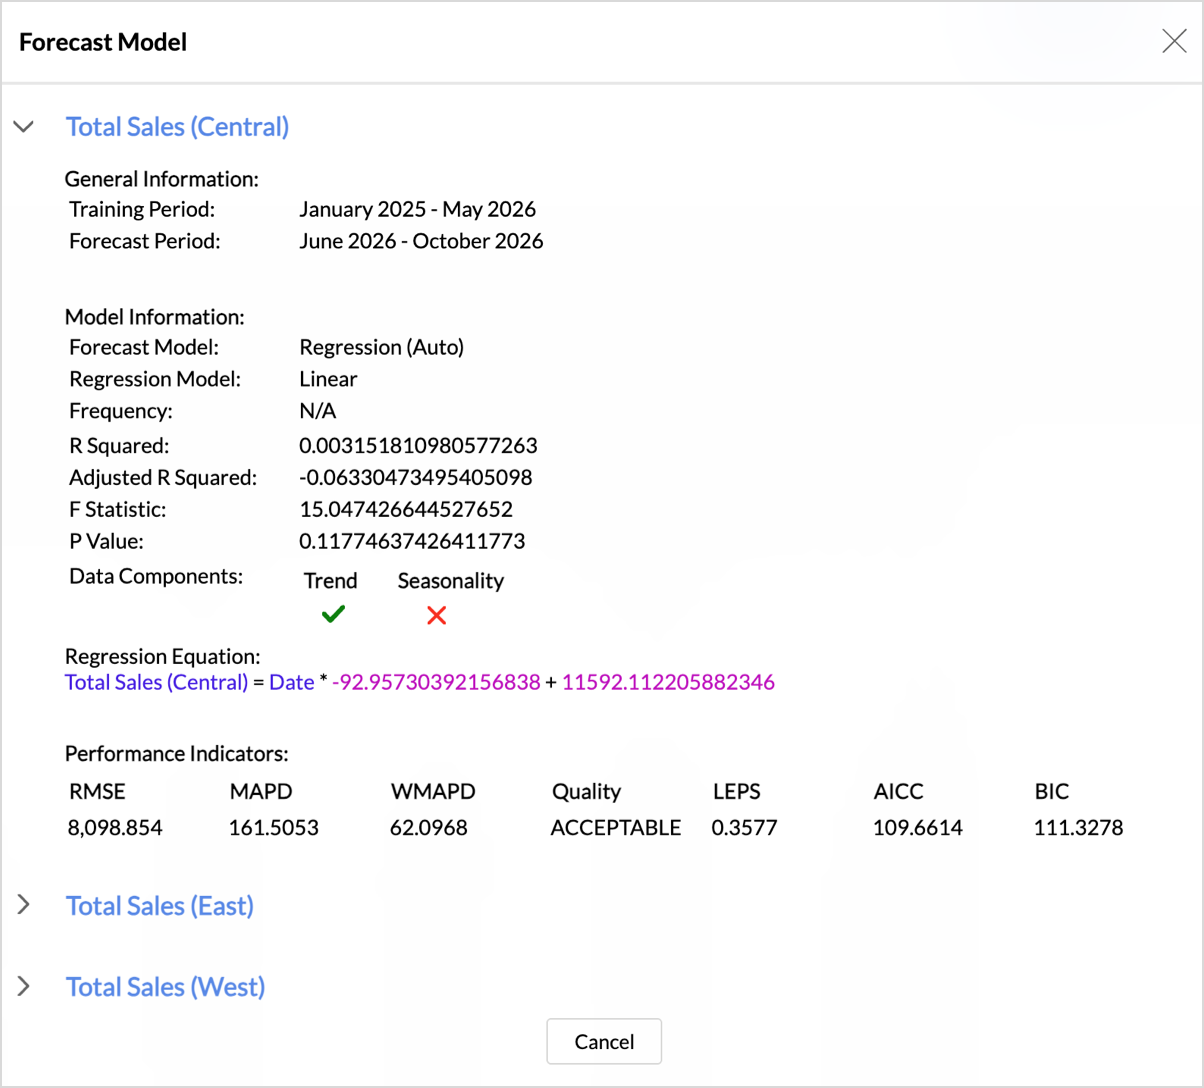
The Forecast Model dialog lists each forecasted series, for example Total Sales (Central), which you can expand to view its details:
- General Information: The training period and the forecast period.
- Model Information: The forecast model used, the model sub-type and parameters, and whether trend and seasonality are present.
- Regression Equation: Shown for regression models.
- Performance Indicators: RMSE, MAPD, WMAPD, Quality, LEPS, AICC, and BIC.
For the definitions of the models, components, and performance indicators, refer to Forecast Model Information.
Working with a forecasted pivot table
Totals
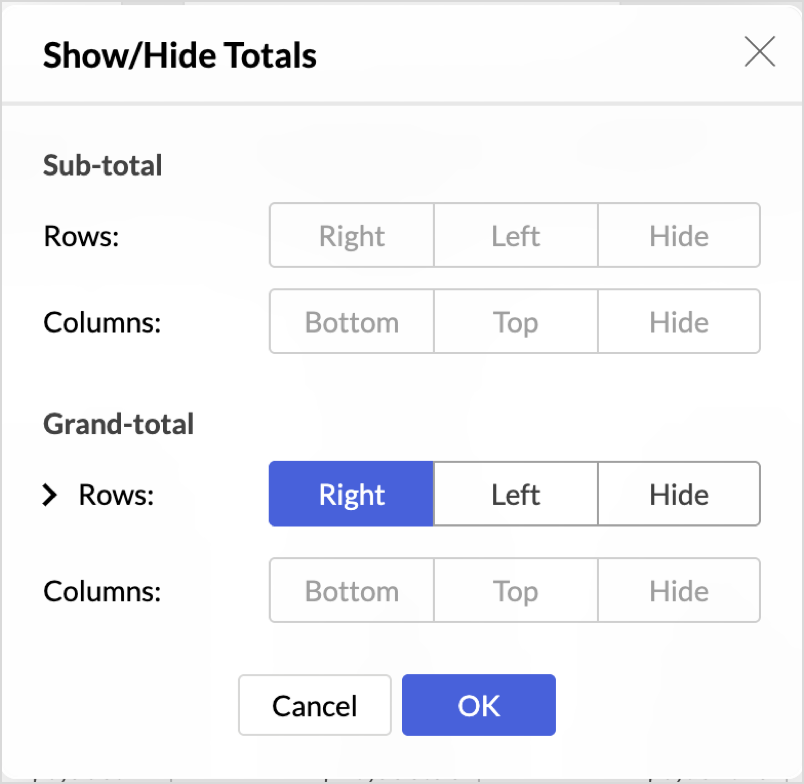
When a forecast is applied, the row-wise grand total is available and can be positioned or hidden per measure through Show/Hide > Totals, or by right-clicking a value and choosing Show/Hide Totals. In the Show/Hide Totals dialog you can set the row grand total for each measure to Right, Left, or Hide.
Conditional formatting
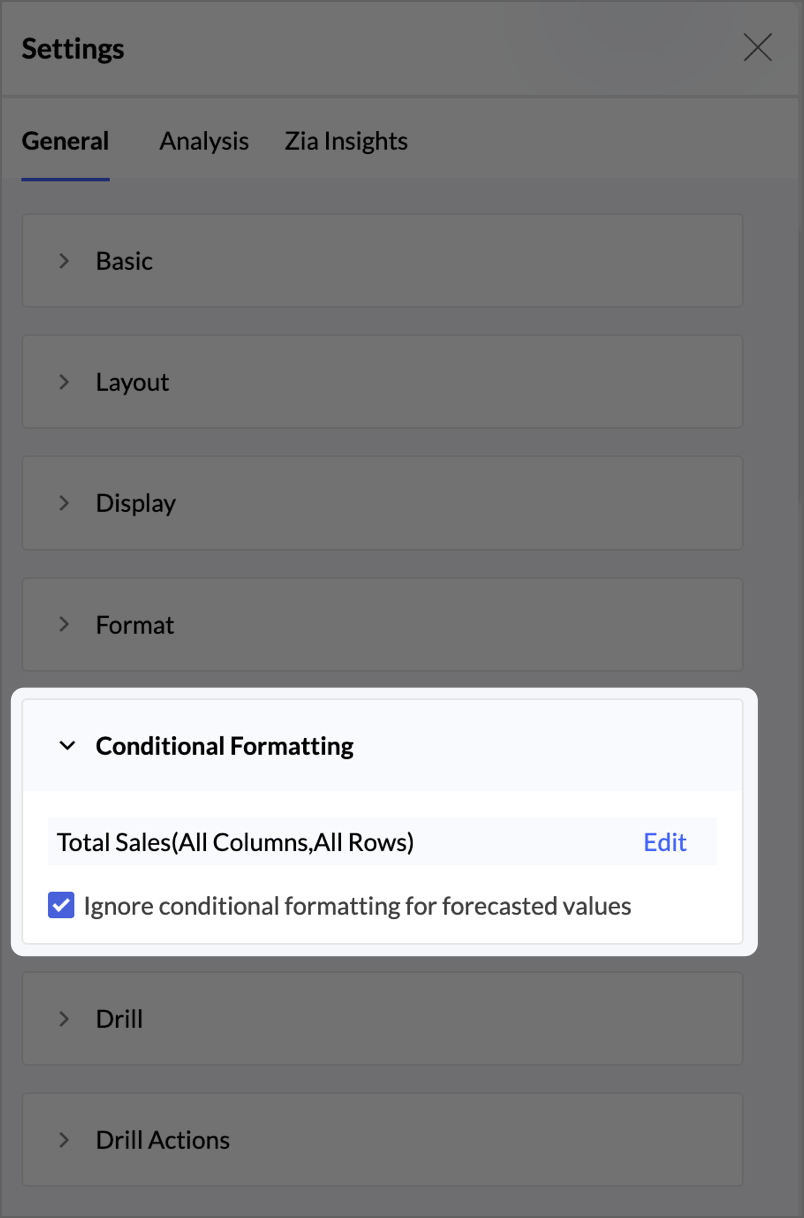
Conditional formatting is supported and, by default, applies to the whole series, including the forecasted values. To exclude the forecasted values, open the Settings icon at the top right, go to the General tab, expand Conditional Formatting, and enable Ignore conditional formatting for forecasted values.
Sorting, renaming, and filters
Ascending, descending, and custom sorting of dimensions and dates are supported with forecasting. You can rename column names and summary names on a report that has a forecast. Filters and user filters work with their default behaviour.
Exporting and reusing a forecasted pivot table
When you export a forecasted pivot table, the actual and forecasted values are exported together. A Type column is added next to the date value in each group to distinguish actual values from forecasted values.
Forecasting is retained when you export the report as a template, save the report as a new report, duplicate the workspace, copy the report through the API, take a data snapshot, or create a similar report from another table.
Limitations of pivot forecasting
Data requirements
- A minimum of seven data points are required for forecasting.
- If more than 40% of the data points are empty, the data cannot be forecasted.
- A maximum of 20 series can be forecasted in a single pivot table. Apply filters to reduce the number if this limit is exceeded.
- A Date column in the Columns shelf is not considered for forecasting.
Supported measures
- The Min and Max of a date column cannot be forecasted.
- Aggregate formulas that return a date or a string cannot be forecasted.
Forecast configuration
- The Treat as What-if Forecasting option is not available for pivot tables.
Totals
- The column grand total is not available when a forecast is applied.
- Sub-totals are shown for actual-value rows only.
- Row-wise summaries are available only for the Sum, Minimum, Maximum, Average, and Count aggregate functions.
Interactions
- View Underlying Data and Drill through are not supported for forecasted data points, because underlying data is not generated for forecasted values.
- A view formula cannot be applied to forecasted columns. If applied, the forecasted date values are left empty.
- Window functions are not supported for forecasted data.
- Data alerts evaluate actual data only, so forecasted values are excluded.
Dashboard
- The Enable Report to act as filters dashboard setting does not apply to forecasted rows.
Export - Confidence interval Lower limit and Upper limit columns are not included in the export.
Forecast Model Information
The forecast model information provides details about the model used and statistical information to evaluate the performance (accuracy) of the forecasting model. This option is enabled once the forecasting is applied to a report. This information is specific for each metric being forecasted.
Forecast info can be invoked in one of the following ways:
The below steps are applicable for both Edit and View modes
- Click the Settings icon > Analysis > Forecast.
- Click Edit, the forecast dialog will open, and click the Forecast Info that appears on hover to view the details.
- From the forecast legend in Edit mode: Click the Legend of the forecasted value and choose Forecast Info from the drop-down menu.
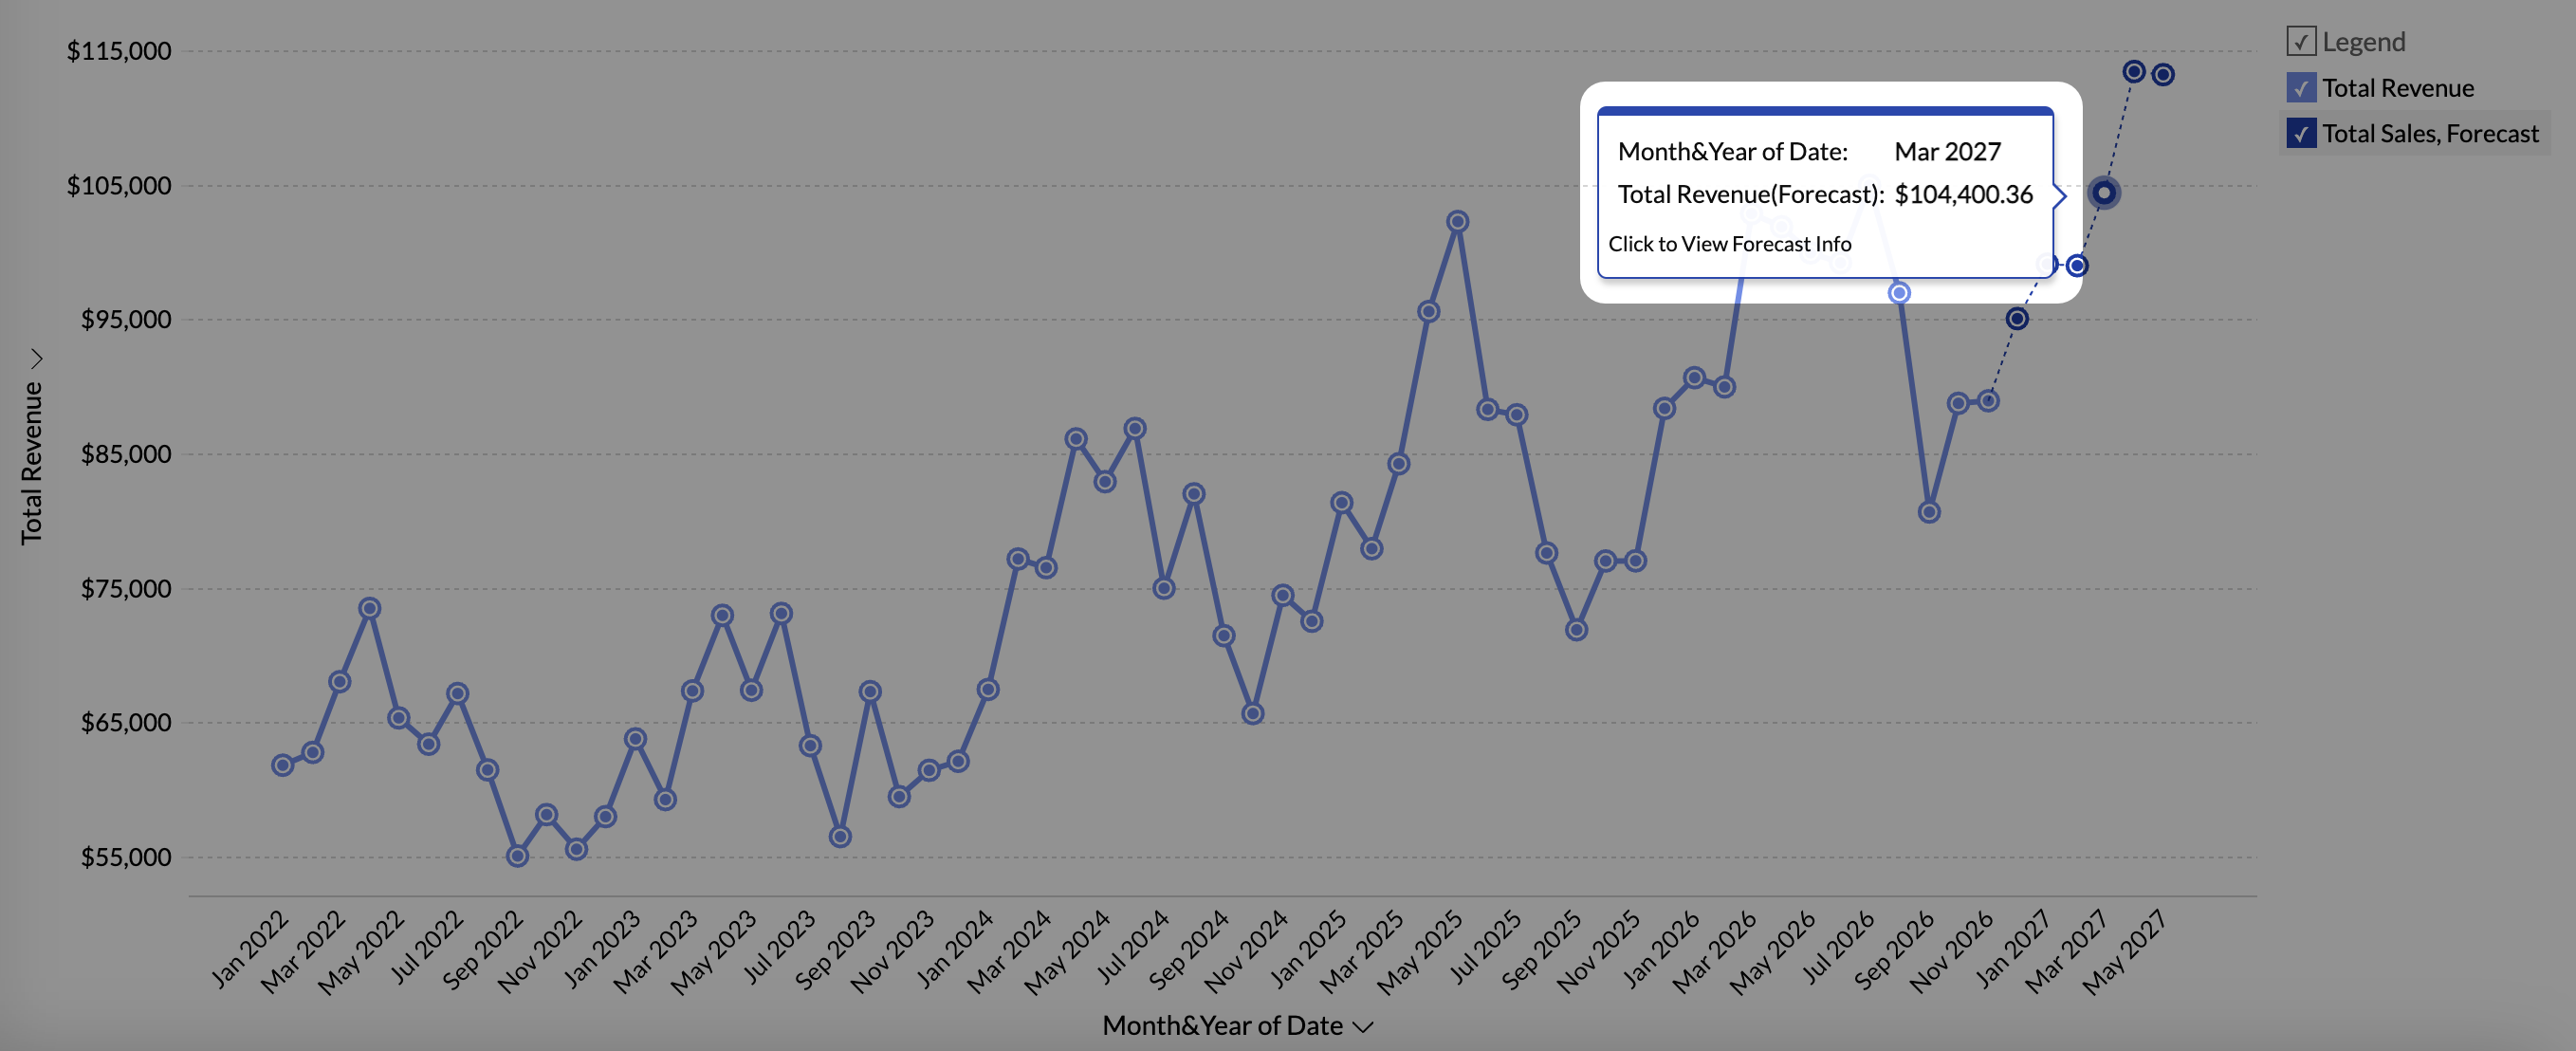
- From the forecasted data points in View mode: Click any of the forecasted data values and choose Click to view forecast model info.


General Information
This section gives the following details:
- Training Period: This gives the historical data range used for forecasting data points.
- Forecast Period: This gives the time frame for which the data is forecasted.
Model Information
Forecast Model: Displays the Forecast model used for prediction. Zoho Analytics supports 5 prediction models such as ARIMA, STL, ETS, Regression and Vector Auto Regression.
Elements of the Forecast models
This section displays the sub methods and parameters or coefficient values of the forecast model used for analysis.
ARIMA Model
The ARIMA model forecasts values in a time series based on its past values by computing both seasonal and non-seasonal trends. The non-seasonal component captures the general trends and short-term fluctuations in the data that don't follow a repeating pattern. The Seasonal component captures the repeat at regular intervals.
The ARIMA value (p, d, q) (p, d, q)m denotes the ARIMA model, where the first ordered triplet (p, d, q) represents the non-seasonal component and second ordered triplet represents (p, d, q)m represents the seasonal component.
Non-Seasonal (p, d, q)
- p is the number of lag observations in the AR (AutoRegressive) component. A lag in time series analysis refers to the use of past values of a variable to predict its future values.
- d is the number of times the data needs to be difference to make it stationary. (i.e., removing trends or seasonality).
- q is the number of lagged forecast errors in the MA (Moving Average) component.
The ARIMA model is characterized by 3 main parameters:
- The AR (AutoRegressive) part of an ARIMA model uses the past values of the time series to predict future values. The parameter p determines the number of past observations (lags) used to predict the current value. For example, p = 2 means the model uses two most recent values to predict the current value
- Integrated (d) is the method used to make the times series stationary. A stationary time series is one whose properties do not depend on the time at which the series is observed.
- The MA (Moving Average) part of an ARIMA model captures the dependency between a data point and the residual errors from previous time steps. Instead of relying on past values like AR (AutoRegressive), MA uses past forecast errors to make predictions.
Exponential Smoothing
Exponential smoothing is a time series forecasting method that uses an exponentially weighted average of past observations to predict future values. In the model info dialog, the smoothing model used is listed.

STL
In the STL model, the data is split into three components namely Trend, Seasonality and Residue. In the model info dialog, the Decomposition method that is used for smoothing the parameters and the decomposed values are listed.
Regression
Regression is a statistical method used to understand and model the relationship between a dependent variable and one or more independent variables. Forecast info dialog displays the Regression model and the statistical methods used for evaluating the model's performance. The types of regression models used are linear, logarithmic, exponential, power, and polynomial.
The following are the statistical methods used to assess the performance of the regression model.
- R-Squared is the statistical method to use to evaluate how well the model fits the data. It calculates how much variation of the dependent variable is explained by the independent variable in the regression model.
- It shows what percentage of the changes in the outcome (dependent variable) can be explained by the factors you are using in your model (independent variables).
- Adjusted R-Squared - This ensures that the model does not over fit. The model with the highest Adjusted R-Squared will be applied over your data.
- The F-statistic is used to assess the overall significance of the model, particularly whether the independent variables together have a statistically significant effect on the dependent variable.
- The P-value is used to assess the significance of independent variables in the model. It helps determine whether the relationship between the independent and the dependent variable is statistically significant.
Vector AutoRegression
A Vector AutoRegression (VAR) model is a statistical model used when multiple factors (time series) are interdependent, and each series' forecast values are influenced by its own past values and the past values of the other series.
The forecast info dialog displays the number of lag observations used. For a VAR(p), p denotes that each data point is predicted using its own past values and the past values of other data points, up to p time periods back.

Performance Indicators
Root-Mean-Square Error:
The RMSE (Root Mean Square Error) calculates the mean difference between the actual value and the forecasted value.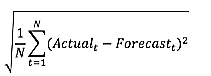
Mean Absolute Percentage Deviation
The MAPE (Mean Absolute Percentage Error) calculates the average absolute percentage difference between the actual values and the forecasted values.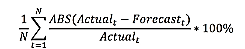
Weighted Mean Absolute Percentage Difference
The WMAPD (Weighted Mean Absolute Percentage Difference) calculates the average of the absolute percentage deviations between the actual values and the forecasted values, with each deviation weighted according to a specified criterion.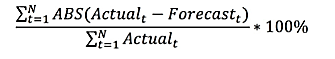
Linear Error in Probability Space
The LEPS (Linear Error in Probability Space) calculates the mean absolute difference between the forecast cumulative distribution value and the observation. The Quality of the forecast model is given based on LEPS.
The Quality of the forecasting model is decided based on the LEPS value.
- If LEPS > 80% then the forecast model accuracy is considered to be Good.
- If LEPS between 30 % to 80% then the forecast model accuracy is considered to be Acceptable.
- If LEPS < 30% then the forecast model accuracy is considered to be Poor.
Corrected Akaike Information Criterion
AICc (Corrected Akaike Information Criterion) is a modification of the Akaike Information Criterion (AIC), which is used for model selection. The AIC estimates the quality of a statistical model relative to other models.
Bayesian Information Criterion
BIC (Bayesian Information Criterion) is another statistical measure used to compare models and determine which one best fits a given dataset.

where:
k = number of parameters in the model, n = number of data points in the model, L = maximum likelihood of the model
How Forecasting Works in Zoho Analytics
Zoho Analytics offers a powerful forecasting engine which predicts future data points based on past data. The forecasting engine offers a range of customizations such as number of units to be forecasted, number of data points to be ignored in the past data and the formatting to be applied over the forecasted data points.
The following points describe how the forecasting engine works in Zoho Analytics:
- The forecasting engine analyses past data points.
- Based on the past data, the forecasting engine will identify the periodicity using auto-correlation method.
- Then it computes the seasonality, trend and randomness using the past data.
- By iterative processing, the forecasting engine fine-tunes the computed seasonality, trend and randomness.
- The engine runs linear, logarithmic and exponential regressions and identifies the data series falls under linear, logarithmic or exponential.
- The accuracy of the predicted results will be verified using Hindcasting. Hindcasting is the process of predicting the past data points and verify the same with the actual points.
- Once all verifications are done, the forecasting engine produces the final forecasted points
Working with the Forecast Reports
- Zoho Analytics allows you to export data in a variety of file formats. While exporting a forecast report, the forecasted values are appended to the end, and another column named Type is added to differentiate between the Actual Value and the Forecasted Value. If the confidence percentage is set, then the additional columns are added to display the upper and lower confidence limits.
- The forecasted value changes as the data gets updated; Data snapshots help to maintain a record of the forecasted values at specific periods
Troubleshooting Tips
1. I could not find "Forecast" option in chart settings. Why?
This could happen when the forecast constraints are not met. Please refer to the constraints specified.
2. Already configured forecasting settings are not available now. Why?
This could happen when the design of the chart has been modified, which does not match the forecast constraints.
3. I have configured forecasting for my chart. But it says, "Forecasting is disabled as the data is completely ignored". Why?
This could happen if you had set to ignore all the past data points from "Ignore Last" setting.
4. I have configured forecasting for my chart. But it says, "Forecasting is disabled as there is not enough data to identify pattern". Why?
This could happen when there is no sufficient data produced to forecasting engine to come up with forecasted data points.
5. I have configured forecasting for my chart. But it says, "Forecasting is disabled as there are more than 40% empty values". Why?
When the past data points provided to the forecasting engine has more null values, the forecasted points might be inaccurate. To avoid this, the forecasting engine will discard the process when the null values are more than 40% in the given data.
6. I have configured forecasting for my chart. But it says, "Column cannot be forecast as more than 5 data points is required". Why?
To produce an accurate forecast, the data points to be considered for forecasting should be more than 5 points. Try changing the time series in X-axis to a more granular function which may result in more data points. For example, If the existing time series is Year, then change to Month & Year.
6. The forecasted points shown in chart are different to the shared users. Why?
The chart could have been shared with different filter criteria to the shared users. Number of past data points available in the shared data could very for different shared users, hence the forecasted points are different for shared users.
The underlying data and drill down options are not available for forecasted data points. Why?
The forecasted points will not have underlying data generated for each of the forcasted data points. Hence, View Underlying Data and Drill Down options will not be available for forecasted data points.