Workspace Settings
Workspace Settings
Zoho Analytics allows you to specify a set of preferences for your Workspaces such as setting the beginning of your fiscal year, set chart color palette or grid theme across the reports and manage users, data alerts and slideshows.
1. What are the customization options available for Workspace?
Zoho Analytics provides various options to customize the Workspace to suit your need. They are largely grouped as follows:
- General
- Resource
- Format
- Color Palettes
- Grid Themes
- Manage Users
- Slideshow
- Variables
- Backup
2. How can I Customise Workspace?
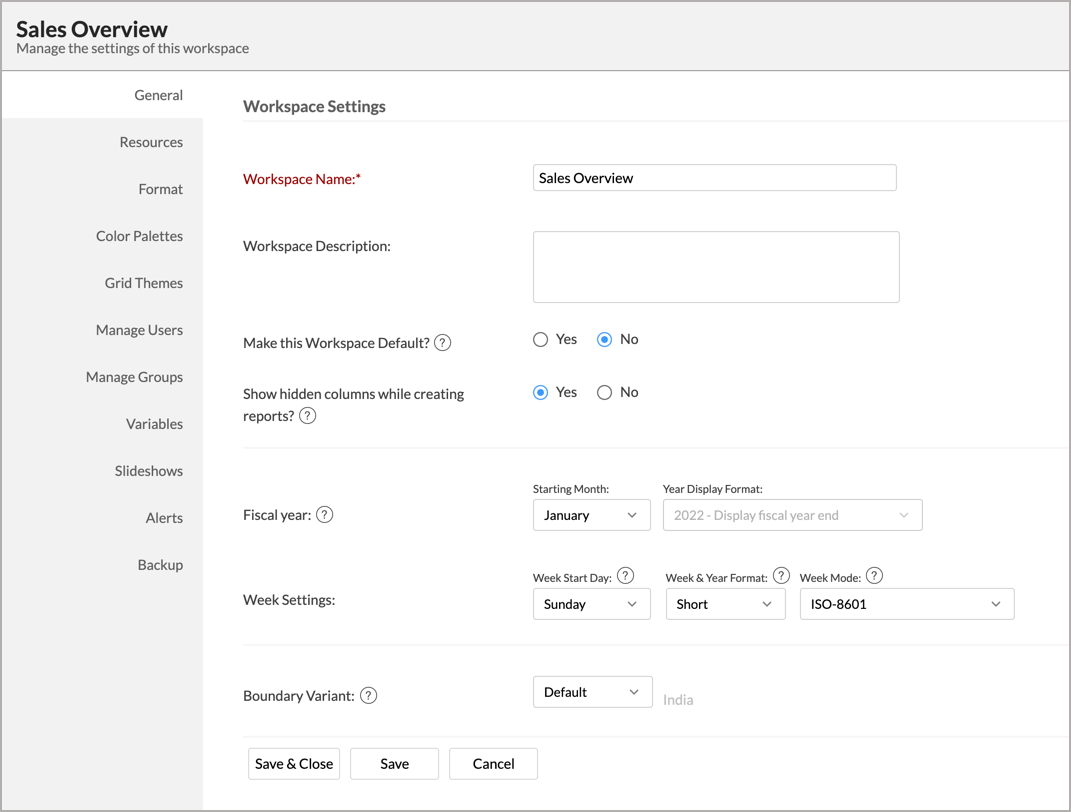
You can modify the preferences of the Workspace by clicking the Settings tab in the Workspace Explorer. The Settings page allows you to configure a wide range of options discussed in the below questions.
3. How can I rename the Workspace?
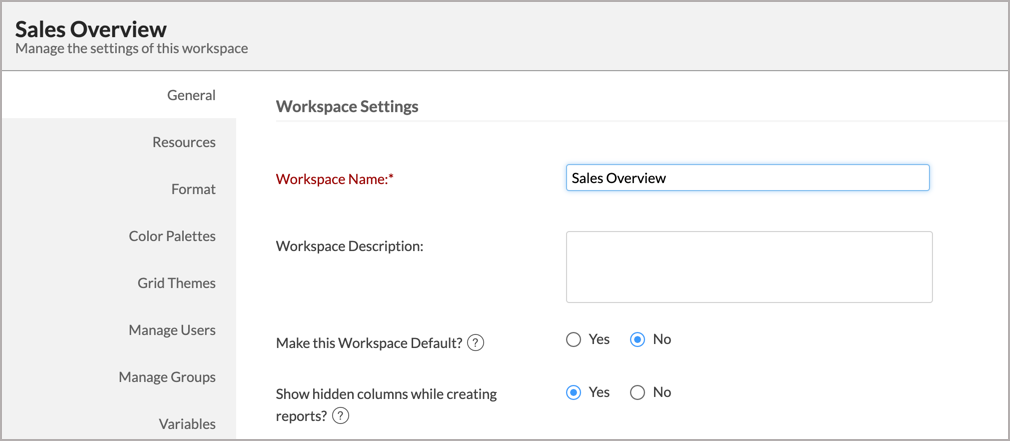
You can rename the workspace from the Settings page General tab. Modify the Workspace Name and Description as needed.
4. Can I set a Workspace as default?
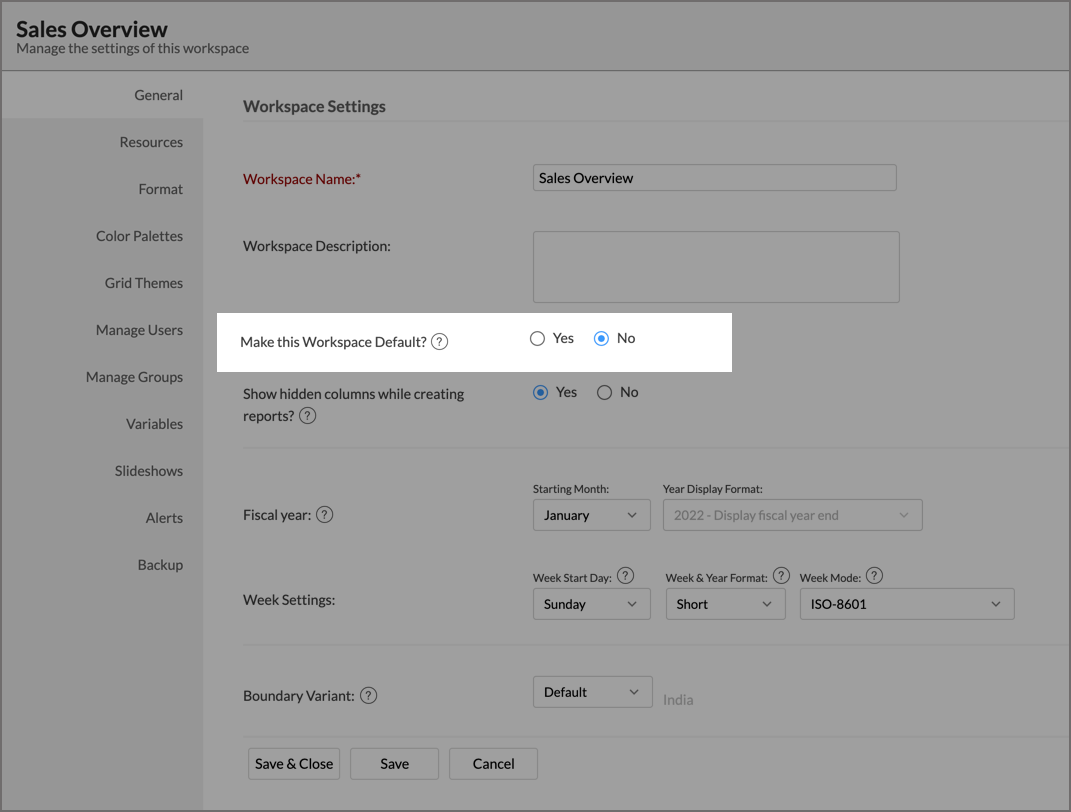
Yes, you can set a Workspace as a default. Set the Make this Workspace Default? to Yes, the Workspace will be marked as default and will be opened when accessing Zoho Analytics.
5.Can I show hidden columns in the Report designer?
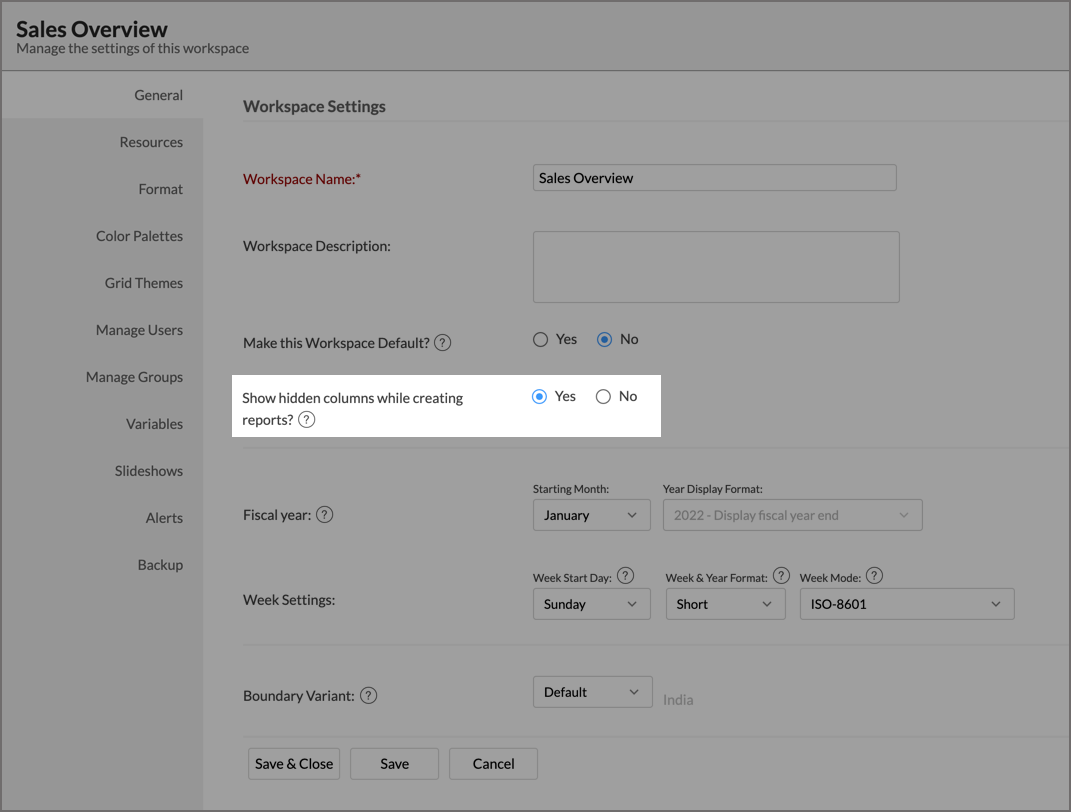
Yes, you can choose to list the hidden columns from the table in the report designer. To do this set the Show hidden columns while creating reports? to Yes.
6.Can I change the week and year format for my workspace? What are the different week and year formats supported by Zoho Analytics?
Yes, you can change the Week and Year format in your Workspace.
To change the week and year format,
- Open the Workspace Settings page, select the General tab.
- You can locate the Week & Year Format drop-down menu under the Week Settings section.
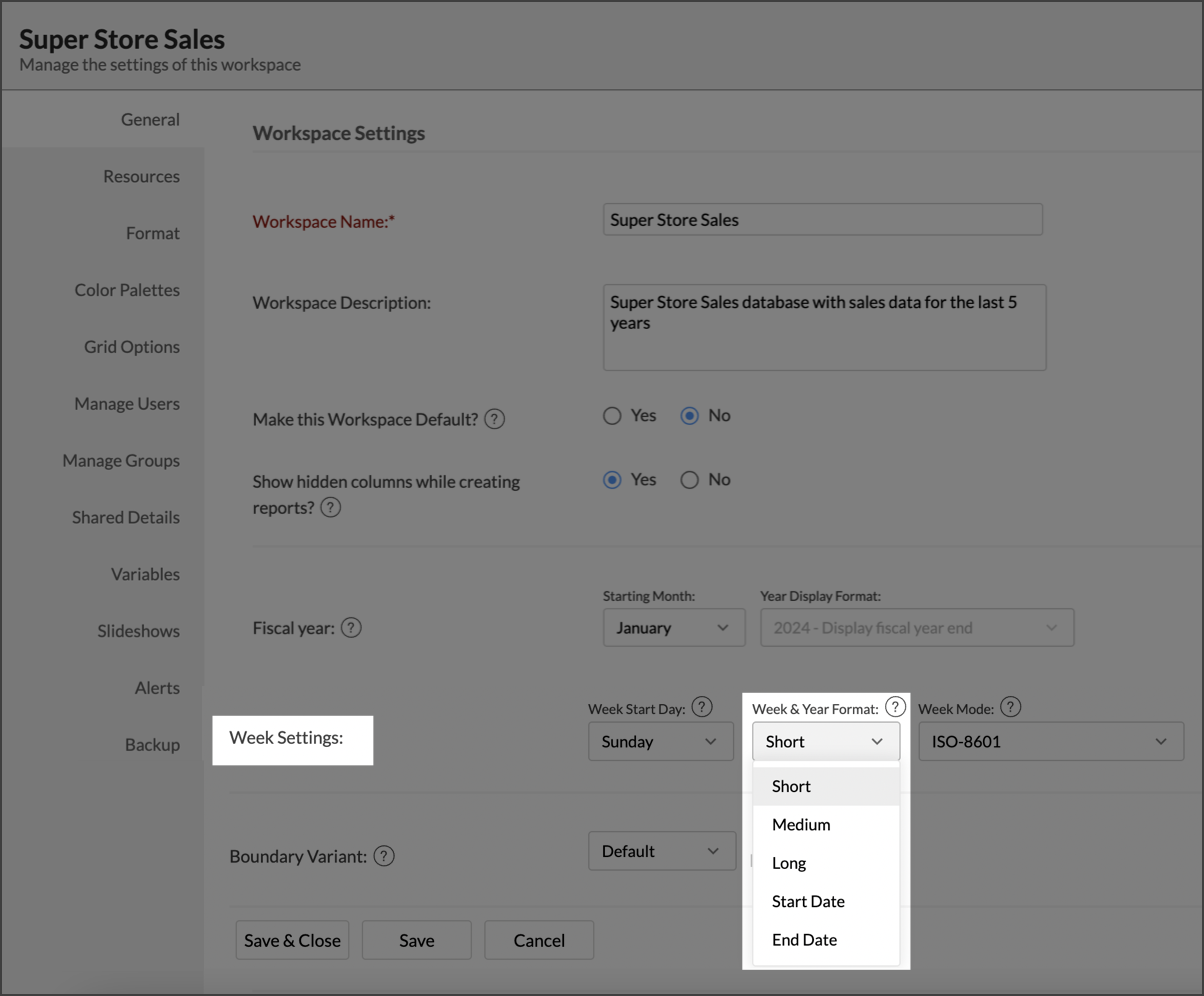
You can select between these available formats - Short, Medium, Long, Start Date and End Date of a week.
Format Display Description Short W01 2023, W02 2023 The week will be abbreviated "W" followed by the week's number and the year. Medium Week 01 2023, Week 02 2023 The word "Week" will be followed by the week's number and the year. Long 01 Apr 2023 - 07 Apr 2023 The week will be defined by its start date and end date. Start Date 01 Apr 2023 The week will be defined by its start date only. End Date 07 Apr 2023 The week will be defined by its end date only. - Click Save to continue.
Note:
- Any format change made at the Workspace Settings page, is applied across all the reports of the workspace.
- You can also change the Week & Year format at the report level. Click here to learn more.
7. Can I set the start day of the week for my Workspace?
Yes, you can set the starting day of the week using the Week start day option. By default, the starting day is set as Sunday. You can choose to modify this to one of the following options:
- Sunday
- Monday
- Tuesday
- Wednesday
- Thursday
- Friday
- Saturday
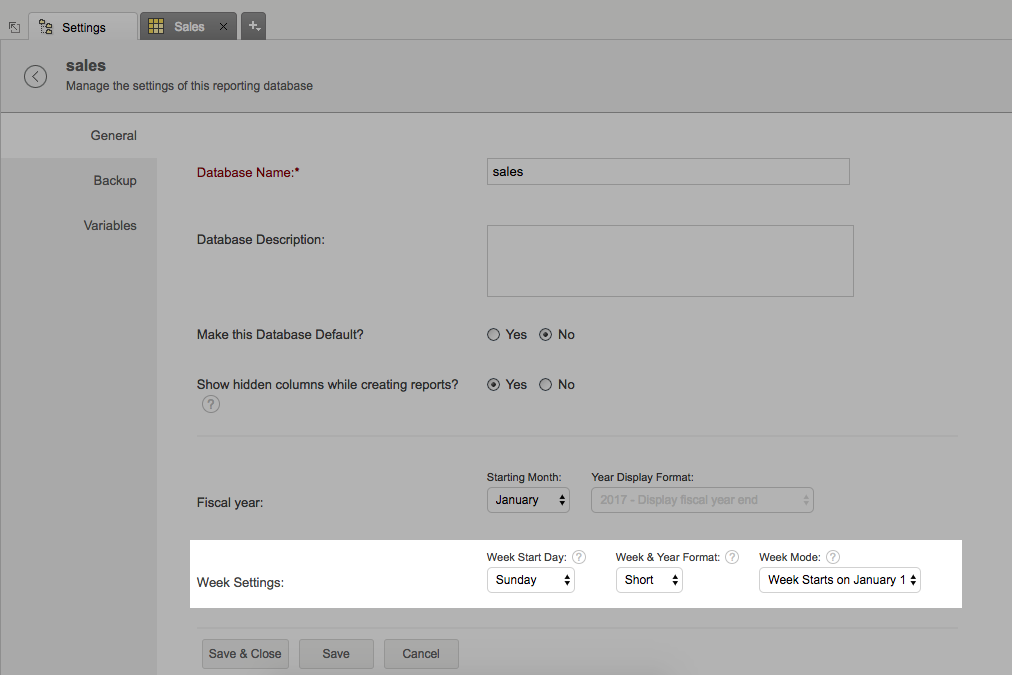
The selected day will be used as the start day of the week. This will be used to compute the weeks while generating reports.
8. Can I set the first Week for my fiscal Year?
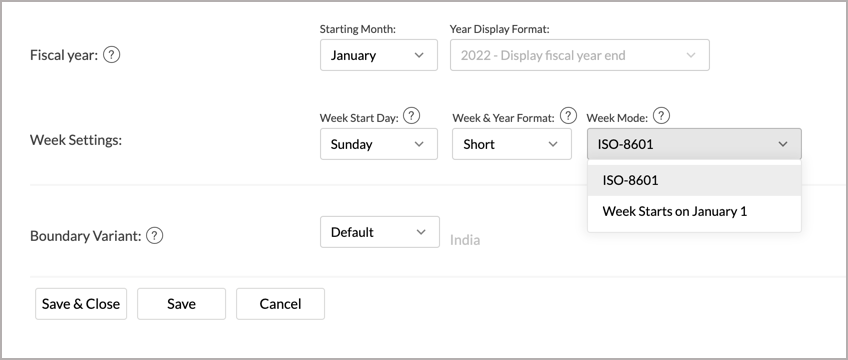
Yes, you can set the first week for your fiscal year using the Week Mode option.
The available options are:
- ISO 8601- The week with minimum of 4 days will be taken as the first week of the fiscal year.
- Week starts on Month 1 - The first day of the fiscal year will be taken as the first week of the Fiscal year.
9. Can I set the start Month of my fiscal Year?
Yes, you can specify the start month of your fiscal year using the Starting Month option.
By default, the starting month is set as January. You can choose to modify this to one of the following options:
- January
- February
- March
- April
- May
- June
- July
- August
- September
- October
- November
- December
The selected month will be used as the start month of the financial year. This will be used to compute the year while generating reports.
You can also specify the format to display your fiscal year format using the Year Display Format. To know more on this, refer to the below question.
10. How can I set the format to display the fiscal year in my reports?
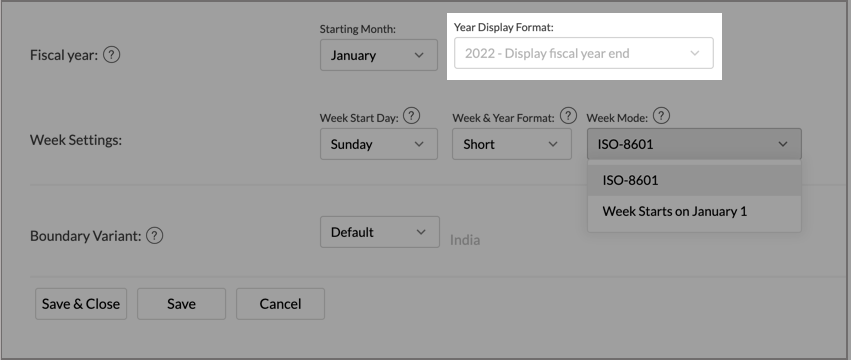
Yes, you can specify the format of your fiscal year format to be displayed in the reports using the Year Display Format. Available options are:
- Display fiscal year start - Displays the start year of the fiscal year e.g., the fiscal year of 2018-2019 will be displayed as 2018.
- Display fiscal year-end (default)- Displays the end year of the fiscal year e.g., the fiscal year of 2018-2019 will be displayed as 2019.
- Display year as range - Displays the range of years i.e., start to end year of the fiscal year e.g., the fiscal year of 2018-2019 will be displayed as 2018 -2019.
11. Can I specify the format to display week and year in my reports?
Yes, you can choose the format of week and year to be displayed in the reports using the Week and Year Format. Available options are:
- Long - Displays the start and end date of the week along with the year e.g., 01 - 07 Jan 2018
- Medium - Displays the week number as Week (N) along with the year e.g., Week 01 2018
- Short - Displays the week number as W(N) along with the year e.g., W01 2018
12. Can I view the resource usage of the Workspace?
Zoho Analytics allows you to view the resources used at a Workspace level using the Resources tab in the Settings page. This feature enables you to compare the resources used for that particular Workspace.
The Resources tab lists a summary of users, rows, query tables, email, and import schedules used in this Workspace.
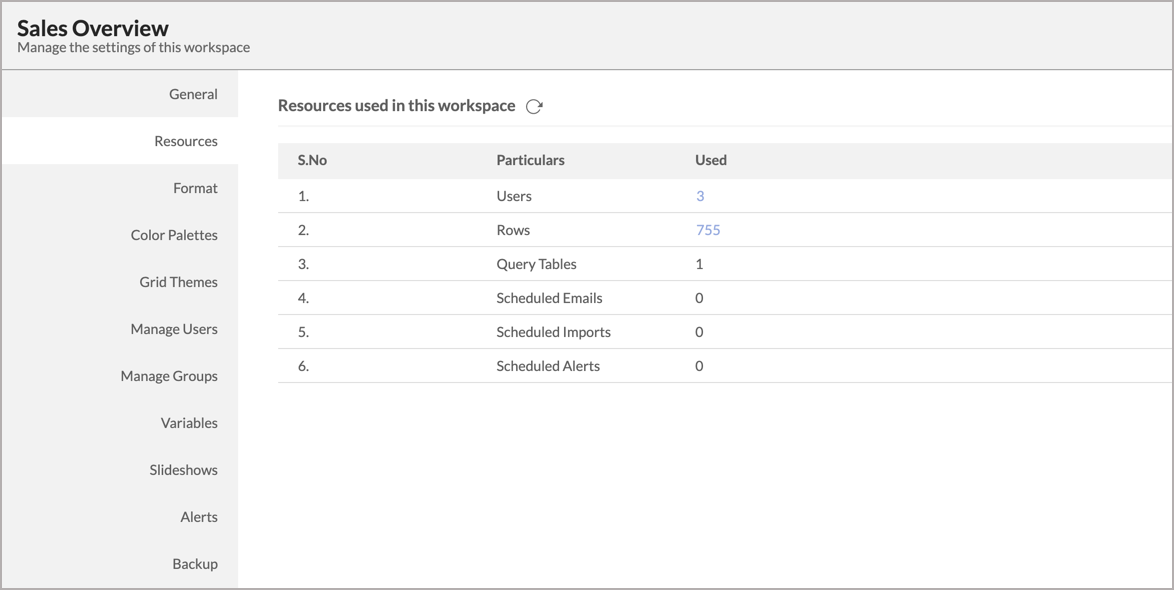
Clicking on the numbers under the Used column will display the exact details such as the email ids of the users, number of rows used by each of the tables in the Workspace etc., 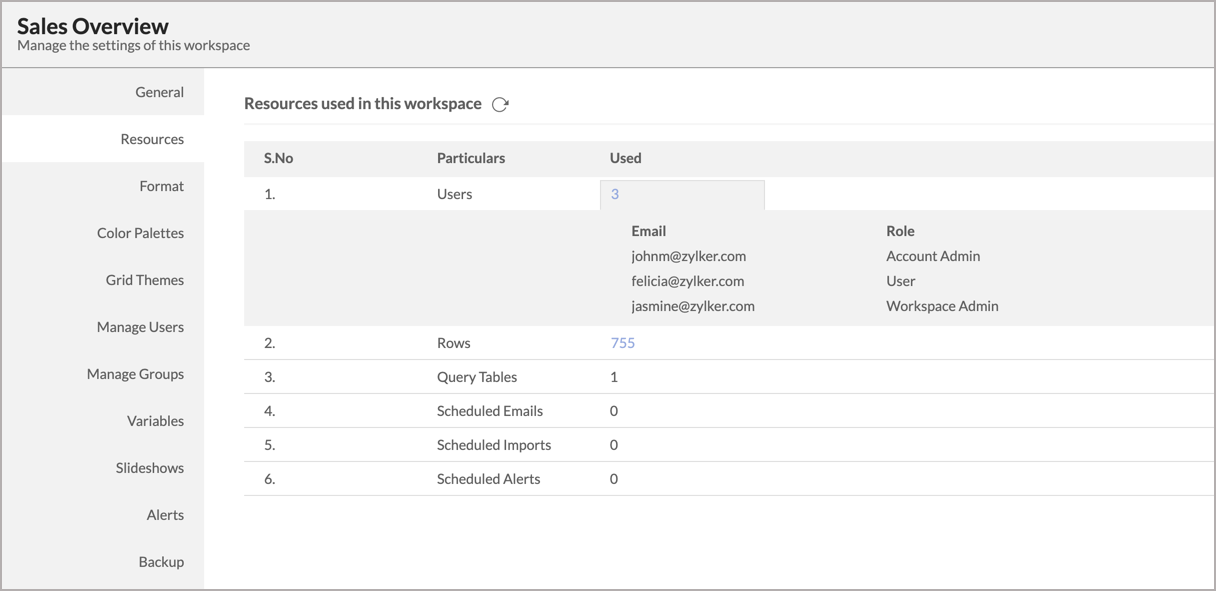
You can manage the resources used at the account level. To know more, click here.
13. What are Unused Views? Can removing unused views help optimize resource usage and improve workspace performance?
Zoho Analytics groups the views that have not been used in the last 60 days and lists them as Unused Views. You can find this list in the Workspace Settings under the Resources section.
This list allows you to quickly select the views that are no longer relevant for your business and remove them from the workspace, thereby enhancing the overall performance of your workspace and facilitating the judicious utilization of the computation resources.

Note: The last access time of the views in this list is refreshed once every one hour for reports and once every 24 hours in the case of tables.
Views that have active import schedules, email schedules, data alerts, or snapshot schedules will not be considered as unused.
14. How can I identify the unused views that have associated schedule configurations?
The unused views list highlights the views that have associated configurations with appropriate icons. This enables users to make an informed decision towards deleting the unused views in their workspace.
The list can also be filtered based on the schedule configurations associated with the views.

15. Can I define workspace-level formatting?
Yes, you can centrally format your data at a workspace level from the workspace Format Settings. This way you can maintain a consistent data format for all the tables available in the workspace.
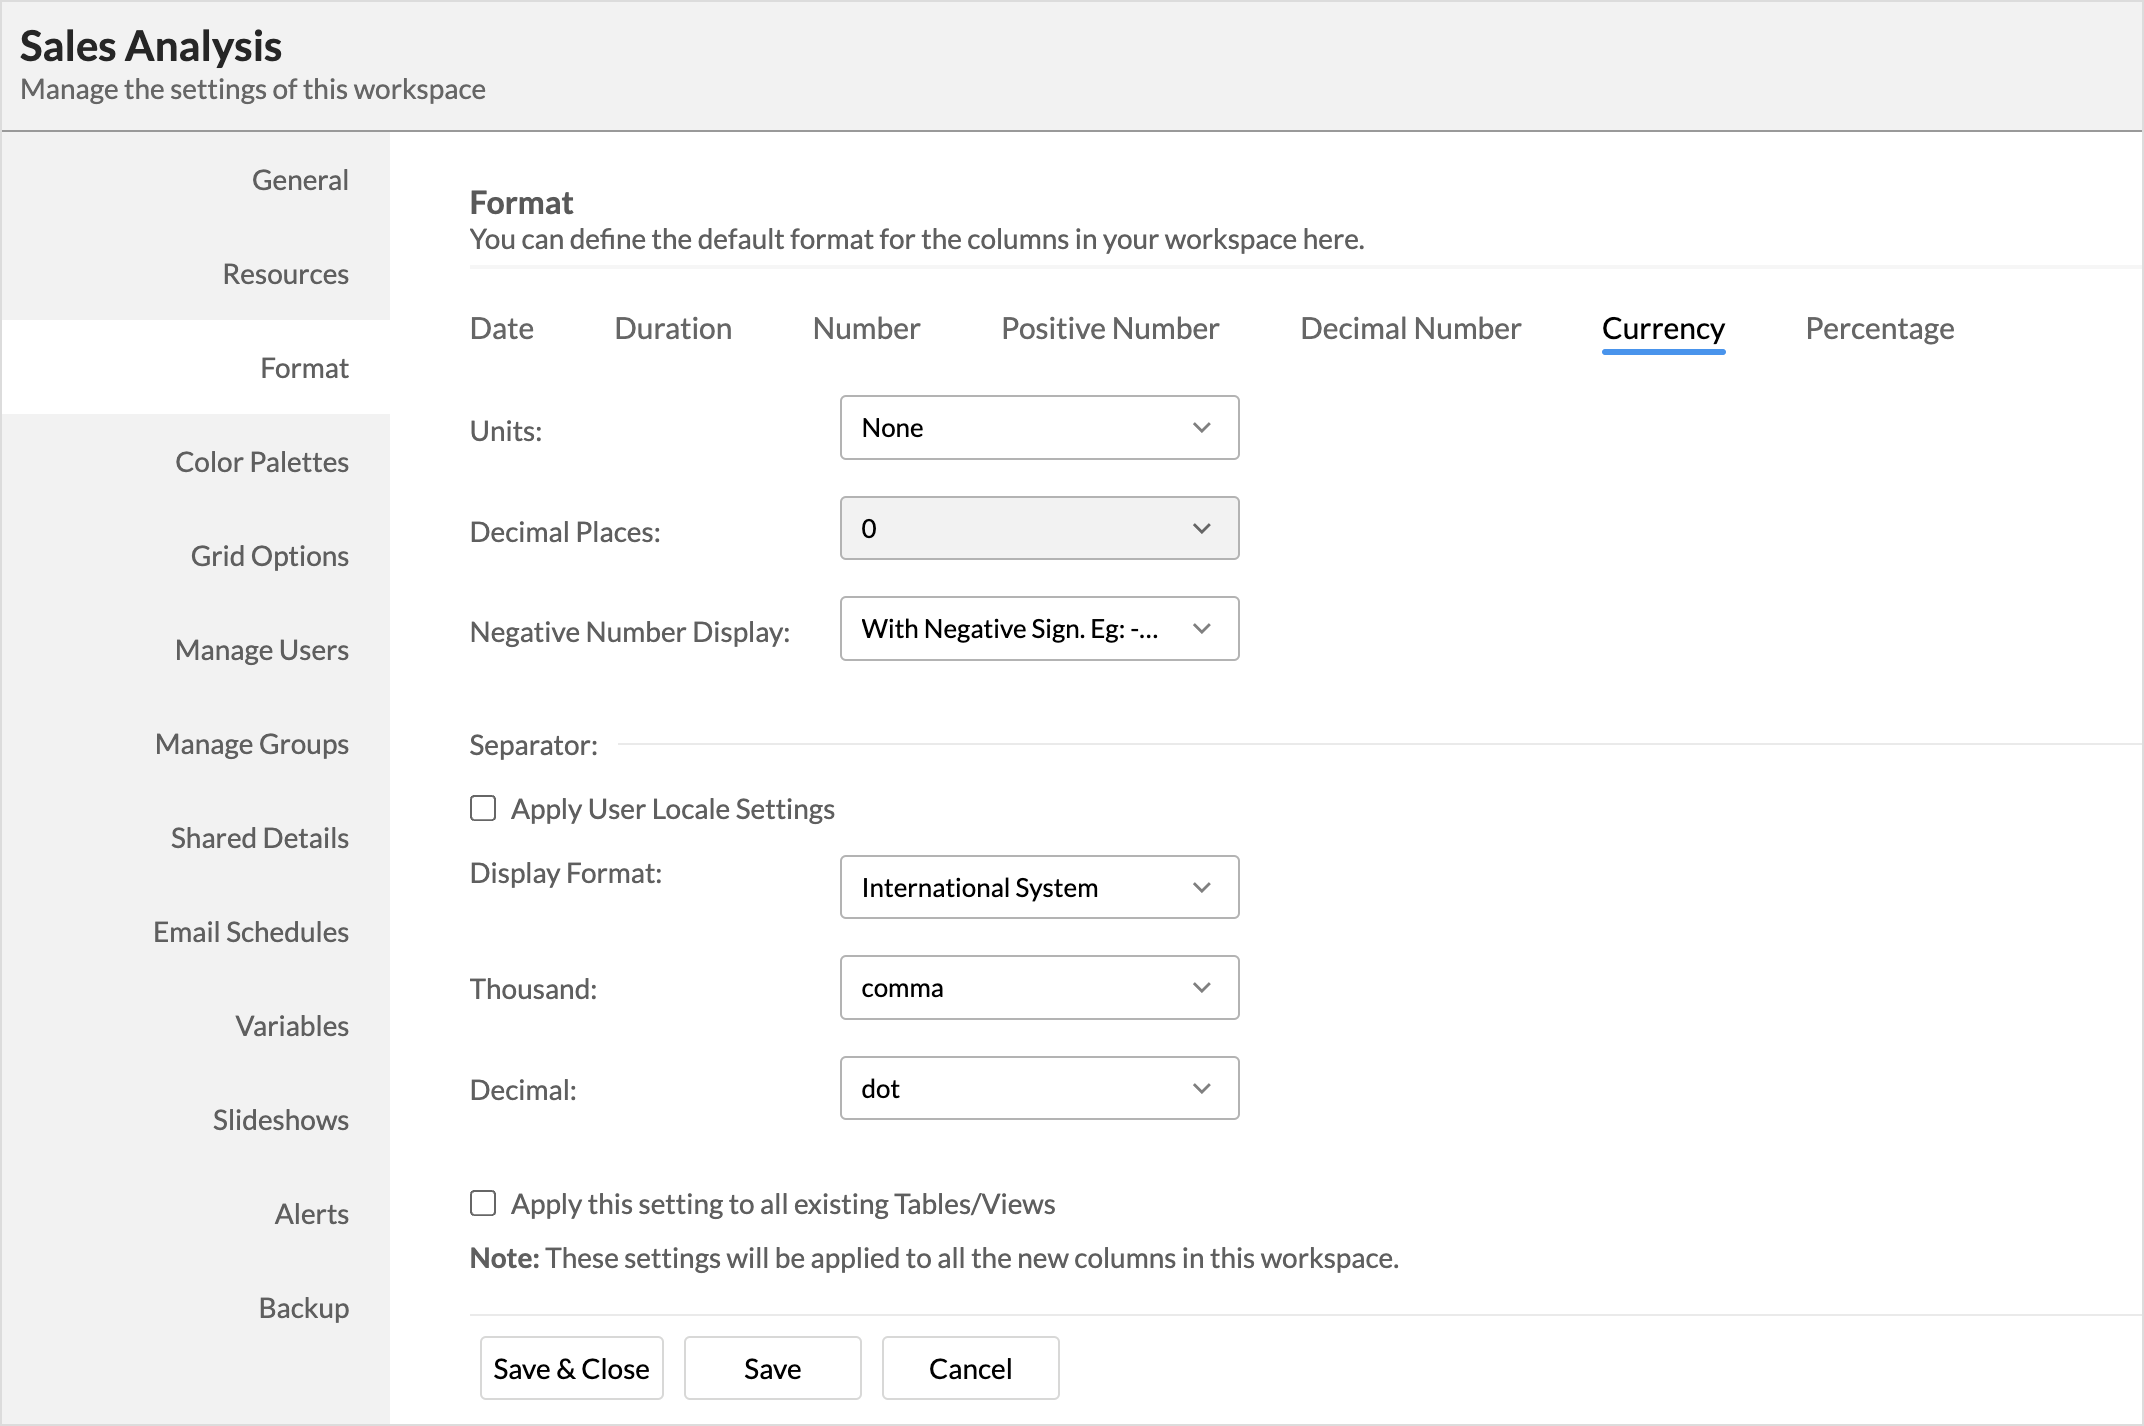
You can format Date, Duration, Number, Positive Number, Decimal Number, Currency and Percentage from the corresponding Format settings section.
Date Format
| OPTION | DESCRIPTION |
| Actual Value Format | This option allows you to pick the date format you want, for displaying dates values. You can Choose your date format from the existing list or specify a custom date format if the required format is not available as part of the default list provided. Refer here to know how to construct a custom date format string. |
| Seasonal/Cyclic Format | You can specify how you want the text in the date values to be displayed. It can either full text (Quarter 1) or a short text (Q 1) |
Duration Format
| OPTION | DESCRIPTION |
| Alignment | This option can be used to align the value in the cell horizontally. Possible values are Left, Right and Center. |
| Choose Duration Format | This option allows you to pick the duration format in which you want to display the duration format. Enter Your Duration Format: In case the required format is not available as part of the default list. You can enter the custom format in this field. Refer here to know how to construct a custom duration format string. |
Number, Positive Number, and Decimal Number
|
Units
|
This option enables you to format the unit value in thousands (K), millions (M) and billions (B).
|
| Decimal Places | You can use this option to set the number of decimal places to display for decimal numbers. This option is specific to decimal numbers. |
| Separator |
This section allows you to pick the decimal and thousand separators to be used and where to add them. Apply User Locale Settings - Select this option to use separators based on the locale settings of the user. For example, in US locale a comma will be used for a thousand separator and in case of German locale a dot will be used. The following options are used to specify the decimal and thousand separators to be used. These options will be disabled when you have selected the Apply User Locale Settings mentioned above.
Display Format - Select the format to place the thousand separators. Available options are:
|
Currency
|
Units
|
This option enables you to format the unit value in thousands (K), millions (M) and billions (B).
|
| Decimal Places | You can use this option to set the number of decimal places to display for decimal numbers. This option is specific to decimal numbers. |
| Negative Number Display | You can use this option to select the display format for negative numbers. Available options include Negative sign (Eg: -$23) and Parenthesis (Eg: ($23)). |
| Separator |
This section allows you to pick the decimal and thousand separators to be used and where to add them. Apply User Locale Settings - Select this option to use separators based on the locale settings of the user. For example, in US locale a comma will be used for a thousand separator and in case of German locale a dot will be used. The following options are used to specify the decimal and thousand separators to be used. These options will be disabled when you have selected the Apply User Locale Settings mentioned above.
Display Format - Select the format to place the thousand separators. Available options are:
|
Percentage
| Decimal Places | You can use this option to set the number of decimal places to display for percentage columns. |
|
Separator
|
This option allows you to pick a decimal and a thousand separators to be used. Apply User Locale Settings - You can select this option to use separators based on the locale settings of the user. For example, in US locale a comma will be used for a thousand separator and in case of German locale a dot will be used. Thousand - This option can be used to select the type of thousand separator. This option will be enabled for number and decimal type columns. This option will be disabled when you have chosen. Apply User Locale Settings mentioned above. Available options include: Comma, Dot, Space, and Single Quote Decimal - This option can be used to select the type of decimal separator. This option will be available only for decimal, currency, and percentage columns. Also, this option will be disabled when you have chosen. Apply User Locale Settings mentioned above. Available options include Dot and Comma. Show Percentage Symbol - You can use this option to display the percentage symbol for your percentage data columns. |
16. How can I apply the workspace level format settings over existing tables?
You can apply the Format settings to all existing tables in the Workspace by selecting the option Apply this setting to all existing Tables/Views. This will update all your view with the customized format. 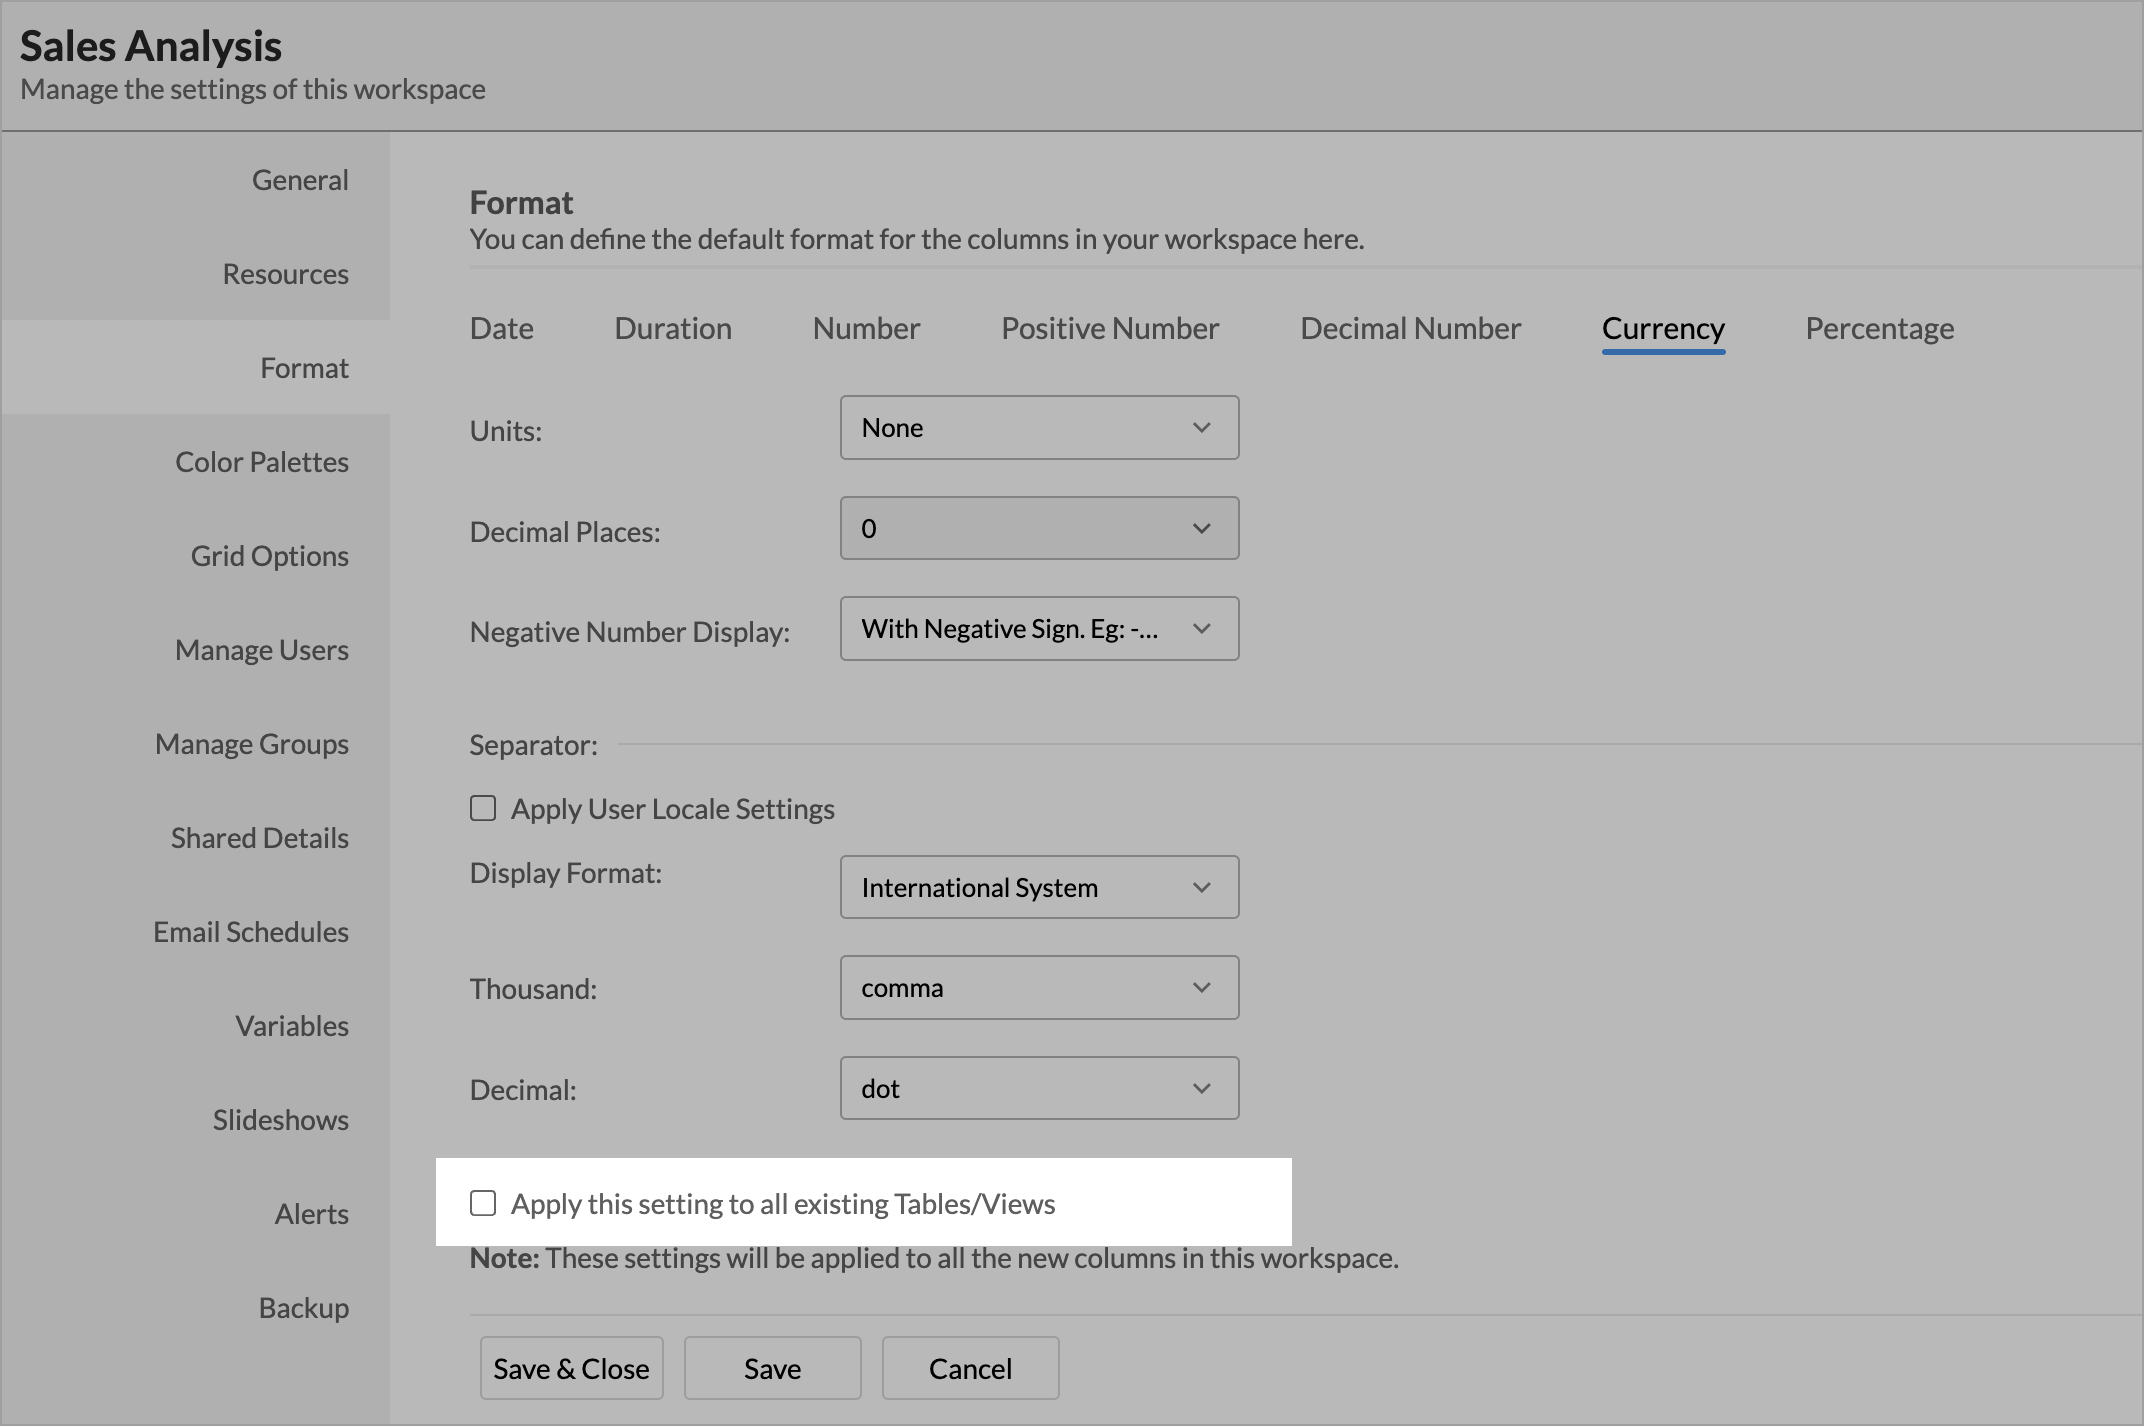
Note: This action is irreversible.
17. Can I set Chart Color Palettes for Charts across my Workspace?
Yes, Zoho Analytics does allow you to customize the chart color palettes to be applied over your Charts across the Workspace. When you create a chart, the colors applied over your data series are based on the Color Palatte you have set in the Workspace. You can set this using the Color Palette. Click here to know more about the Color Palette.
18. Can I set Grid Themes across my Workspace?
Yes, Zoho Analytics does allow you to apply the uniformed Grid Theme over the Pivot View, Summary View and Tabular views in the Workspace.
The Grid Theme allows you to customize the look and feel of your Pivot, Summary and Tabular views using colorful and attractive themes. You can customize the themes to suit your taste. The themes that you have set in the Grid Theme tab will be applied over all the view your workspace.
19. How can I customize a Grid Theme?
Zoho Analytics provides various options to customize the themes. Follow the below steps to customise a Grid Theme for a Pivot Table:
- Open the Grid Themes tab in the Settings page.
- Select the Pivot tab.
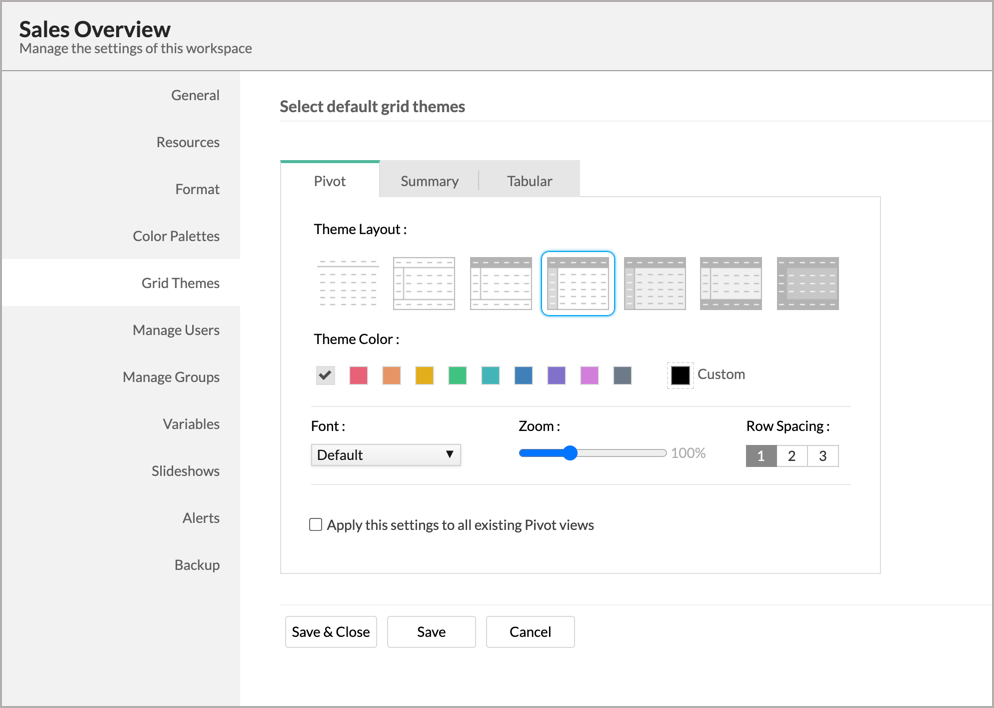
- Select the Theme Layout from the available set of seven layouts.
- Select the Theme Color that you wish to apply.
- Select the Font for the text in your Pivot.
- You can Zoom in or Zoom out using the Zoom option. This will increase or decrease the size of your Pivot Table.
- You can alter the Row spacing using the three predefined options.
- If you want to reset the theme to the default theme click the Reset to System Default option.
- Click Save. The theme will be applied over the new Pivot View that you create in this Workspace.
You can similarly apply Grid Themes to Summary and Tabular views by selecting the appropriate tabs.
20. How can I apply the customized Grid Theme over existing Pivot, Summary or Tabular Views?
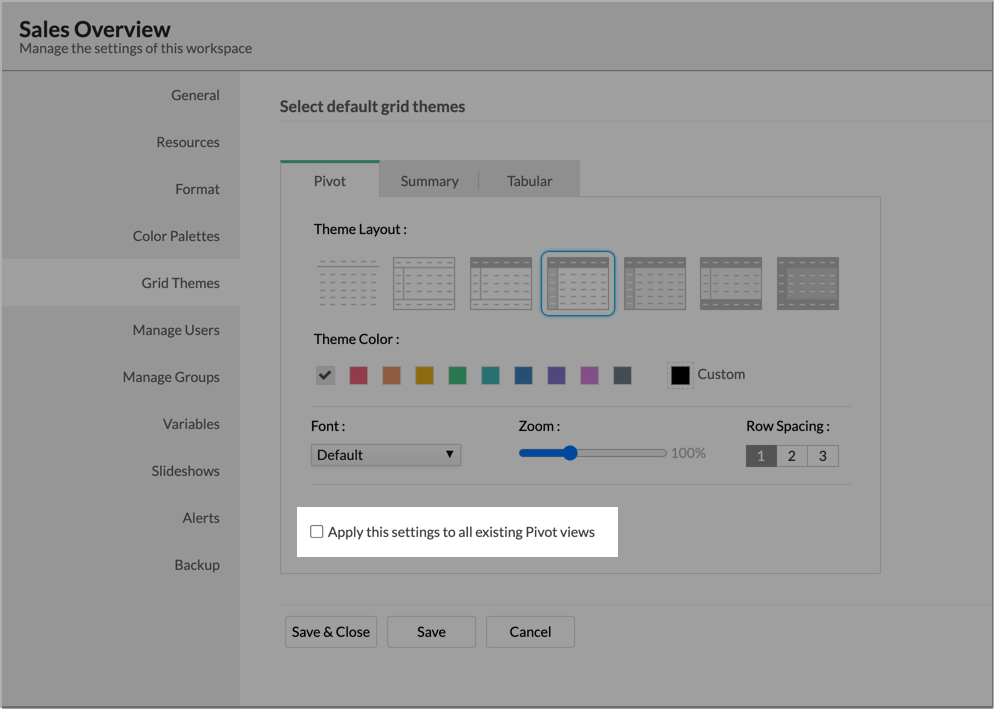
You can apply this palette to all existing Pivot, Summary or Tabular Views by selecting the option Apply this setting to all existing Pivot views. This will update all your view with the customised Grid Theme.
Note: This action is irreversible.
21. How do I manage all the Email schedules in the Workspace?
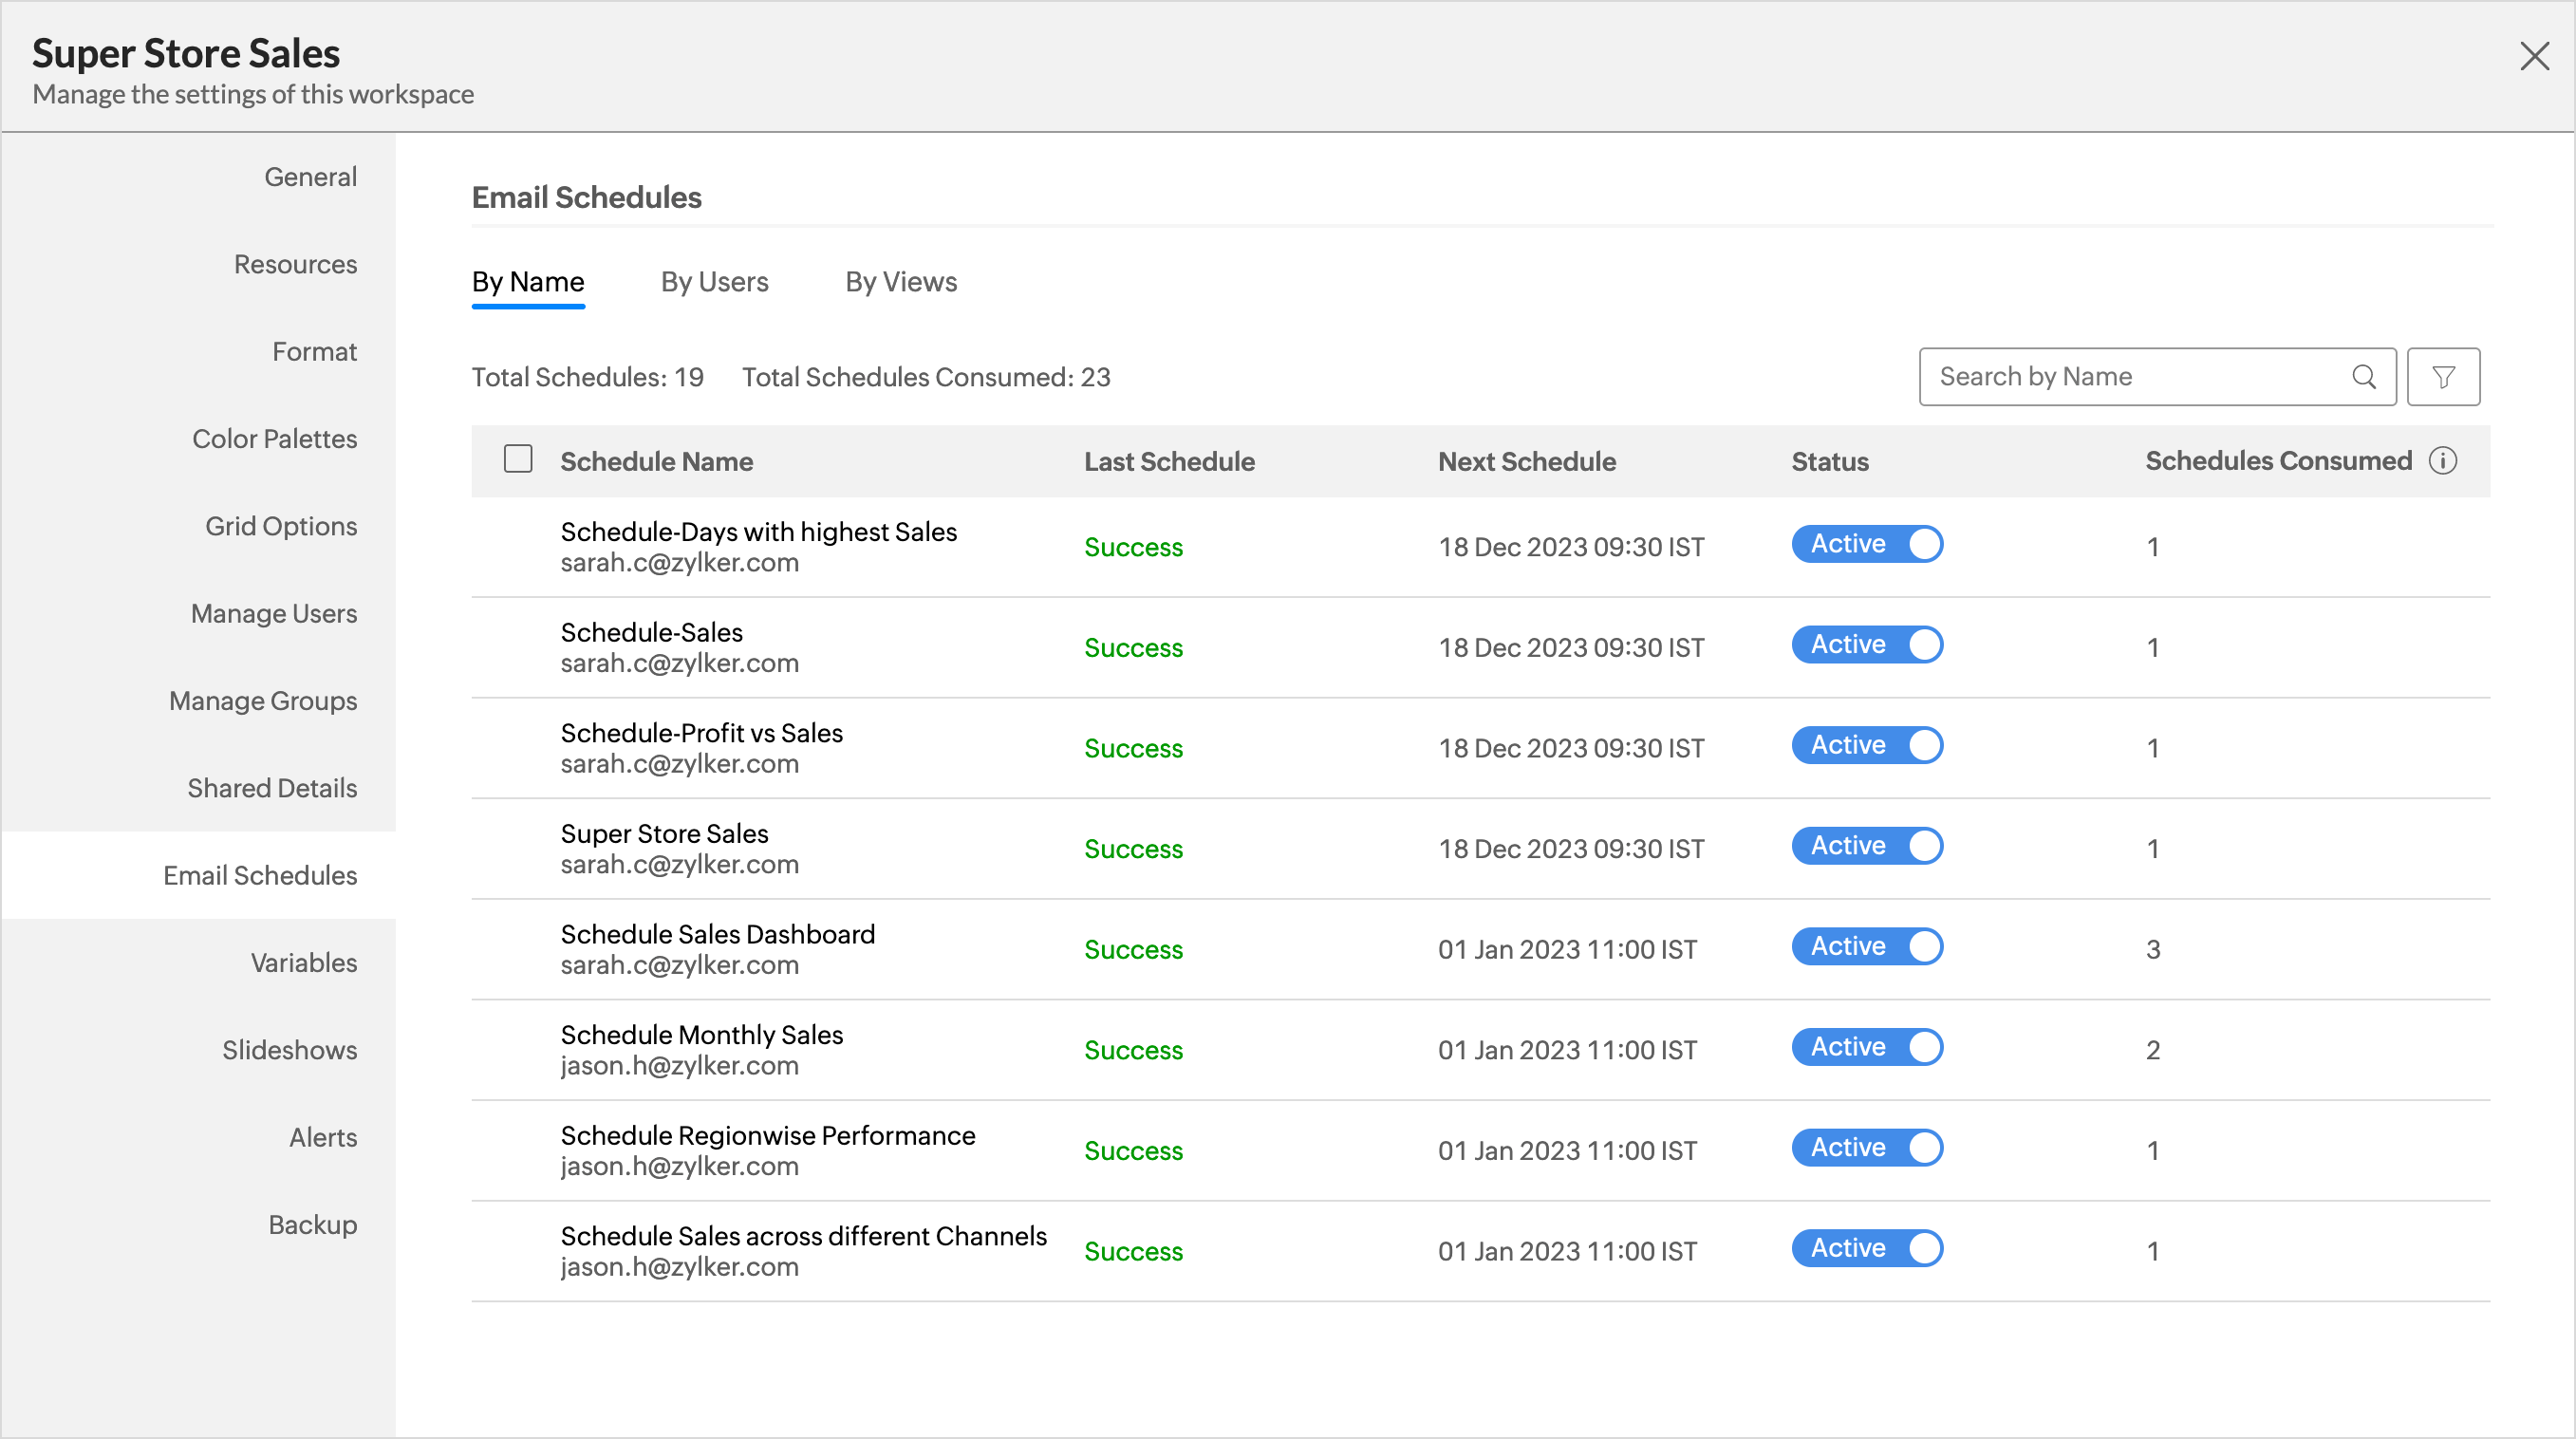
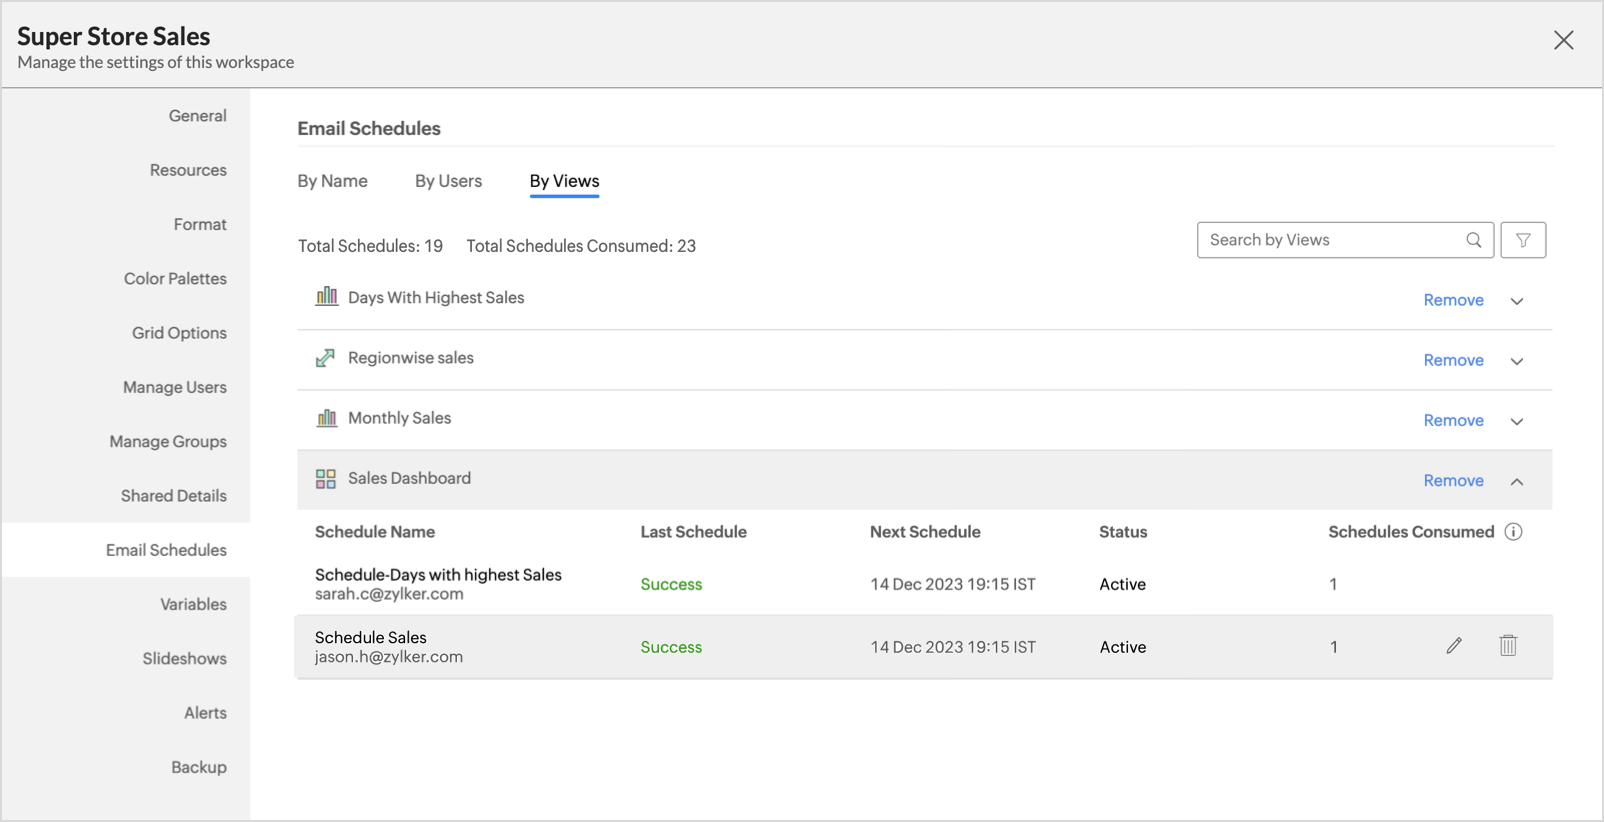
The Email Schedule section in the Workspace Settings page allows you to efficiently manage all the email schedules within your workspace. Email schedules are organized into three distinct groupings to streamline the management process as follows:
You can also create and manage email schedules at the view level. Click here to learn more.
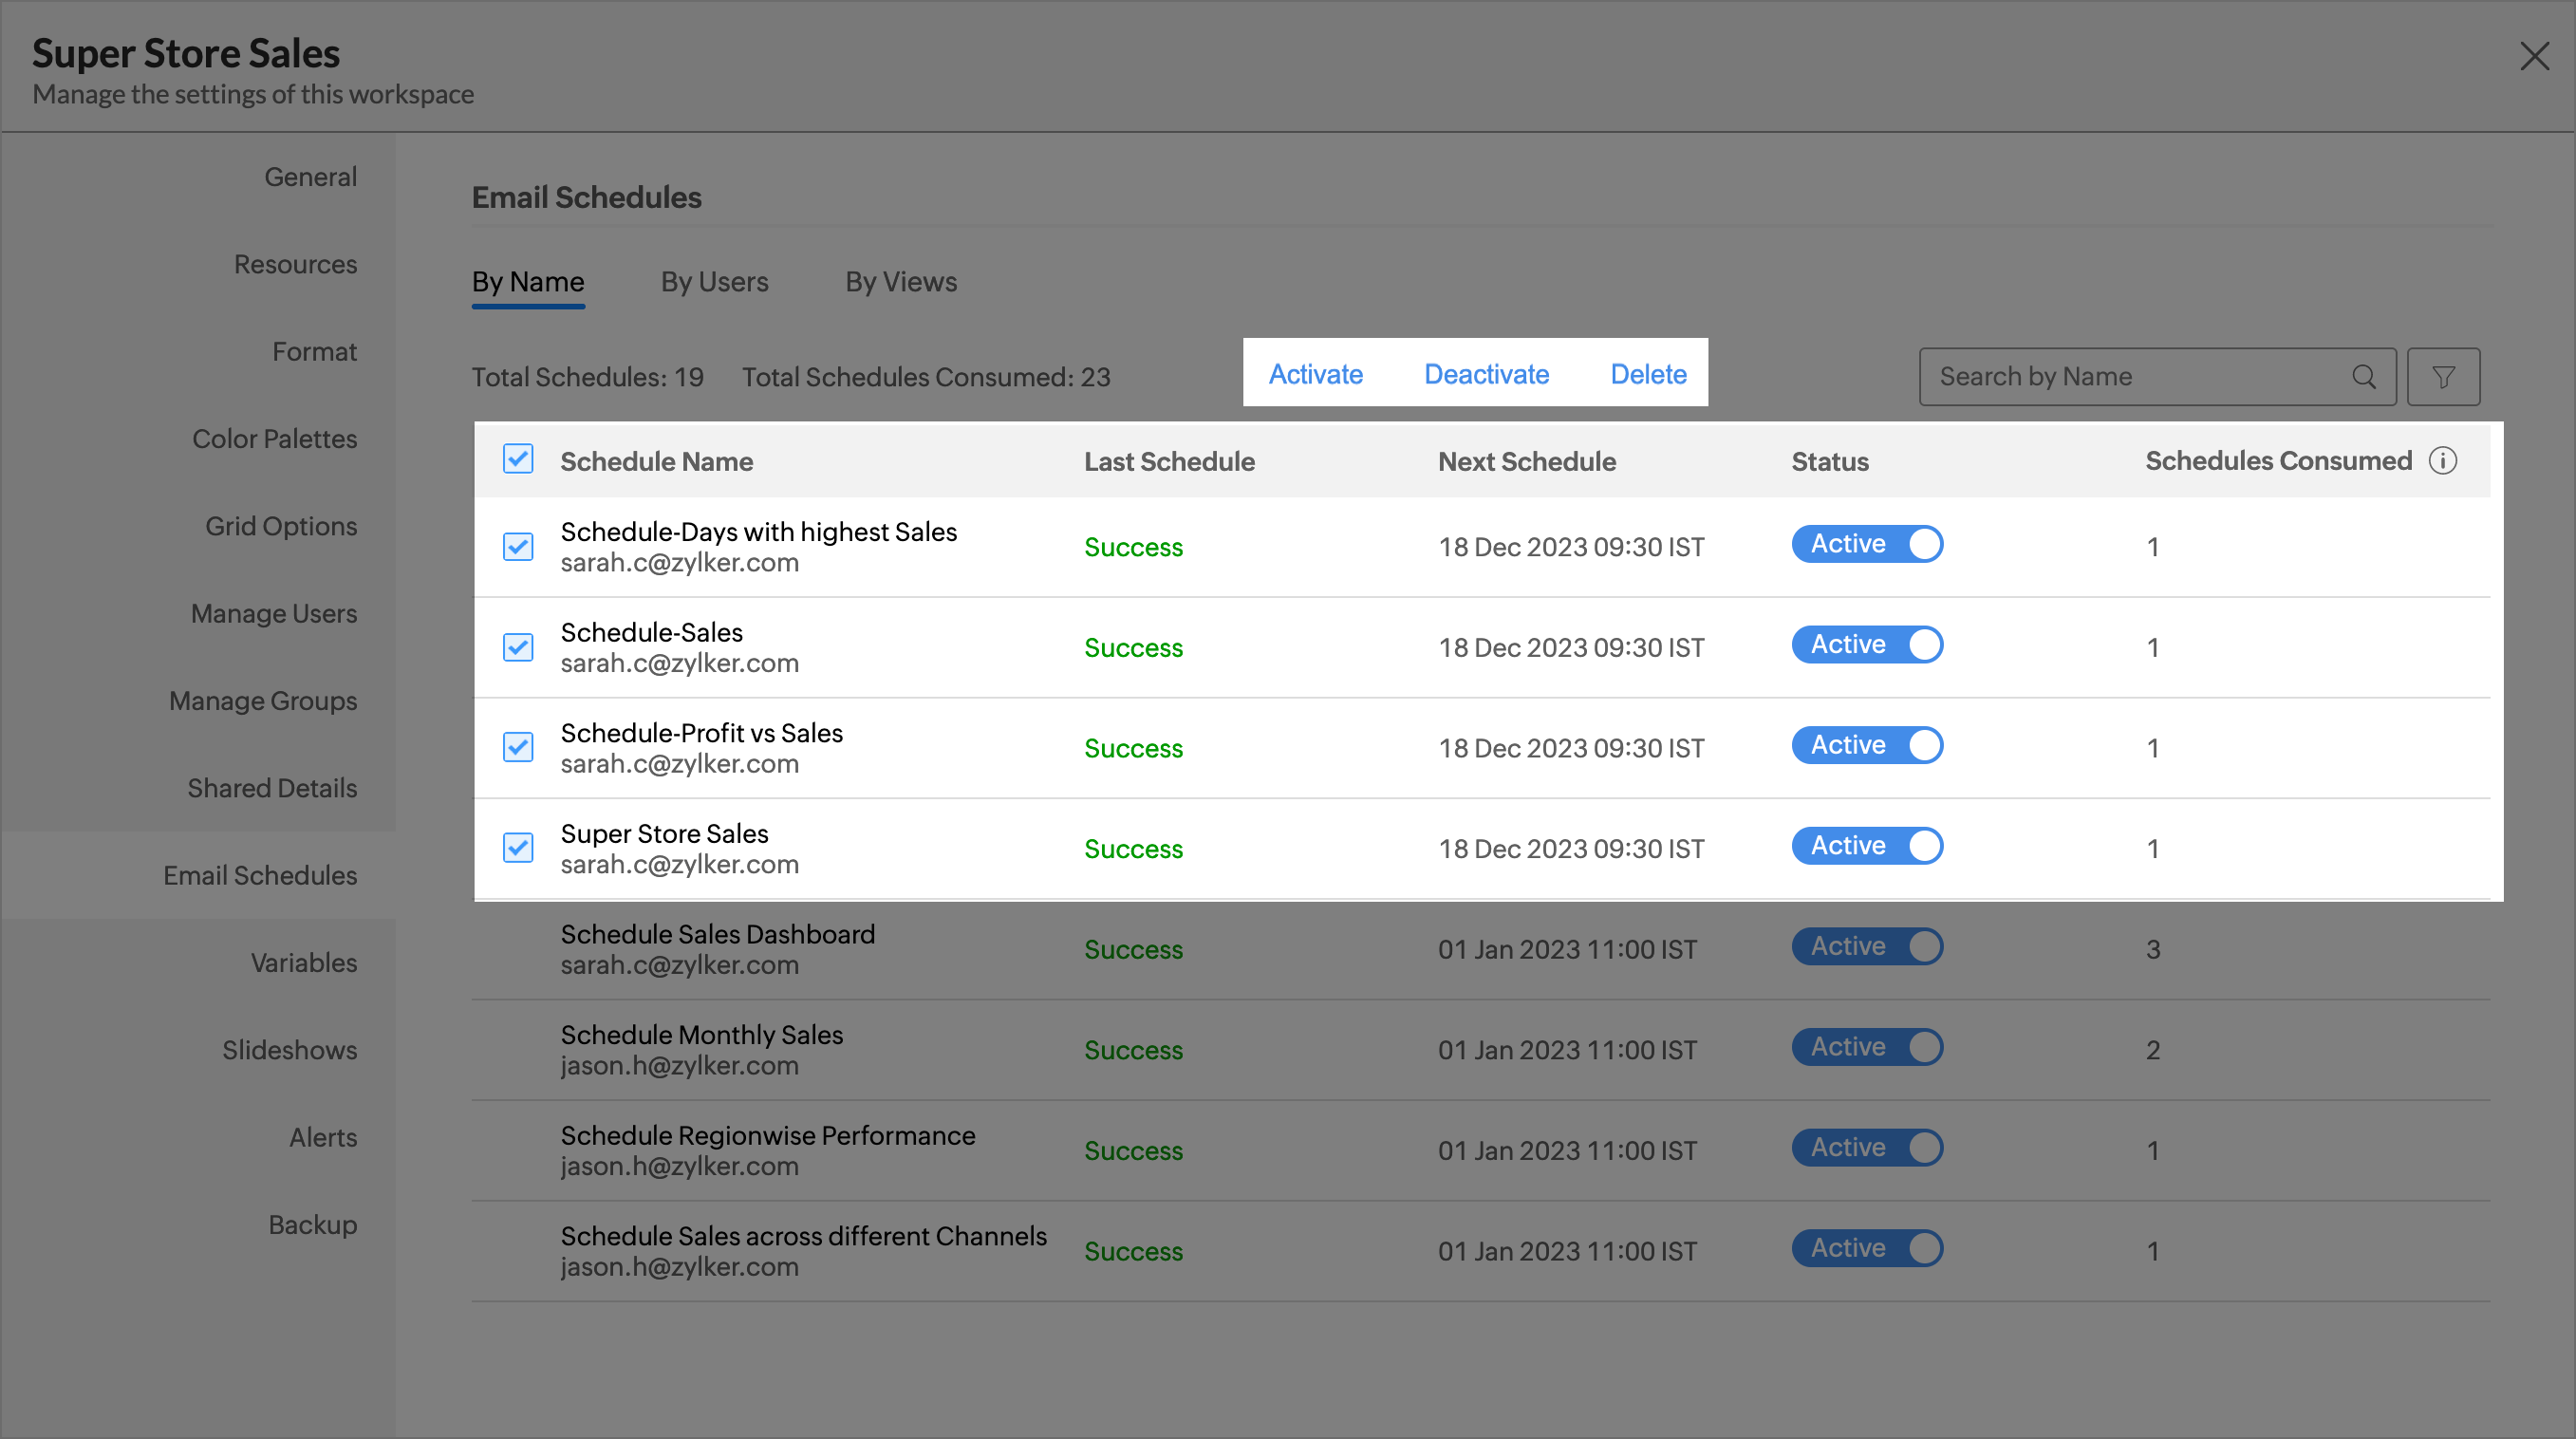
By Name
This section provides a comprehensive list of all email schedules created within this workspace. Each schedule is accompanied by essential details, such as the users it is scheduled for, the associated views, the last schedule status, and the next scheduled time. You can also check the total schedules consumed in this workspace and by each view.
- Click any Schedule Name to view the detailed schedule information, including the list of users and views associated.
- Toggle the Active button to activate or deactivate a email schedule.
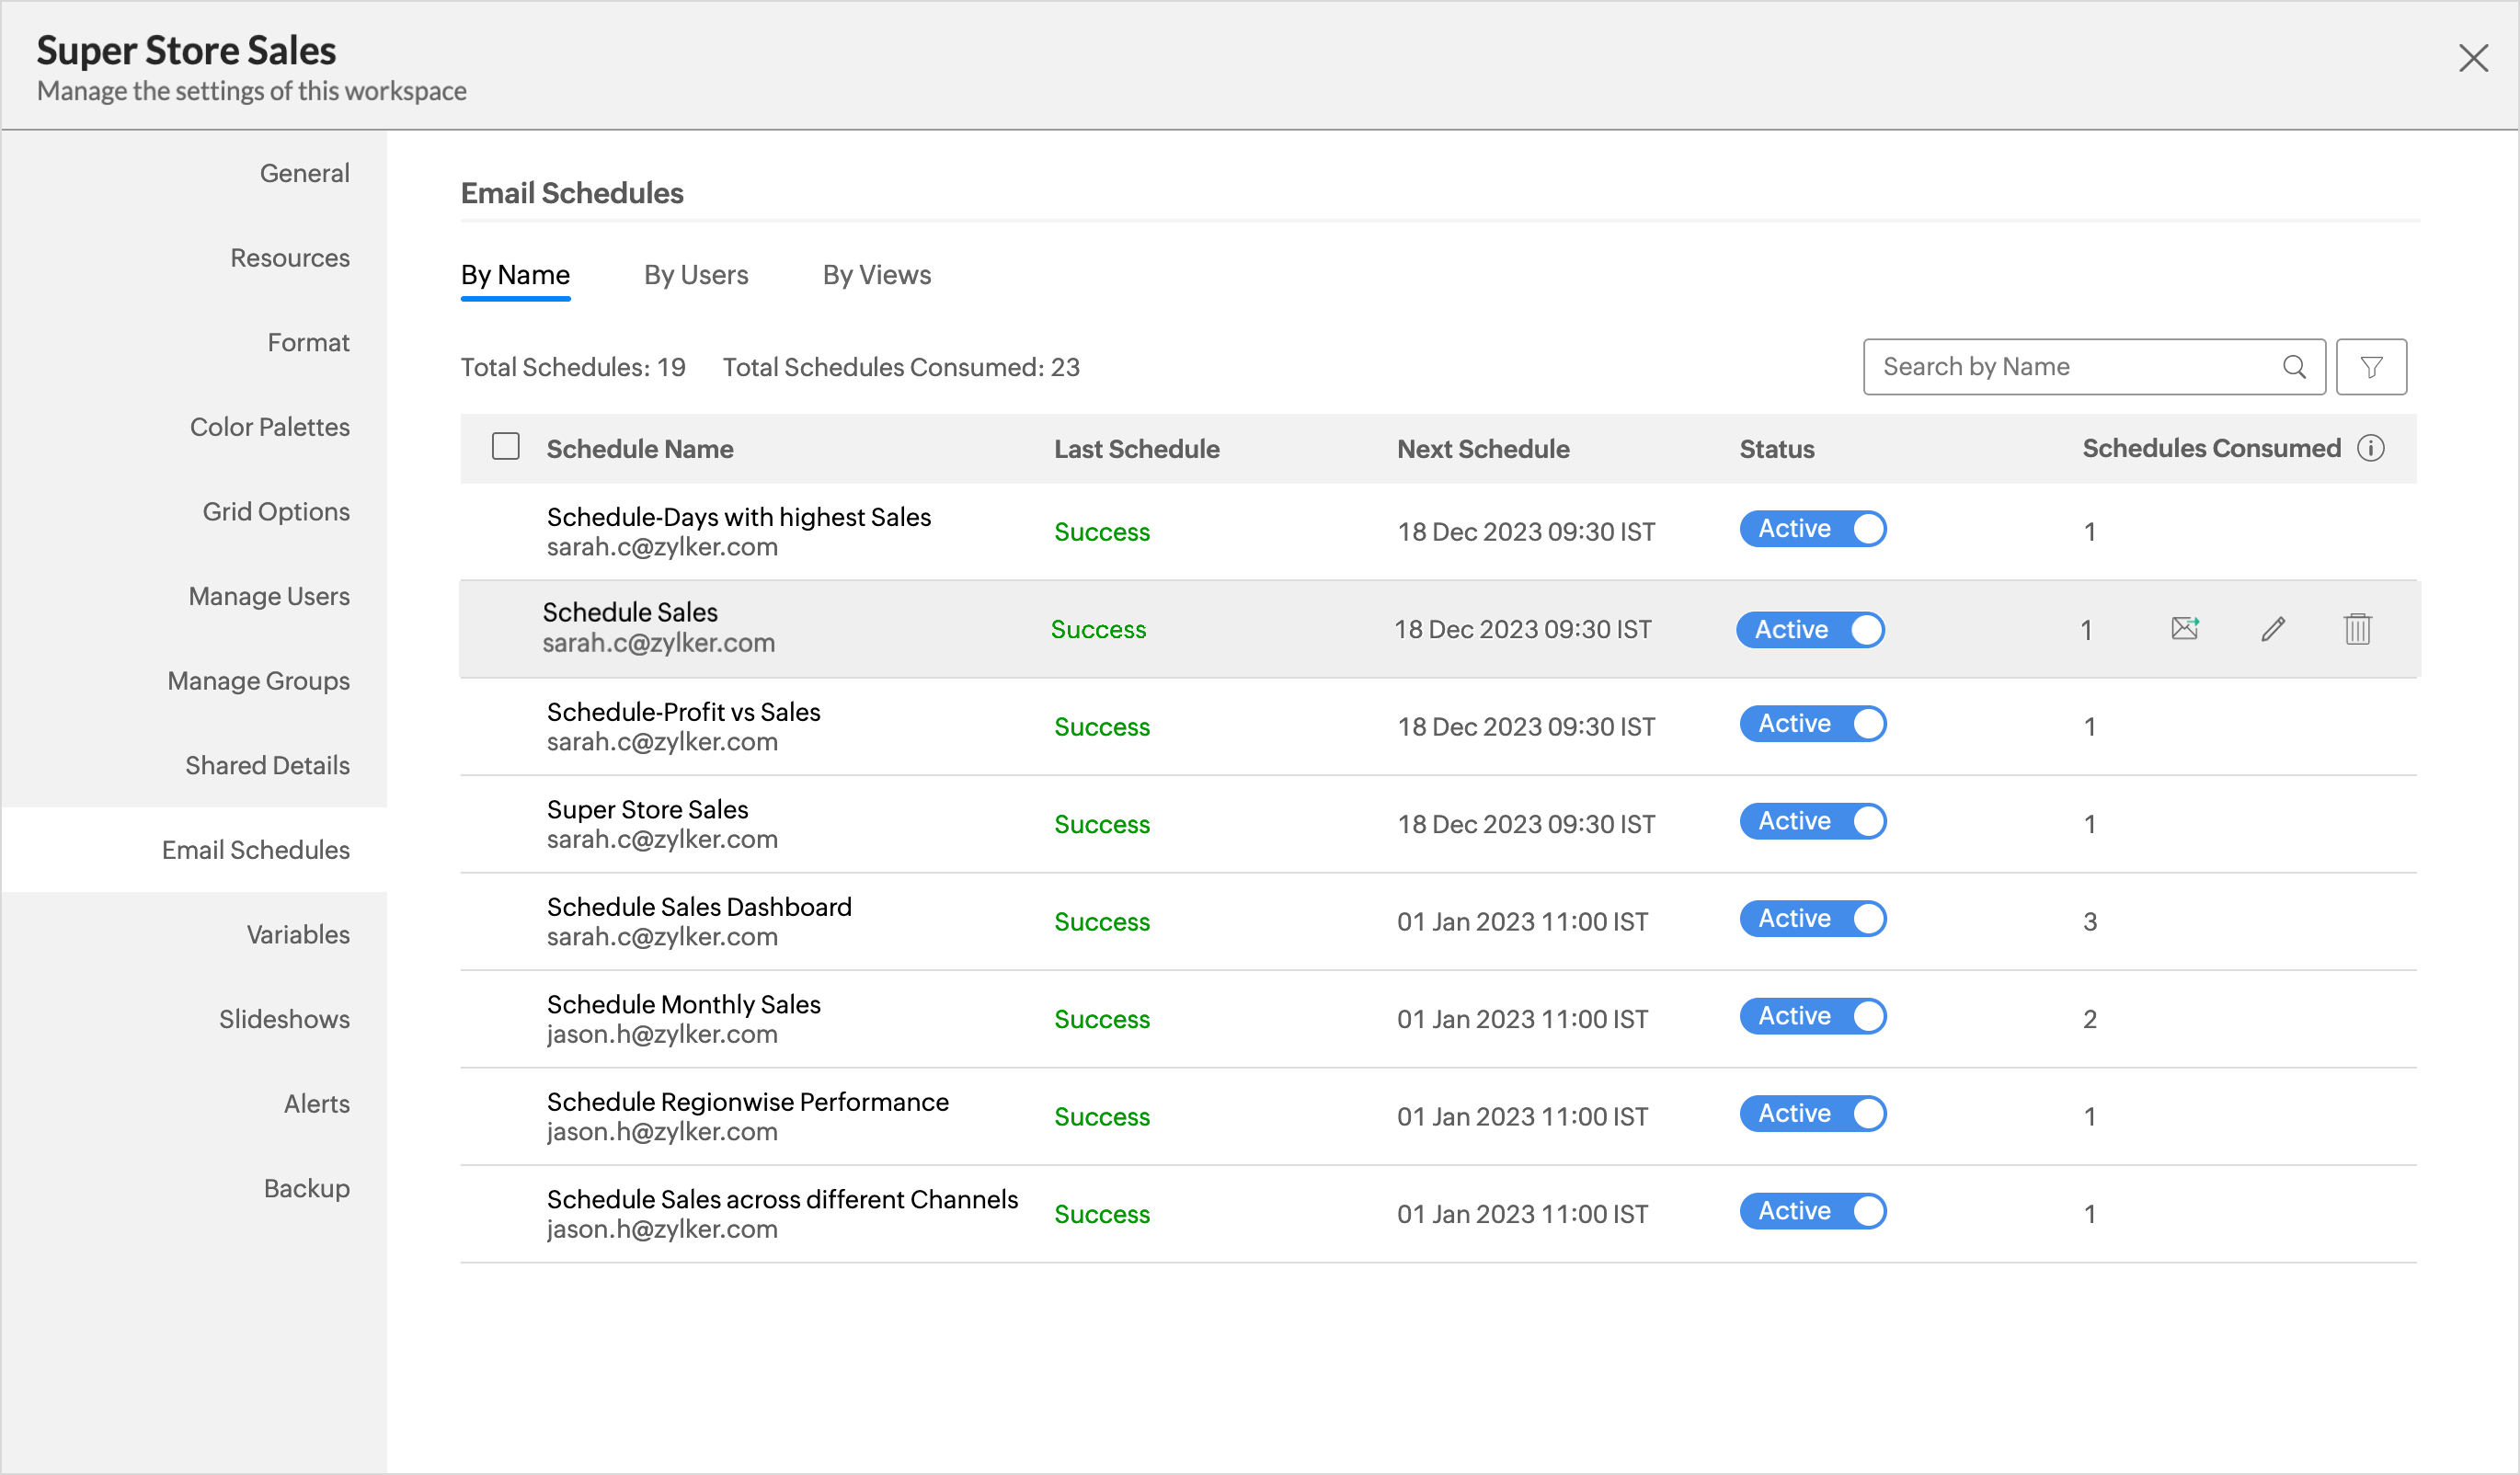
- Hover at the end of the schedule name to explore options such as Send Now, Edit and Delete.
- Send Now - Click this to send the email as specified in the email schedule instantly.
- Edit - Click this to edit the email schedule. The Email As dialog will open, and you can make changes to the email schedule and save it.
- Delete - Click this to delete the selected email schedule.
- You can also select multiple schedules simultaneously and choose to Activate or Deactivate them. You can also delete multiple schedules in the same way.
By Users
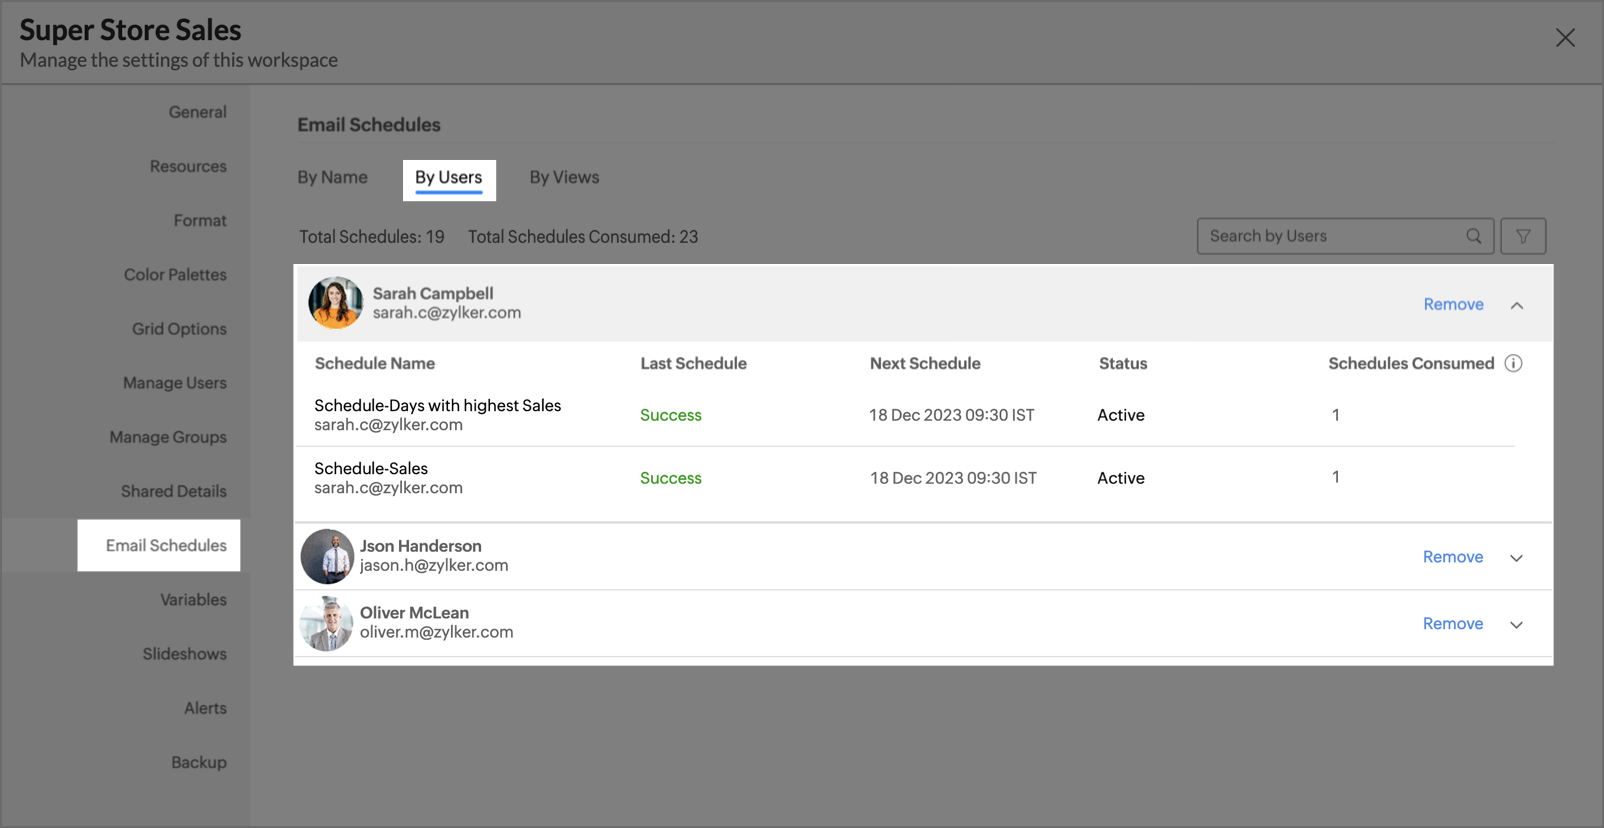
This section provides a user-centric view, showcasing a list of users to whom emails are scheduled.
- Click any user name to open a dropdown displaying all schedules associated with the selected user.
- To remove all the email schedules associated with a user, click Remove at the end of the user's name.
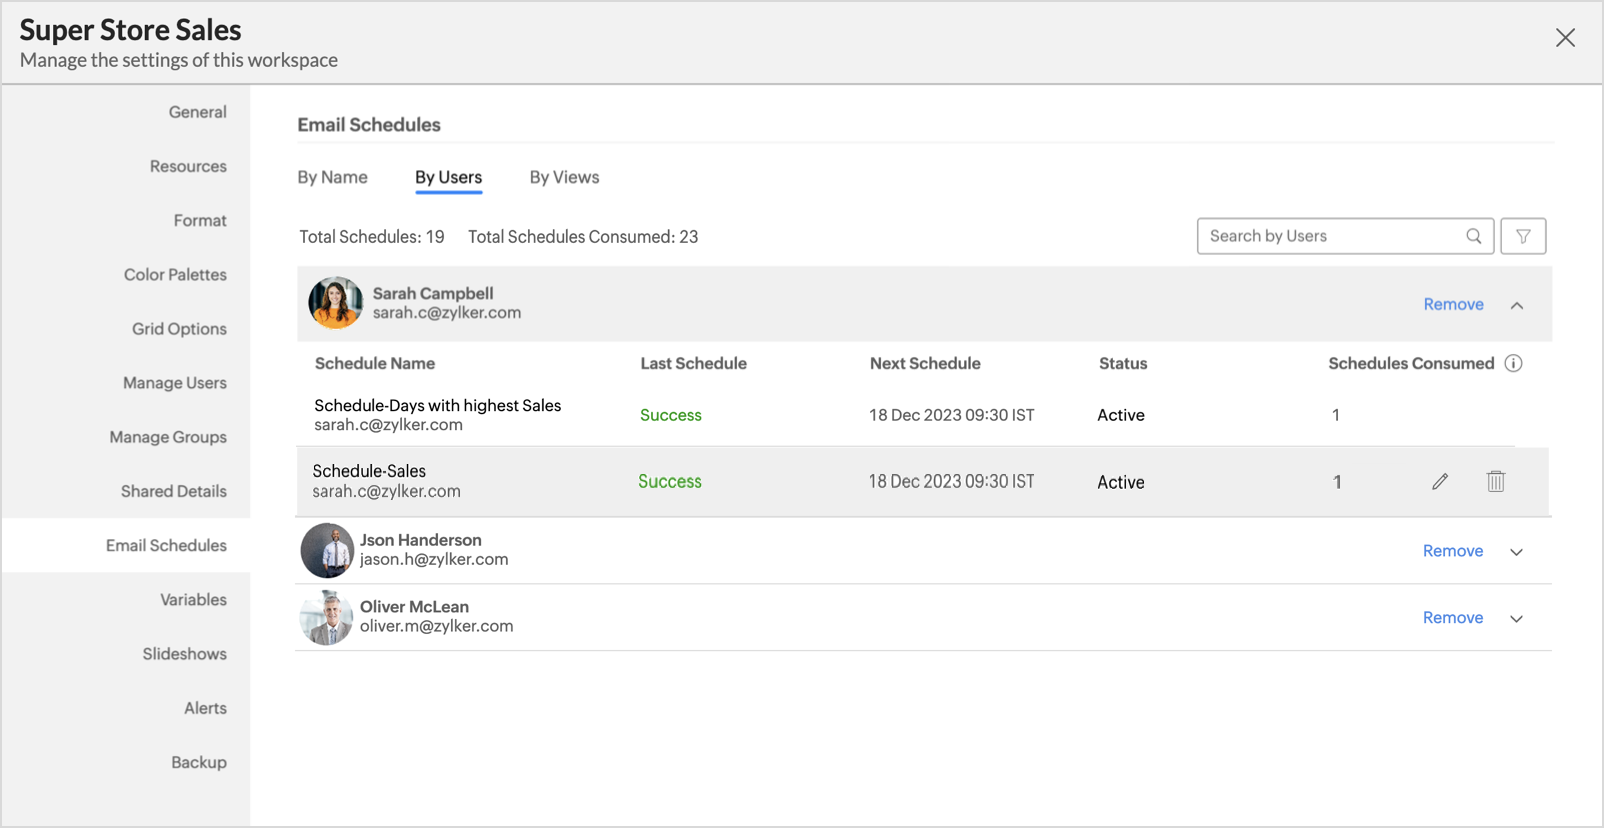
- Hover at the end of the schedule name to explore the Edit and Delete options.
- Edit - The Email schedule dialog will open and you can make changes to the email schedule and save it.
- Delete - Remove the user from the selected email schedule.
By Views
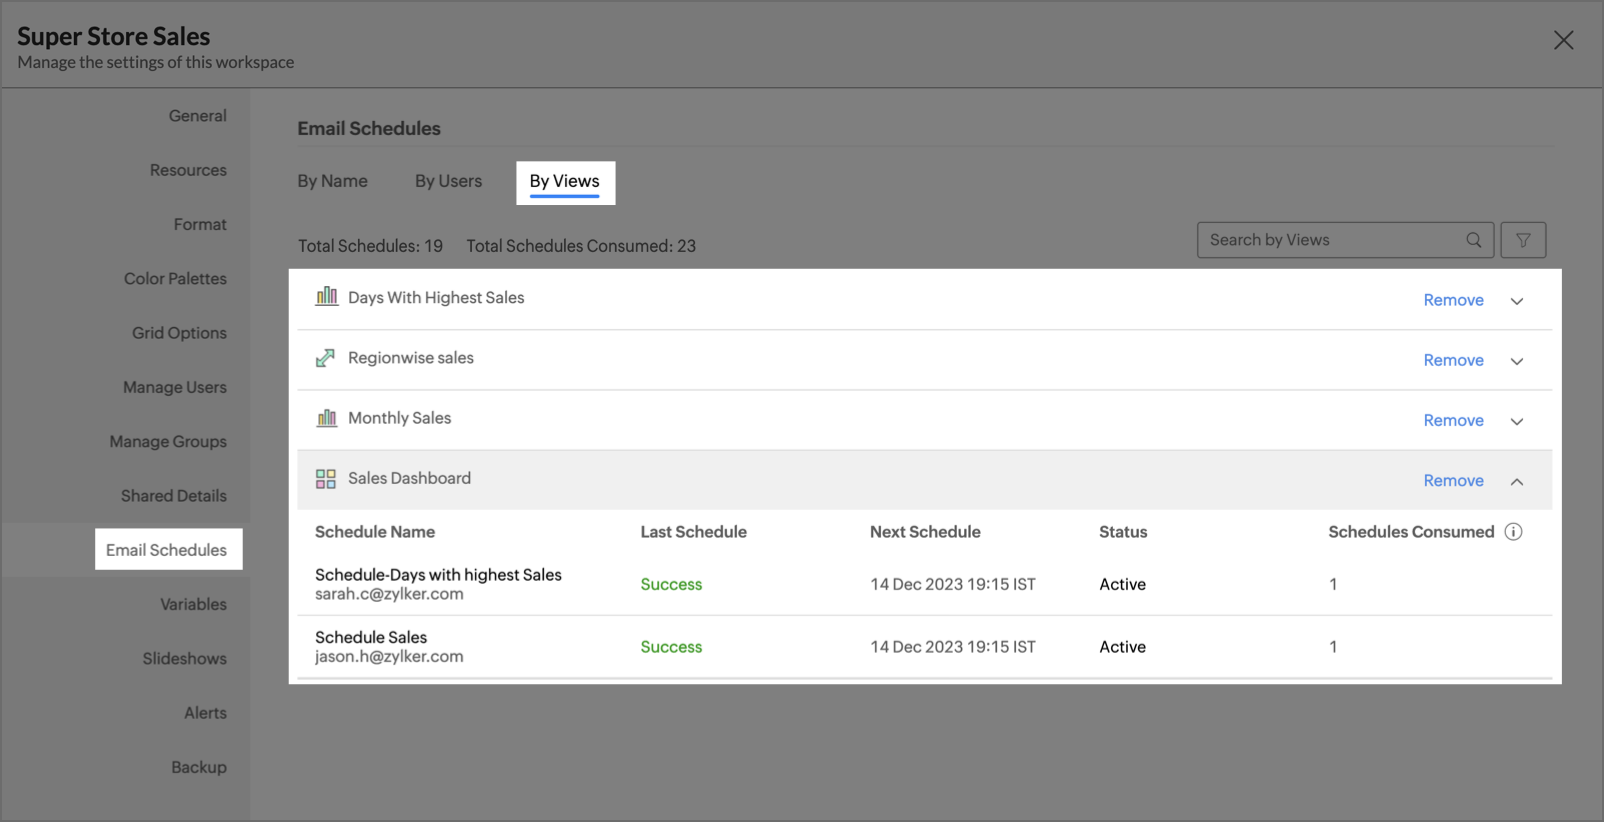
This section provides a list of views for which emails are scheduled.
- Click on any view to open a dropdown displaying all schedules associated with the selected view.
- To remove all email schedules associated with a View, click Remove at the end of the view's name.
- Hover at the end of the schedule name to explore the Edit and Delete options.
- Edit - The Email schedule dialog will open, and you can make changes to the email schedule and save it.
- Delete - Remove the view from the selected email schedule.
22. How do I manage all Users in the Workspace?
Zoho Analytics allows you to manage all user in your workspace from a single page for easy access. The Manage Users tab allows you to effectively manage the users in the Workspace. You can view, edit, add, delete and deactivate users from this page. Click here to know more on Managing Workspace Users.
23. What are Variables in Zoho Analytics?
Variables are placeholders that help you assign dynamic values for various operations. This enables you to filter the reports for each user dynamically. You can also create an aggregate formula with dynamic input using Variables. Read more.
24. How do I Manage all Slideshows in my Workspace?
Zoho Analytics allows you to manage all the slideshows in your workspace from a single page for easy access. Click here to learn more on Slideshow.
25. Can I backup data from my Workspace?
Zoho Analytics allows you to back up the data available in your Workspace. Workspace Backup option will backup the data from tables and SQL queries from query tables and make it available for download. The reports and dashboards are not backed up. You can use this feature if you want to have a local copy of your data.
Note:
- Zoho Analytics runs on redundant network devices to avoid any single point of failure at any level on the internal network.
- User data is backed-up periodically across multiple servers, helping protect the data in the event of hardware failure or disaster. Hence, your data will remain safe on our servers. In the case of any unforced system issues, we would help you to restore your data from our end. Click to know more.
- This Backup feature is recommended to be used only if you want to have an archive of your data.
26. How do I backup data in my Workspace?
You can back data from Workspace from the Backup tab in the Settings page. Follow the below steps to do so.
- Open the Backup tab in the Settings page.
- Set the Backup Enabled option to Yes.
- You can choose to schedule your backup in a periodic interval. Specify the interval to backup your data in the Repeat. Available options are:
- Not Scheduled
- Everyday
- Weekly Once
- Monthly Once
- In case of scheduling, you need to specify the interval for backup. Specify the time to backup the data in GMT timezone.
- For Weekly and Monthly schedule specify the day or date for backup data.
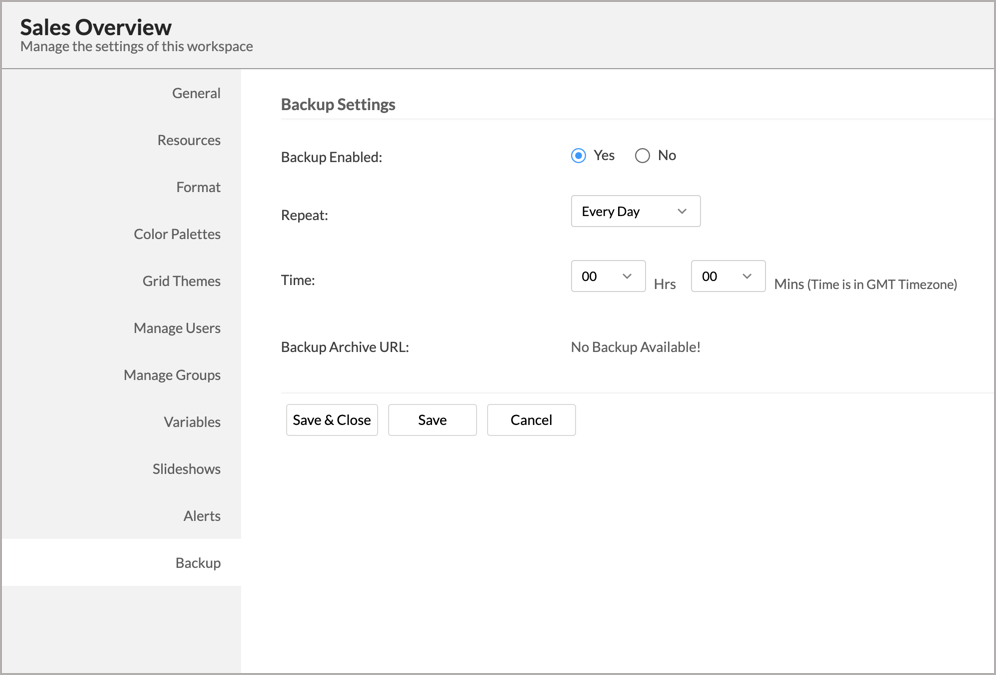
- Once the data is backed up, you can download the backup file by clicking the date link next to the Backup-Archive URL.
The last 3 versions of the backed up data will be available for download. The latest file will be at the same URL/link, thereby making it easy for you to bookmark or download. Older versions will be deleted.
The backups can also be configured at the account level. To know more, click here.