Advanced Analytics for Salesforce CRM
The Zoho Analytics connector for Salesforce CRM allows you to easily analyze your Salesforce CRM data in detail and derive useful insights on your sales data. Its intuitive drag-and-drop interface allows you to easily create reports and dashboards. Sales and Marketing personnel can slice and dice their CRM data and take informed business decisions.
The Advanced Analytics for Salesforce CRM includes a set of prebuilt reports and dashboards over your Salesforce CRM data that help you to jump-start your analytics right away.
How to set up the Salesforce CRM integration with Zoho Analytics?
A user with administrator privileges (Account Admin and Organization Admin) can configure the integration. The user must also have read permission for the required modules in Salesforce CRM.
Zoho Analytics uses your own Salesforce credentials (Client ID and Client Secret) to authenticate the integration. You must create an external client app in Salesforce to generate these credentials before you can complete the setup.
Prerequisite: Create an external client app in Salesforce
To generate the Client ID and Client Secret, create an external client app in your Salesforce account. You will need the redirect URL from the Zoho Analytics import setup page (refer to step 4 in the setup procedure below) to complete this configuration.
- Log in to your Salesforce account.
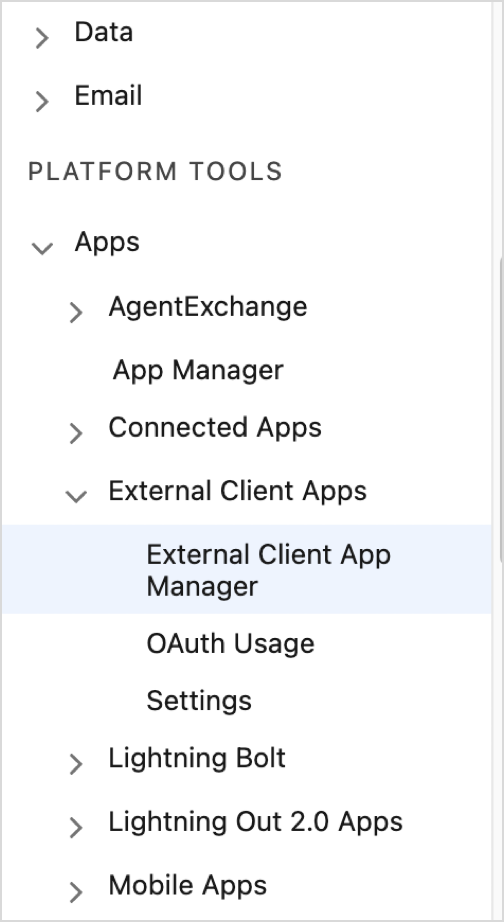
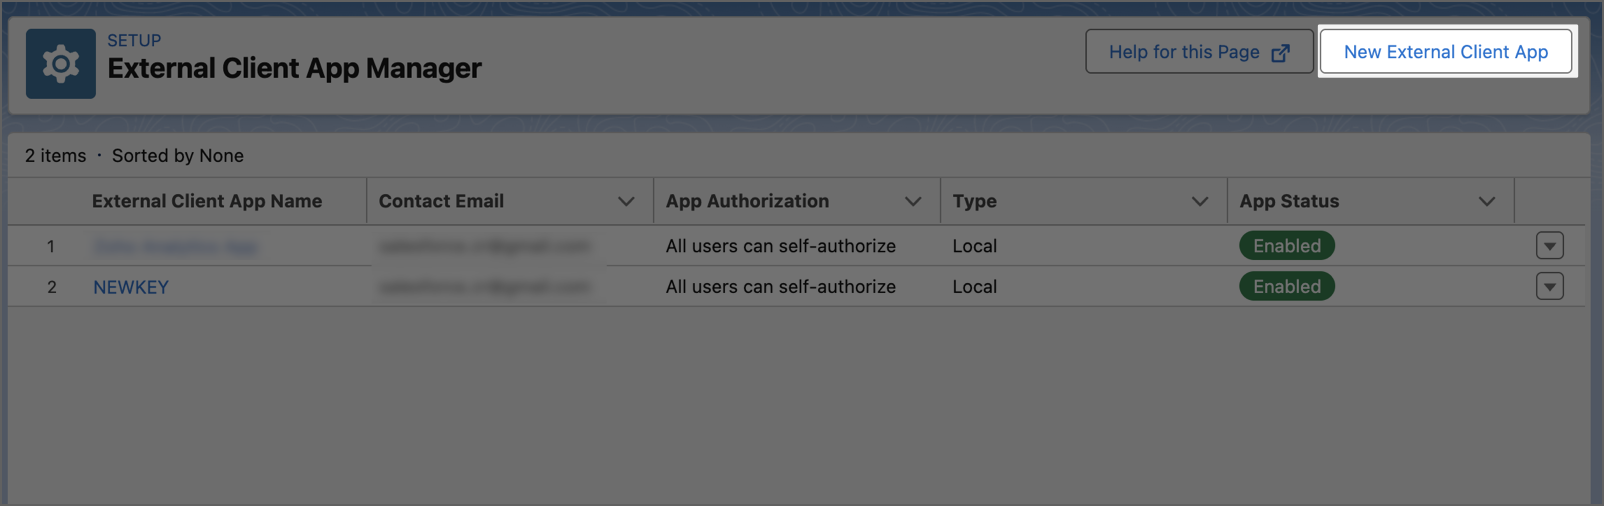
- Go to Setup > Platform Tools > Apps > External Client Apps > External Client App Manager.
- Click New External Client App.
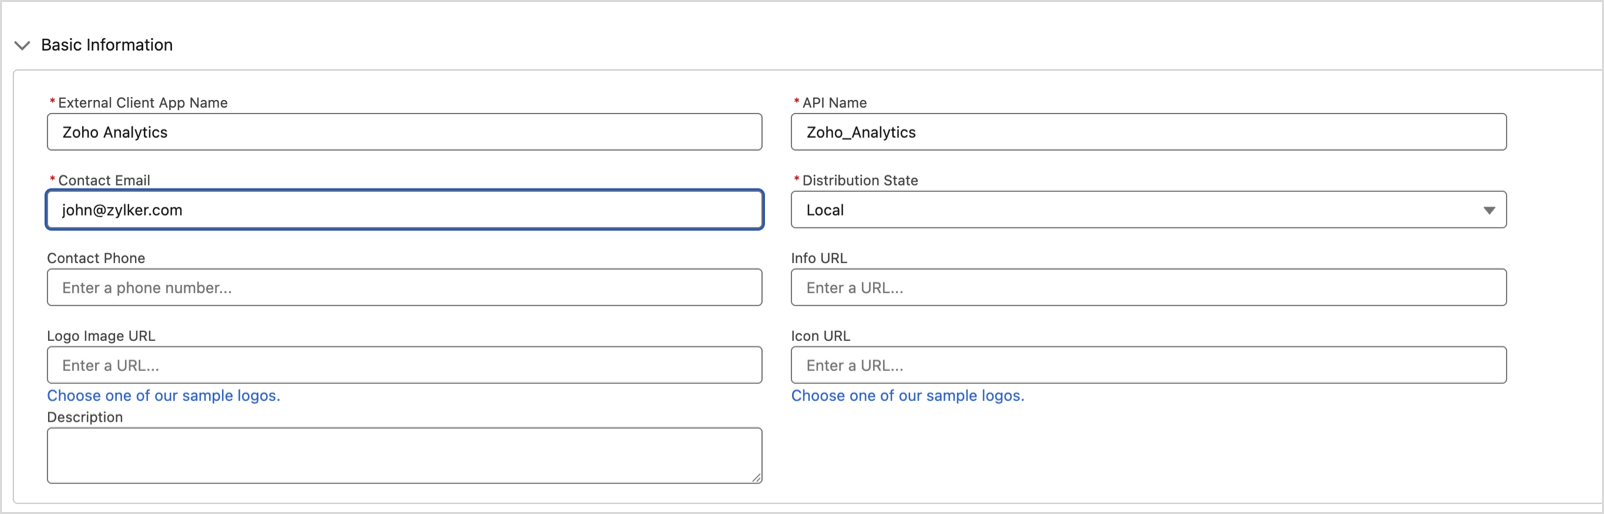
- In the Basic Information section, enter the External Client App Name, API Name, Contact Email, and select the Distribution State.
- Expand the API (Enable OAuth Settings) section and select the Enable OAuth checkbox.
- In the Callback URL field, paste the redirect URL copied from the Zoho Analytics import setup page.
- In the OAuth Scopes section, move the following scopes to the Selected OAuth Scopes list:
- Full access (full)
- Perform requests at any time (refresh_token, offline_access)
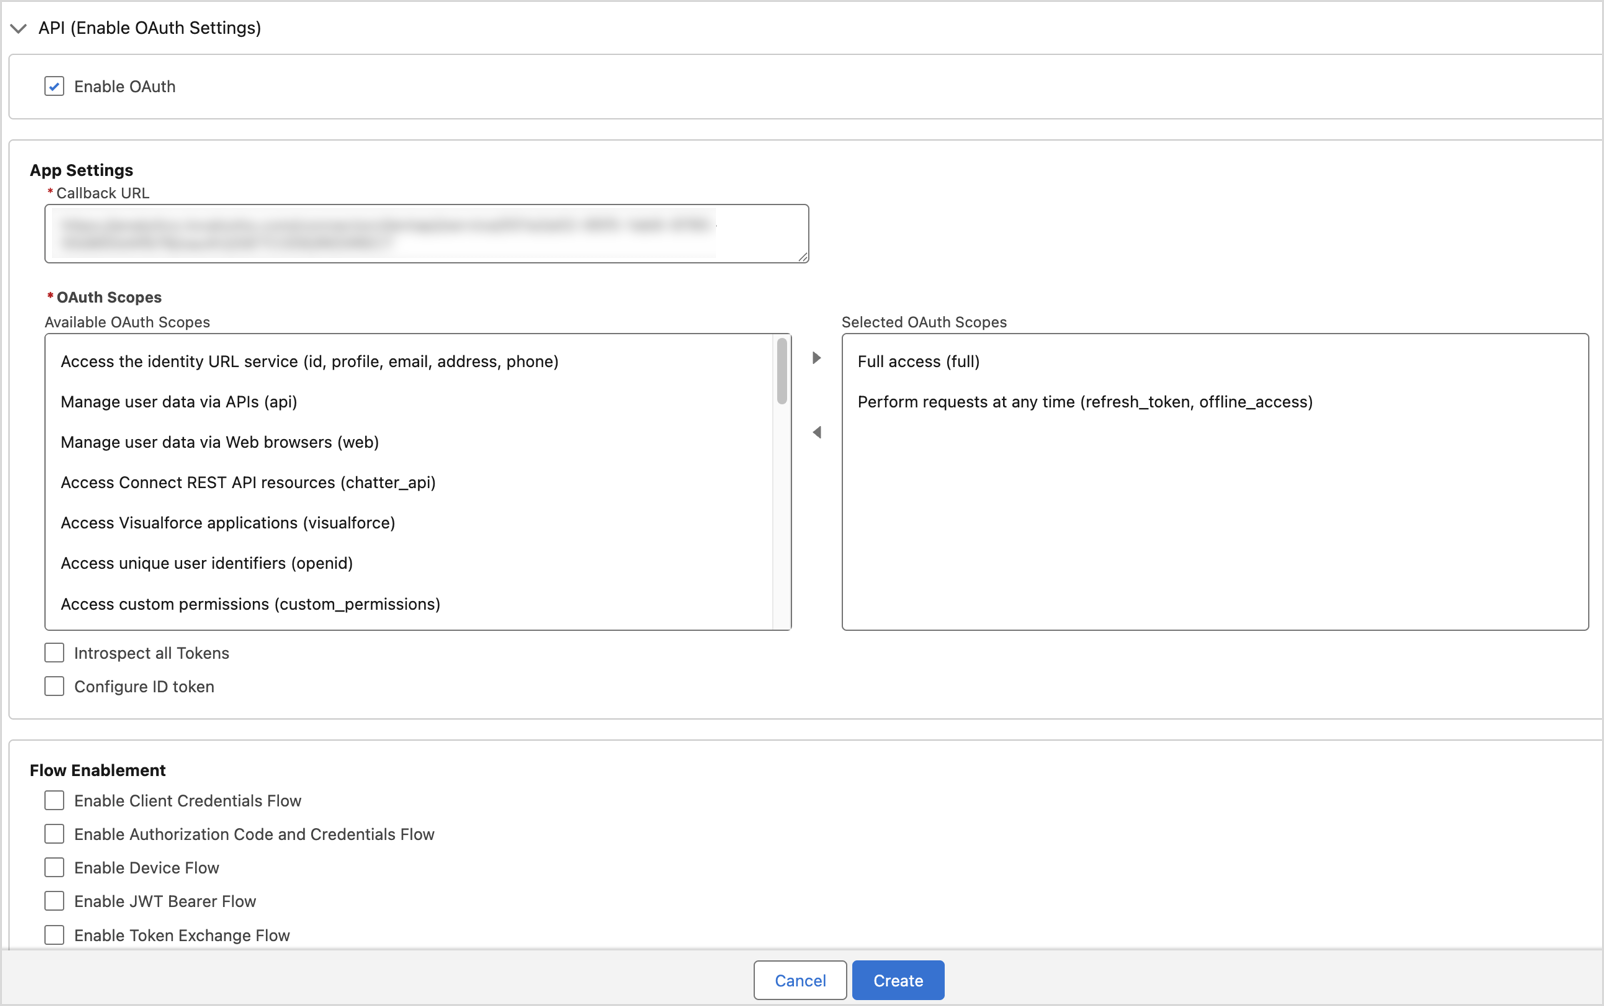
- Click Create.
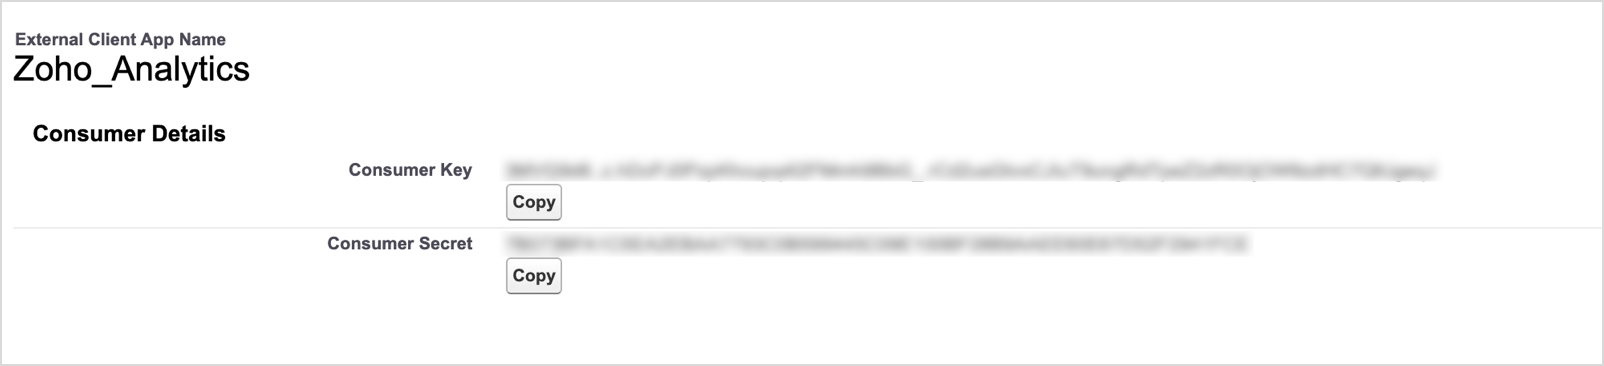
- Open the Settings tab of the created app, expand the OAuth Settings section, and click Consumer Key and Secret.
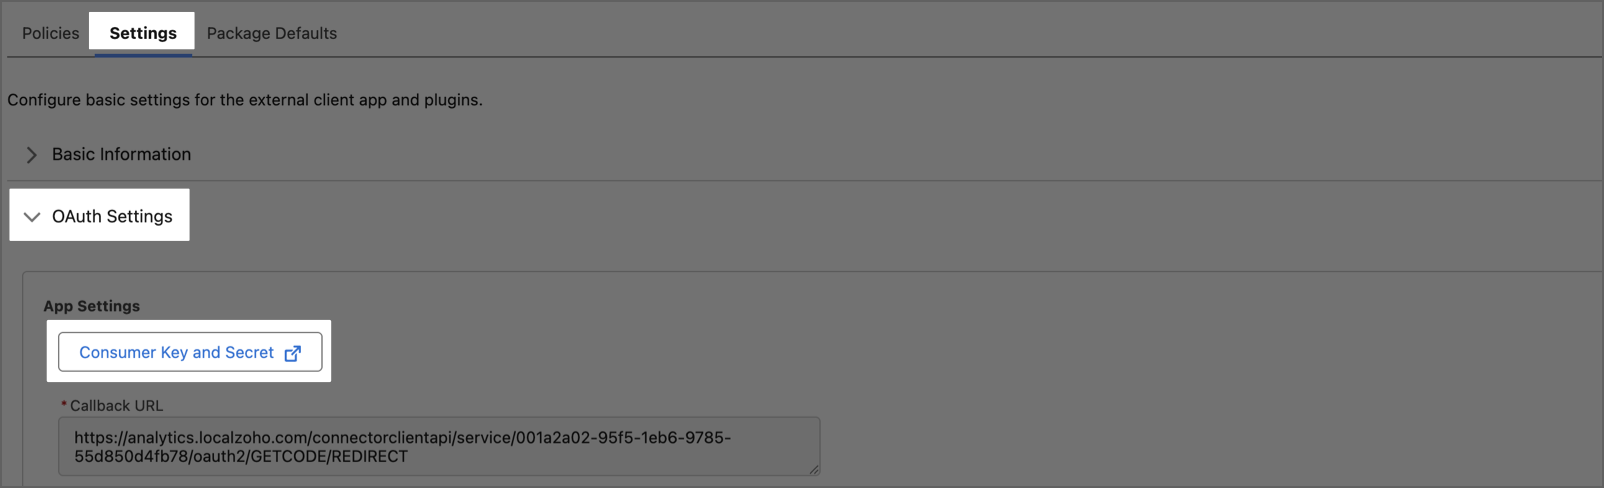
- Enter the verification code sent to your Salesforce registered email address and click Verify.
- Copy the Consumer Key and Consumer Secret. These correspond to the Client ID and Client Secret fields in Zoho Analytics.


Set up the integration in Zoho Analytics
Follow the below steps to import your Salesforce CRM data into Zoho Analytics:
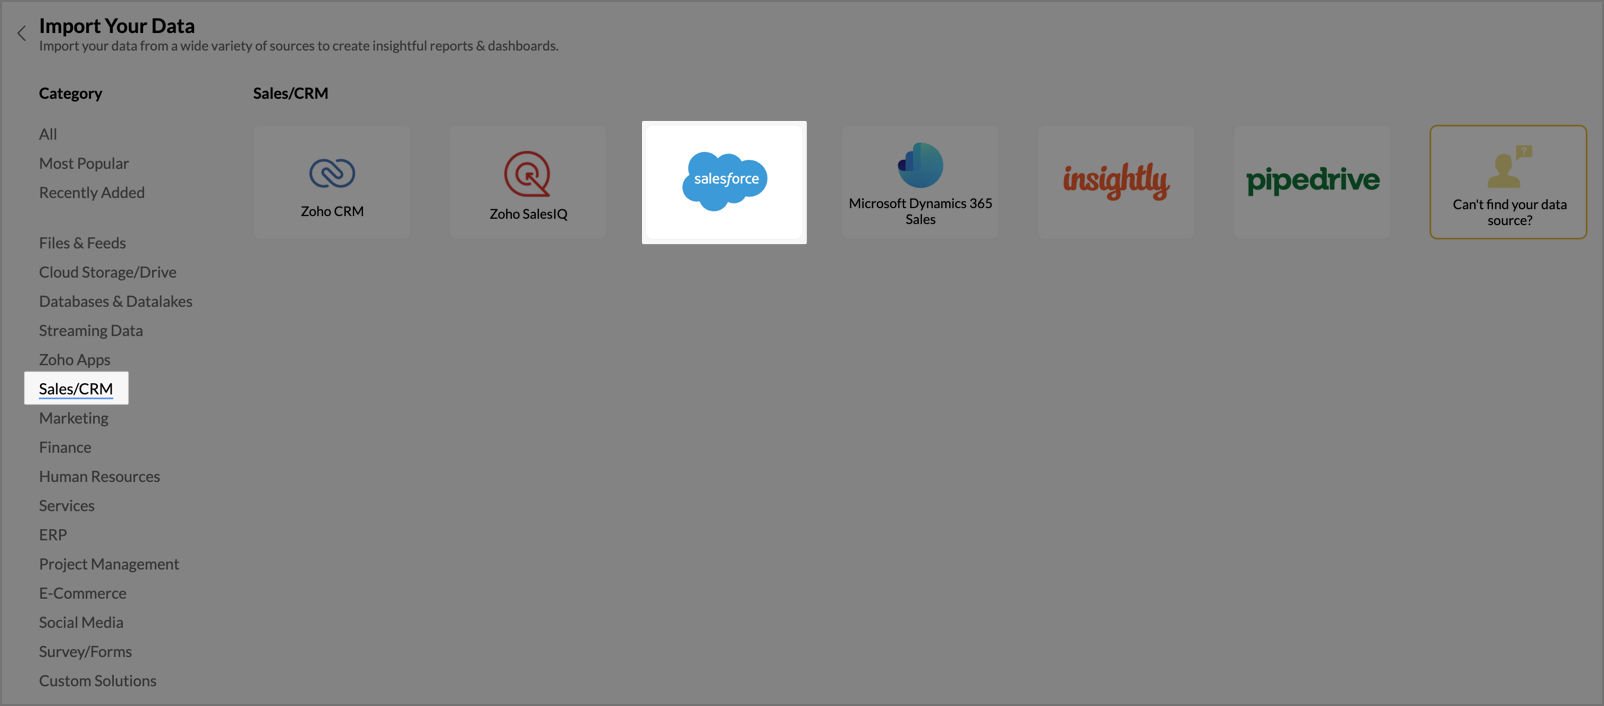
- On the Zoho Analytics home page, click Import Your Data.
- Navigate to the Sales/CRM tab and select Salesforce CRM from the available applications.
- Enter Workspace Name and Workspace Description (optional).
- Click Click to copy the redirect URL. This URL is required as the callback URL while creating the external client app in Salesforce. Refer to the prerequisite section above.
- Enter the Client ID and Client Secret generated from your Salesforce external client app. In Salesforce, these values are labeled Consumer Key and Consumer Secret.
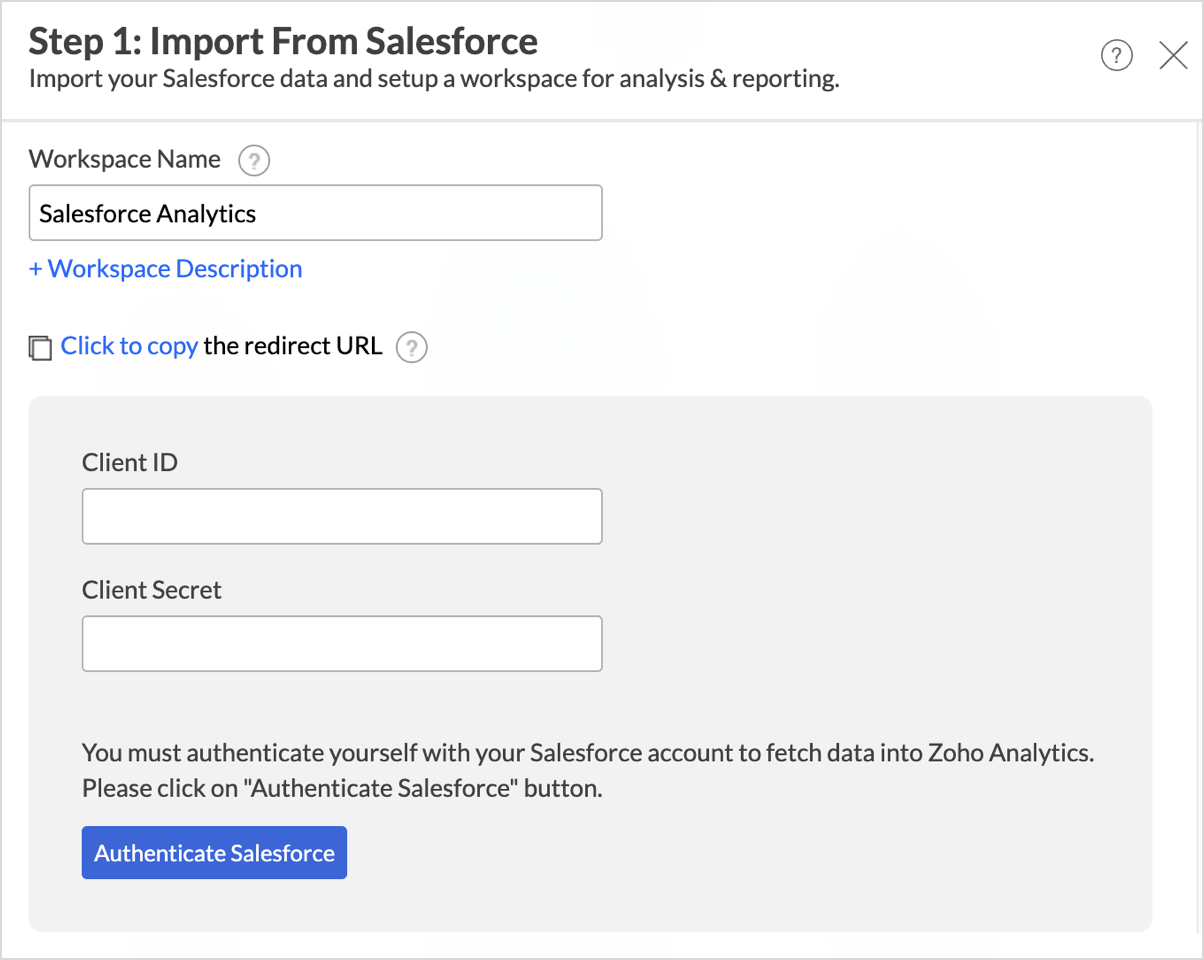
- Click Authenticate Salesforce. You will be prompted to log in to your Salesforce account from which you want to fetch data. Provide your Salesforce login credentials.
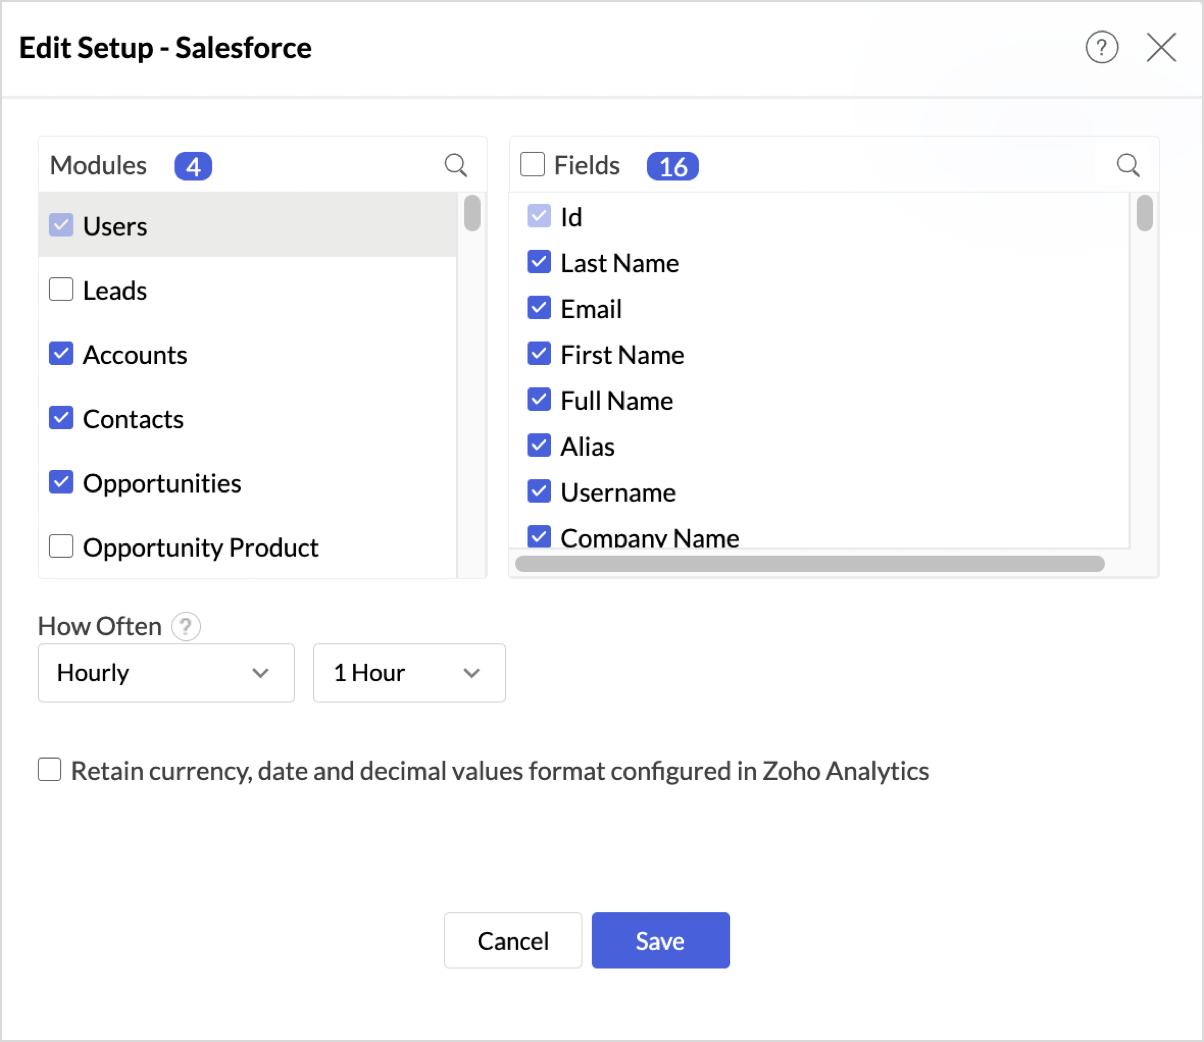
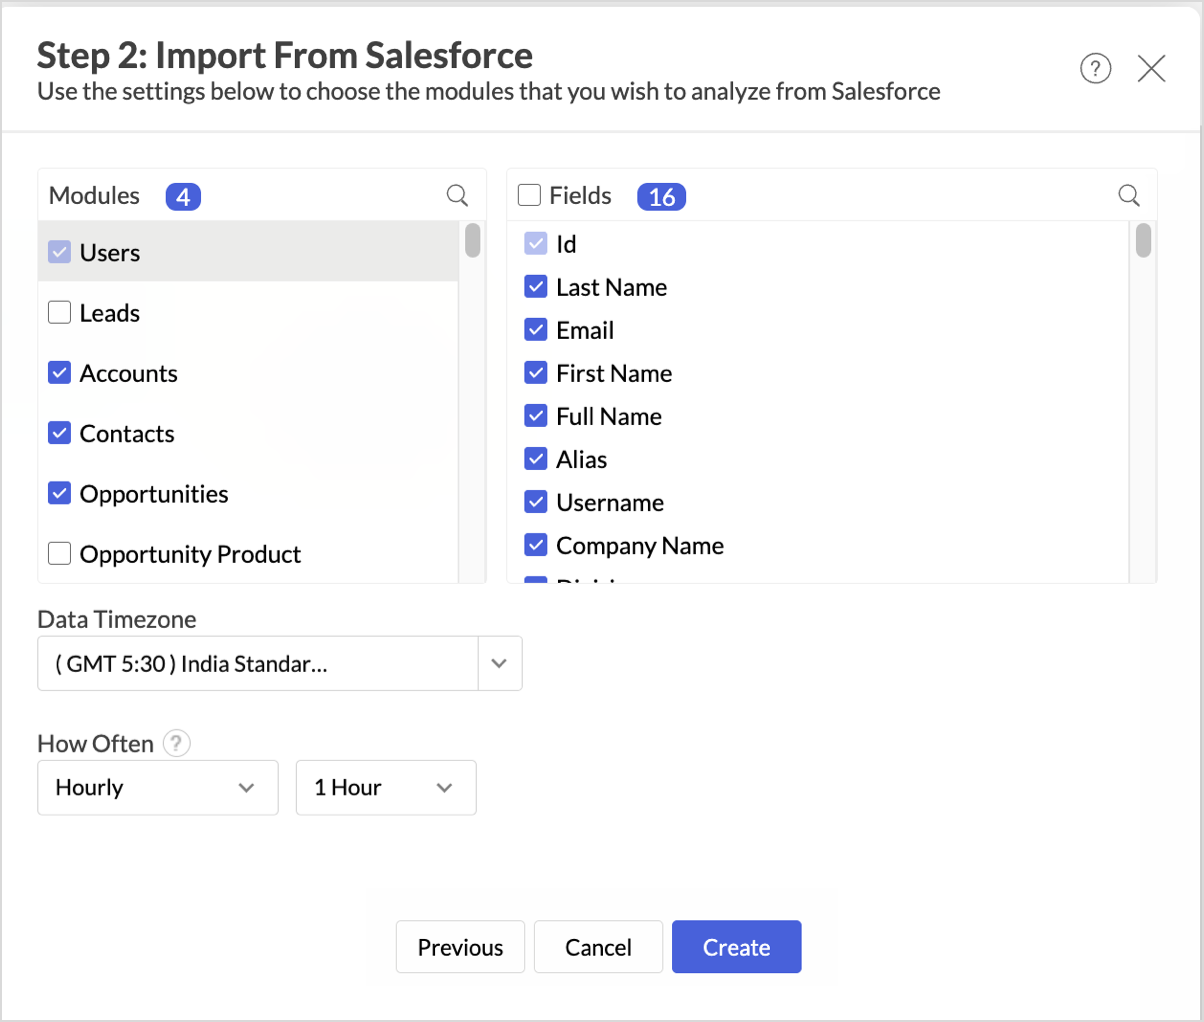
- After successful authentication, select the Modules and Fields. Mandatory fields are preselected and cannot be cleared.
- Set the Data Timezone from the drop-down.
- From the How Often section, choose the interval in which the data should be synced. Refer to the Data Sync Frequency section to learn more.
- Click Create. Import will be initiated.


Note:
- The initial fetch might take a few minutes to a couple of hours depending on the volume of the data to be imported. An email and an in-app notification will be sent once the initial fetch is complete.
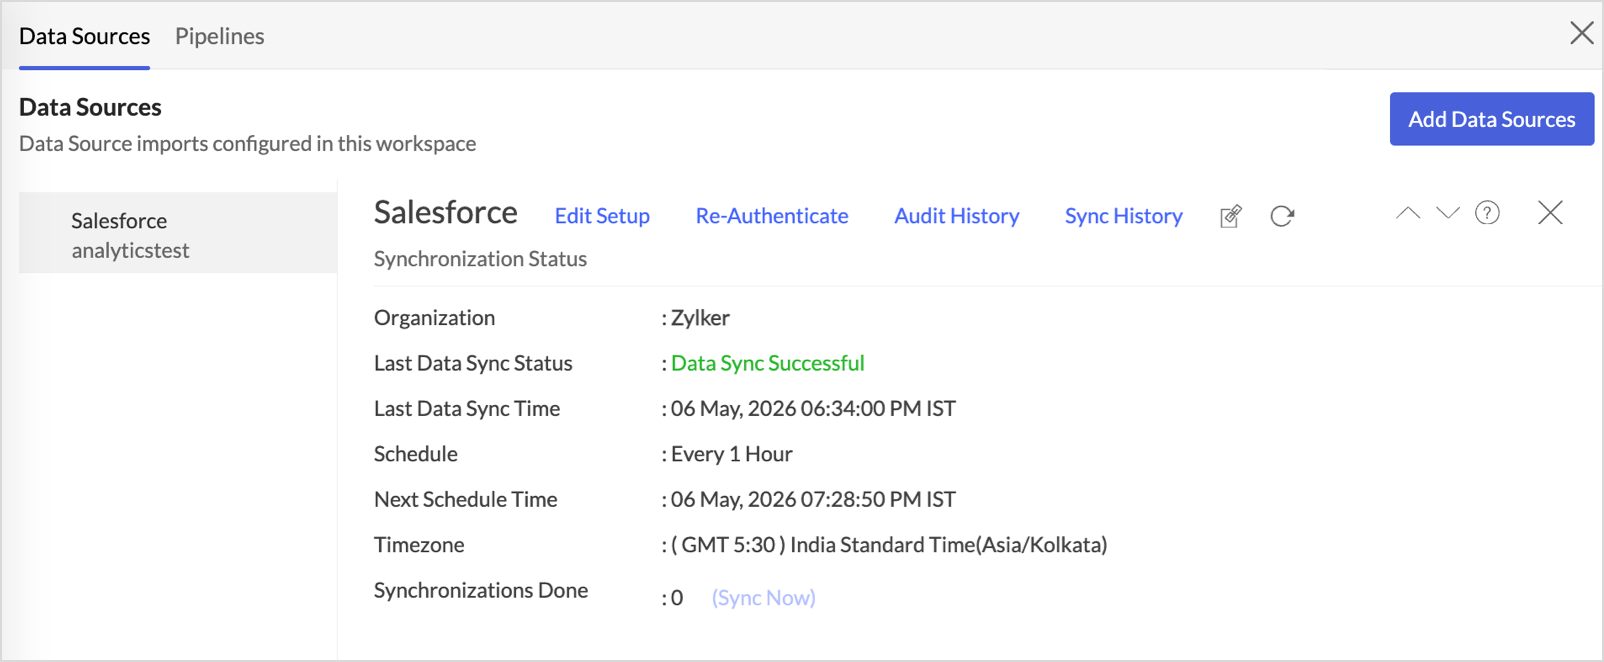
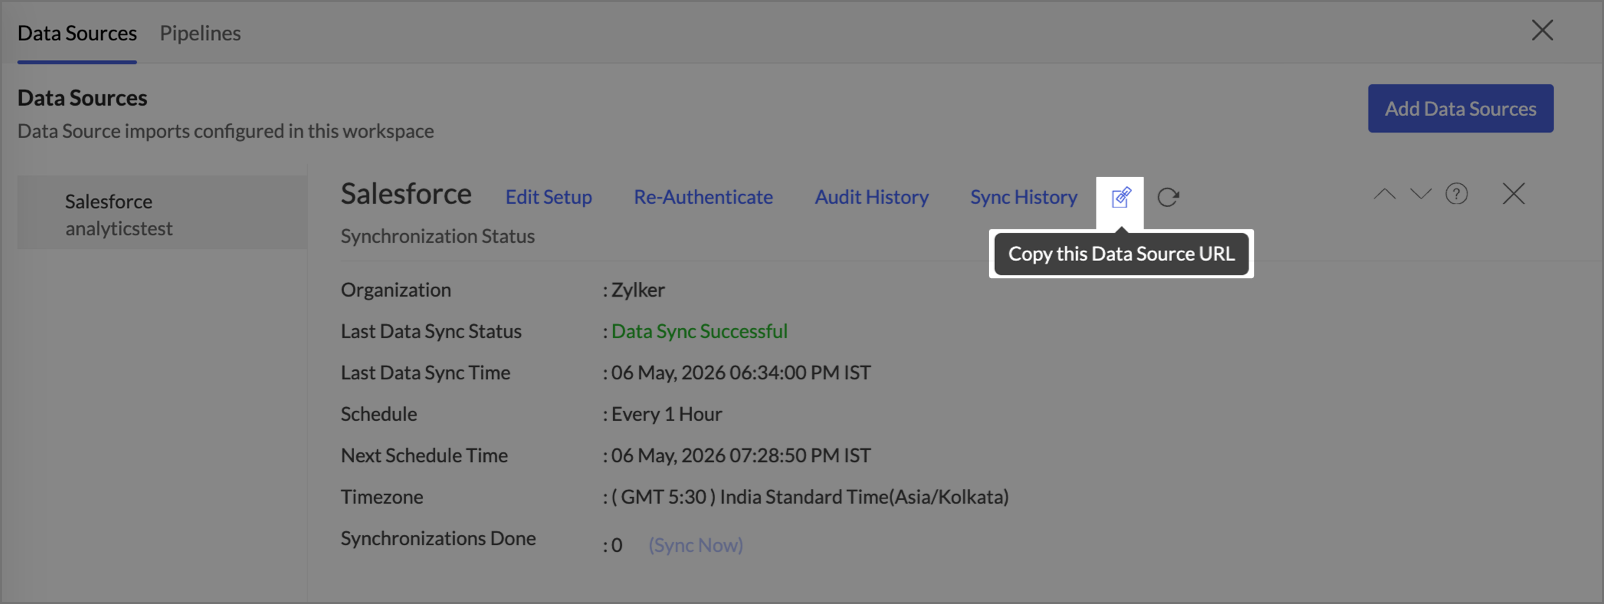
- The setup process can sometimes fail for a variety of reasons. In this case, we request you to access the Data Sources tab and click the Retry link to import again. If the issue persists, write to us at support@zohoanalytics.com.
Modules & Fields
The below table lists the modules and fields that will be synced to Zoho Analytics.
| Modules | Fields |
| Users | Id, Last Name, Email, First Name, Full Name, Alias, Username, Company Name, Division, Department, Title, Street, City, State/Province, Zip/Postal Code, Country, Latitude, Longitude, Geocode Accuracy, AutoBcc, AutoBccStayInTouch, StayInTouchReminder, Email Sender Address, Email Sender Name, Email Signature, Stay-in-Touch Email Subject, Stay-in-Touch Email Signature, Stay-in-Touch Email Note, Phone, Fax, Mobile, Nickname, User Photo badge text overlay, Active, Time Zone, Locale, Info Emails, Admin Info Emails, Email Encoding, Default Currency ISO Code, Currency ISO Code, User Type, Start of Day, End of Day, Language, Employee Number, Last Login, Last Password Change or Reset, Created Date, Last Modified Date, System Modstamp, Password Expiration Date, Failed Login Attempts, SU Access Expiration Date, Offline Edition Trial Expiration Date, Sales Anywhere Trial Expiration Date, Marketing User, Offline User, Auto-login To Call Center, Salesforce CRM Content User, Knowledge User, Flow User, Service Cloud User, Data.com User, Site.com Contributor User, Site.com Publisher User, WDC User, Allow Forecasting, ActivityRemindersPopup, EventRemindersCheckboxDefault, TaskRemindersCheckboxDefault, ReminderSoundOff, DisableAllFeedsEmail, DisableFollowersEmail, DisableProfilePostEmail, DisableChangeCommentEmail, DisableLaterCommentEmail, DisProfPostCommentEmail, ContentNoEmail, ContentEmailAsAndWhen, ApexPagesDeveloperMode, ReceiveNoNotificationsAsApprover, ReceiveNotificationsAsDelegatedApprover, HideCSNGetChatterMobileTask, DisableMentionsPostEmail, DisMentionsCommentEmail, HideCSNDesktopTask, HideChatterOnboardingSplash, HideSecondChatterOnboardingSplash, DisCommentAfterLikeEmail, DisableLikeEmail, SortFeedByComment, DisableMessageEmail, HideLegacyRetirementModal, JigsawListUser, DisableBookmarkEmail, DisableSharePostEmail, EnableAutoSubForFeeds, DisableFileShareNotificationsForApi, ShowTitleToExternalUsers, ShowManagerToExternalUsers, ShowEmailToExternalUsers, ShowWorkPhoneToExternalUsers, ShowMobilePhoneToExternalUsers, ShowFaxToExternalUsers, ShowStreetAddressToExternalUsers, ShowCityToExternalUsers, ShowStateToExternalUsers, ShowPostalCodeToExternalUsers, ShowCountryToExternalUsers, ShowProfilePicToGuestUsers, ShowTitleToGuestUsers, ShowCityToGuestUsers, ShowStateToGuestUsers, ShowPostalCodeToGuestUsers, ShowCountryToGuestUsers, ShowForecastingChangeSignals, HideS1BrowserUI, DisableEndorsementEmail, PathAssistantCollapsed, CacheDiagnostics, ShowEmailToGuestUsers, ShowManagerToGuestUsers, ShowWorkPhoneToGuestUsers, ShowMobilePhoneToGuestUsers, ShowFaxToGuestUsers, ShowStreetAddressToGuestUsers, LightningExperiencePreferred, PreviewLightning, HideEndUserOnboardingAssistantModal, HideLightningMigrationModal, HideSfxWelcomeMat, HideBiggerPhotoCallout, GlobalNavBarWTShown, GlobalNavGridMenuWTShown, CreateLEXAppsWTShown, FavoritesWTShown, RecordHomeSectionCollapseWTShown, RecordHomeReservedWTShown, FavoritesShowTopFavorites, ExcludeMailAppAttachments, SuppressTaskSFXReminders, SuppressEventSFXReminders, PreviewCustomTheme, HasCelebrationBadge, UserDebugModePref, SRHOverrideActivities, NewLightningReportRunPageEnabled, ReverseOpenActivitiesView, ShowTerritoryTimeZoneShifts, HasSentWarningEmail, HasSentWarningEmail238, HasSentWarningEmail240, NativeEmailClient, Extension, SAML Federation ID, About Me, Url for full-sized Photo, Photo, Show external indicator, Out of office message, URL for medium profile photo, Chatter Email Highlights Frequency, Default Notification Frequency when Joining Groups, Data.com Monthly Addition Limit, Last Viewed Date, Last Referenced Date, URL for banner photo, URL for IOS banner photo, URL for Android banner photo, Has Profile Photo, DB Region, Role ID, Profile ID, Delegated Approver ID, Manager ID, Created By ID, Last Modified By ID, Contact ID, Account ID, Call Center ID, Individual ID |
| Leads | Id, Full Name, Mobile Phone, Website, Industry, Status, Converted, Converted Opportunity ID, Last Name, Email, First Name, Company, Lead Source, Created Date, Owner ID, Deleted, Salutation, Title, Street, City, State/Province, Zip/Postal Code, Country, Latitude, Longitude, Geocode Accuracy, Phone, Fax, Photo URL, Description, Rating, Lead Currency, Annual Revenue, Employees, Converted Date, Unread By Owner, Last Modified Date, System Modstamp, Last Activity, Last Viewed Date, Last Referenced Date, Data.com Key, Jigsaw Contact ID, Clean Status, Company D-U-N-S Number, Email Bounced Reason, Email Bounced Date, SIC Code, Product Interest, Primary, Current Generator(s), Number of Locations, Twitter Username, _CustomField, DB Created Date without Time, DB Lead Age, nameAlert' onmouseover='alert(123);', Master Record ID, Converted Account ID, Converted Contact ID, Created By ID, Last Modified By ID, D&B Company ID, Individual ID, Lead-Contact |
| Accounts | Id, Account Name, Account Type, Industry, Annual Revenue, Owner ID, Created Date, Website, Deleted, Billing Street, Billing City, Billing State/Province, Billing Zip/Postal Code, Billing Country, Billing Latitude, Billing Longitude, Billing Geocode Accuracy, Shipping Street, Shipping City, Shipping State/Province, Shipping Zip/Postal Code, Shipping Country, Shipping Latitude, Shipping Longitude, Shipping Geocode Accuracy, Account Phone, Account Fax, Account Number, Photo URL, SIC Code, Employees, Ownership, Ticker Symbol, Account Description, Account Rating, Account Site, Account Currency, Last Modified Date, System Modstamp, Last Activity, Last Viewed Date, Last Referenced Date, Data.com Key, Jigsaw Company ID, Clean Status, Account Source, D-U-N-S Number, Tradestyle, NAICS Code, NAICS Description, Year Started, SIC Description, Customer Priority, SLA, Active, Number of Locations, Upsell Opportunity, SLA Serial Number, SLA Expiration Date, formula_currency, Master Record ID, Parent Account ID, Created By ID, Last Modified By ID, D&B Company ID, Operating Hour ID |
| Contacts | Id, Account ID, Last Name, First Name, Full Name, Email, Lead Source, Owner ID, Created Date, Mobile Phone, Deleted, Salutation, Other Street, Other City, Other State/Province, Other Zip/Postal Code, Other Country, Other Latitude, Other Longitude, Other Geocode Accuracy, Mailing Street, Mailing City, Mailing State/Province, Mailing Zip/Postal Code, Mailing Country, Mailing Latitude, Mailing Longitude, Mailing Geocode Accuracy, Business Phone, Business Fax, Home Phone, Other Phone, Asst. Phone, Title, Department, Assistant's Name, Birthdate, Contact Description, Contact Currency, Last Modified Date, System Modstamp, Last Activity, Last Stay-in-Touch Request Date, Last Stay-in-Touch Save Date, Last Viewed Date, Last Referenced Date, Email Bounced Reason, Email Bounced Date, Is Email Bounced, Photo URL, Data.com Key, Jigsaw Contact ID, Clean Status, Level, Languages, Twitter Username, Currency Test, Formula Test, Integer Test, Master Record ID, Reports To ID, Created By ID, Last Modified By ID, Individual ID, Describe |
| Opportunities | Id, Name, Stage, Amount, Probability (%), Expected Amount, Close Date, Opportunity Type, Lead Source, Won, Account ID, Owner ID, Created Date, Deleted, Private, Description, Quantity, Next Step, Closed, Forecast Category, Forecast Category, Opportunity Currency, Has Line Item, Last Modified Date, System Modstamp, Last Activity, Push Count, Last Stage Change Date, Fiscal Quarter, Fiscal Year, Fiscal Period, Last Viewed Date, Last Referenced Date, Has Open Activity, Has Overdue Task, Delivery/Installation Status, Tracking Number, Order Number, Current Generator(s), Main Competitor(s), DB Competitor, Prob Ranking, Prob Score, Prob Updated, Projected Amount, conv, Campaign ID, Price Book ID, Created By ID, Last Modified By ID, Contact ID, Quote ID, Opportunity History ID, Opportunity History ID |
| Opportunity Product | Id, List Price, Opportunity Product Name, Opportunity ID, Price Book Entry ID, Product ID, Product Code, Quantity, Total Price, Sales Price, Sort Order, Currency ISO Code, Date, Has Revenue Schedule, Has Quantity Schedule, Line Description, Has Schedule, Quantity Scheduling Enabled, Revenue Scheduling Enabled, Created Date, Last Modified Date, System Modstamp, Deleted, Last Viewed Date, Last Referenced Date, Created By ID, Last Modified By ID |
| Opportunity History | Id, Opportunity ID, Created Date, Stage Name, Amount, Expected Revenue, Close Date, Probability, To Forecast Category, Currency ISO Code, System Modstamp, Deleted, Previous Amount, Previous Close Date, Created By ID |
| Tasks | Id, Name ID, Related To ID, Subject, Due Date Only, Status, Priority, Assigned To ID, Accounts, Created Date, Last Modified Date, Call Type, Call Duration, High Priority, Description, Currency ISO Code, Deleted, Closed, System Modstamp, Archived, Call Result, Call Object Identifier, Reminder Date/Time, Reminder Set, Create Recurring Series of Tasks, Recurrence Start, Recurrence End, Recurrence Time Zone, Recurrence Type, Recurrence Interval, Recurrence Day of Week Mask, Recurrence Day of Month, Recurrence Instance, Recurrence Month of Year, Repeat This Task, Task Subtype, Completed Date/Time, DB Activity Type, Count of Events, Count of Tasks, Event Type, Created By ID, Last Modified By ID, Recurrence Activity ID |
| Events | Id, Name ID, Related To ID, Subject, Due Date Only, Due Date Time, Accounts, Assigned To ID, Start Date Time, End Date Time, Created Date, Last Modified Date, Location, All-Day Event, Duration, End Date, Description, Activity Currency, Private, Show Time As, Deleted, Is Child, Is Group Event, Group Event Type, System Modstamp, Archived, Create Recurring Series of Events, Recurrence Start, Recurrence End, Recurrence Time Zone, Recurrence Type, Recurrence Interval, Recurrence Day of Week Mask, Recurrence Day of Month, Recurrence Instance, Recurrence Month of Year, Reminder Date/Time, Reminder Set, Event Subtype, Historical Event, Not Following Recurrence, Recurrence Pattern, Pattern Version, Repeat, Is Exception, Recurrence Pattern Start Date, Recurrence Pattern Time Zone Reference, DB Activity Type, Count of Events, Count of Tasks, Event Type, Created By ID, Last Modified By ID, Recurrence Activity ID |
| Cases | Id, Owner ID, Status, Case Origin, Created Date, Last Modified Date, Subject, Case Type, Email Address, Deleted, Case Number, Name, Phone, Company, Case Reason, Priority, Description, Closed, Closed Date, Escalated, Case Currency, System Modstamp, Contact Phone, Contact Mobile, Contact Email, Contact Fax, Internal Comments, Last Viewed Date, Last Referenced Date, Engineering Req Number, SLA Violation, Product, Potential Liability, zzz-deprecated, Master Record ID, Contact ID, Account ID, Asset ID, Parent Case ID, Created By ID, Last Modified By ID |
| Contracts | Id, Created Date, Last Modified Date, Account ID, Activated Date, Company Signed Date, Contract Number, Contract Term, Customer Signed Date, Customer Signed By ID, Contract End Date, Owner ID, Price Book ID, Status, Currency ISO Code, Owner Expiration Notice, Contract Start Date, Billing Street, Billing City, Billing State/Province, Billing Zip/Postal Code, Billing Country, Billing Latitude, Billing Longitude, Billing Geocode Accuracy, Customer Signed Title, Special Terms, Status Category, Description, Deleted, Last Approved Date, System Modstamp, Last Activity, Last Viewed Date, Last Referenced Date, Company Signed By ID, Activated By ID, Created By ID, Last Modified By ID |
| Orders | Id, Created Date, Last Modified Date, Account ID, Contract ID, Order Name, Order Number, Order Reference Number, Owner ID, PO Date, PO Number, Price Book ID, Ship To Contact ID, Status, Order Amount, Order Type, Order Start Date, Order End Date, Reduction Order, Description, Customer Authorized Date, Company Authorized Date, Billing Street, Billing City, Billing State/Province, Billing Zip/Postal Code, Billing Country, Billing Latitude, Billing Longitude, Billing Geocode Accuracy, Shipping Street, Shipping City, Shipping State/Province, Shipping Zip/Postal Code, Shipping Country, Shipping Latitude, Shipping Longitude, Shipping Geocode Accuracy, Activated Date, Status Category, Currency ISO Code, Deleted, System Modstamp, Last Viewed Date, Last Referenced Date, Order ID, Customer Authorized By ID, Company Authorized By ID, Bill To Contact ID, Activated By ID, Created By ID, Last Modified By ID |
| Order Products | Id, Available Quantity, List Price, Order ID, Order Product Number, Price Book Entry ID, Quantity, Unit Price, Deleted, Currency ISO Code, Total Price, Start Date, End Date, Line Description, Created Date, Last Modified Date, System Modstamp, Product ID, Original Order Item ID, Created By ID, Last Modified By ID |
| Quotes | Id, Account ID, Contact ID, Contract ID, Discount, Grand Total, Line Items, Quote Name, Opportunity ID, Price Book ID, Quote Number, Status, Subtotal, Tax, Total Price, Deleted, Currency ISO Code, Created Date, Last Modified Date, System Modstamp, Last Viewed Date, Last Referenced Date, Syncing, Shipping and Handling, Expiration Date, Description, Bill To Street, Bill To City, Bill To State/Province, Bill To Zip/Postal Code, Bill To Country, Bill To Latitude, Bill To Longitude, Bill To Geocode Accuracy, Ship To Street, Ship To City, Ship To State/Province, Ship To Zip/Postal Code, Ship To Country, Ship To Latitude, Ship To Longitude, Ship To Geocode Accuracy, Quote To Street, Quote To City, Quote To State/Province, Quote To Zip/Postal Code, Quote To Country, Quote To Latitude, Quote To Longitude, Quote To Geocode Accuracy, Additional To Street, Additional To City, Additional To State/Province, Additional To Zip/Postal Code, Additional To Country, Additional To Latitude, Additional To Longitude, Additional To Geocode Accuracy, Bill To Name, Ship To Name, Quote To Name, Additional To Name, Email, Phone, Fax, Can Create Quote Line Items, Owner ID, Created By ID, Last Modified By ID |
| Quote Line Items | Id, Discount (Percentage), Line Item Number, List Price, Price Book Entry ID, Product ID, Quantity, Subtotal , Total Price, Sales Price, Deleted, Currency ISO Code, Created Date, Last Modified Date, System Modstamp, Last Viewed Date, Last Referenced Date, Has Revenue Schedule, Has Quantity Schedule, Line Item Description, Date, Sort Order, Schedule, Created By ID, Last Modified By ID, Quote ID, Line Item ID |
| Products | Id, Active, Product Name, Product Code, Product Description, Quantity Schedule Type, Quantity Installment Period, Number Of Quantity Installments, Revenue Schedule Type, Revenue Installment Period, Number Of Revenue Installments, Quantity Scheduling Enabled, Revenue Scheduling Enabled, Created Date, Last Modified Date, System Modstamp, Product Family, Serialized, Currency ISO Code, External ID, Display URL, Quantity Unit Of Measure, Deleted, Archived, Last Viewed Date, Last Referenced Date, Product SKU, Created By ID, Last Modified By ID, External Data Source ID |
| Price Books | Id, Active, Price Book Name, Is Standard Price Book, Deleted, Currency ISO Code, Created Date, Last Modified Date, System Modstamp, Last Viewed Date, Last Referenced Date, Archived, Description, Created By ID, Last Modified By ID |
| Price Book Entries | Id, Active, Product Name, Price Book ID, Product ID, Product Code, List Price, Currency ISO Code, Use Standard Price, Created Date, Last Modified Date, System Modstamp, Deleted, Archived, Created By ID, Last Modified By ID |
| Campaigns | Id, Actual Cost in Campaign, Value Opportunities in Campaign, Value Won Opportunities in Campaign, Budgeted Cost in Campaign, End Date, Expected Response (%), Expected Revenue in Campaign, Active, Name, Contacts in Campaign, Converted Leads in Campaign, Leads in Campaign, Opportunities in Campaign, Responses in Campaign, Won Opportunities in Campaign, Owner ID, Start Date, Status, Type, Deleted, Currency ISO Code, Num Sent in Campaign, Description, Created Date, Last Modified Date, System Modstamp, Last Activity, Last Viewed Date, Last Referenced Date, DB Campaign Tactic, Parent Campaign ID, Created By ID, Last Modified By ID, Record Type ID |
| Campaign Members | Id, Campaign ID, Contact ID, First Responded Date, Responded, Lead ID, Status, Deleted, Created Date, Last Modified Date, System Modstamp, Currency ISO Code, Salutation, Name, First Name, Last Name, Title, Street, City, State/Province, Zip/Postal Code, Country, Email, Phone, Fax, Mobile, Description, Do Not Call, Email Opt Out, Fax Opt Out, Lead Source, Company (Account), Type, Created By ID, Last Modified By ID, Related Record ID, Related Record Owner ID |
| Account Clean Info | Deleted, Account Clean Info Name, Currency ISO Code, Created Date, Last Modified Date, System Modstamp, Last Matched Date, Last Status Changed Date, Company Status in Salesforce, Company Name, Phone, Street, City, State, Zip, Country, Latitude, Longitude, Geocode Accuracy, Website, Ticker Symbol, Annual Revenue, Number of Employees, Industry, Ownership, D-U-N-S Number, SIC Code, SIC Description, NAICS Code, NAICS Description, Year Started, Fax, Account Site, Description, Tradestyle, D&B Company D-U-N-S Number, DUNSRight™ Match Grade, DUNSRight™ Match Confidence, Company Status per Data.com, Company Name is Reviewed, Phone is Reviewed, Address is Reviewed, Website is Reviewed, Ticker Symbol is Reviewed, Annual Revenue is Reviewed, Number of Employees is Reviewed, Industry is Reviewed, Ownership is Reviewed, D-U-N-S Number is Reviewed, SIC Code is Reviewed, SIC Description is Reviewed, NAICS Code is Reviewed, NAICS Description is Reviewed, Year Started is Reviewed, Fax is Reviewed, Account Site is Reviewed, Description is Reviewed, Tradestyle is Reviewed, D&B Company D-U-N-S Number is Reviewed, Company Name is Different, Phone is Different, Street is Different, City is Different, State is Different, ZIP is Different, Country is Different, Website is Different, Ticker Symbol is Different, Annual Revenue is Different, Number of Employees is Different, Industry is Different, Ownership is Different, D-U-N-S Number is Different, SIC Code is Different, SIC Description is Different, NAICS Code is Different, NAICS Description is Different, Year Started is Different, Fax is Different, Account Site is Different, Description is Different, Tradestyle is Different, D&B Company D-U-N-S Number is Different, State Code is Different, Country Code is Different, Cleaned by Job, Cleaned by User, Company Name is Flagged Wrong, Phone is Flagged Wrong, Address is Flagged Wrong, Website is Flagged Wrong, Ticker Symbol is Flagged Wrong, Annual Revenue is Flagged Wrong, Number of Employees is Flagged Wrong, Industry is Flagged Wrong, Ownership is Flagged Wrong, D-U-N-S Number is Flagged Wrong, SIC Code is Flagged Wrong, SIC Description is Flagged Wrong, NAICS Code is Flagged Wrong, NAICS Description is Flagged Wrong, Year Started is Flagged Wrong, Fax is Flagged Wrong, Account Site is Flagged Wrong, Description is Flagged Wrong, Tradestyle is Flagged Wrong, Data.com ID, Created By ID, Last Modified By ID, Account ID, User ID, Id |
| Account Contact Roles | Deleted, Created Date, Last Modified Date, System Modstamp, Role, Primary, Created By ID, Last Modified By ID, Accounts, Contact ID, Id |
| Account Feed | Feed Item Type, Created Date, Deleted, Last Modified Date, System Modstamp, Comment Count, Like Count, Title, Body, Link URL, Is Rich Text, Parent ID, Created By ID, Related Record ID, InsertedBy ID, Best Comment ID, Id |
| Account Teams | Team Role, URL for thumbnail sized photo, Title, Account Access, Opportunity Access, Case Access, Contact Access, Currency ISO Code, Created Date, Last Modified Date, System Modstamp, Deleted, Account ID, User ID, Created By ID, Last Modified By ID, Id |
| Additional Directory Numbers | Deleted, Name, Description, Phone, Created Date, Last Modified Date, System Modstamp, Call Center ID, Created By ID, Last Modified By ID, Id |
| Announcements | Deleted, Created Date, Last Modified Date, System Modstamp, Expiration Date, Send Emails on Announcement, Is Announcement Archived, Created By ID, Last Modified By ID, Feed Item ID, Parent ID, Id |
| App Analytics Query Requests | Deleted, Number, Created Date, Last Modified Date, System Modstamp, Last Viewed Date, Last Referenced Date, Data Type, Start Time, End Time, Request State, Download URL, Download Expiration Time, Error Message, Query Submitted Time, Package IDs, Organization IDs, Download File Size, File Compression, Available Since, File Type, Created By ID, Last Modified By ID, Id |
| Assets | Product Code, Competitor Asset, Created Date, Last Modified Date, System Modstamp, Deleted, Currency ISO Code, Asset Name, Serial Number, Install Date, Purchase Date, Usage End Date, Lifecycle Start Date, Lifecycle End Date, Status, Price, Quantity, Description, Product SKU, Lifecycle-managed asset, Current Monthly Recurring Revenue, Current Lifecycle End Date, Current Quantity, Current Amount, Total Lifecycle Amount, Street, City, State, Postal Code, Country, Latitude, Longitude, Geocode Accuracy, Last Viewed Date, Last Referenced Date, Contact ID, Accounts, Parent Asset ID, Root Asset ID, Product ID, Created By ID, Last Modified By ID, Owner ID, Location ID, Id |
| Asset Feed | Feed Item Type, Created Date, Deleted, Last Modified Date, System Modstamp, Comment Count, Like Count, Title, Body, Link URL, Is Rich Text, Parent ID, Created By ID, Related Record ID, InsertedBy ID, Best Comment ID, Id |
| Asset Relationships | Deleted, Asset Relationship Number, Currency ISO Code, Created Date, Last Modified Date, System Modstamp, Last Viewed Date, Last Referenced Date, From Date, To Date, Created By ID, Last Modified By ID, Asset ID, Asset ID, Id |
| Asset Relationship Feed | Feed Item Type, Created Date, Deleted, Last Modified Date, System Modstamp, Comment Count, Like Count, Title, Body, Link URL, Is Rich Text, Parent ID, Created By ID, Related Record ID, InsertedBy ID, Best Comment ID, Id |
| Attachments | Deleted, File Name, Private, Content Type, Body Length, Body, Created Date, Last Modified Date, System Modstamp, Description, Parent ID, Owner ID, Created By ID, Last Modified By ID, Id |
| Background Operations | Deleted, Name, Currency ISO Code, Created Date, Last Modified Date, System Modstamp, Submitted, Status, Execution Group, Sequence Group, Sequence Number, Started, Finished, Worker URI, Timeout, Expires, Num Followers, Process After, Parent Key, Retry Limit, Retry Count, Retry Backoff, Error Message, Type, Created By ID, Last Modified By ID, Background Operation ID, Id |
| Campaign Feed | Feed Item Type, Created Date, Deleted, Last Modified Date, System Modstamp, Comment Count, Like Count, Title, Body, Link URL, Is Rich Text, Parent ID, Created By ID, Related Record ID, InsertedBy ID, Best Comment ID, Id |
| Campaign Member Statuses | Deleted, Member Status, Sort Order, Is Default, Responded, Created Date, Last Modified Date, System Modstamp, Campaign ID, Created By ID, Last Modified By ID, Id |
| Case Comments | Published, Body, Created Date, System Modstamp, Last Modified Date, Deleted, Parent ID, Created By ID, Last Modified By ID, Id |
| Case Contact Role | Role, Created Date, Last Modified Date, System Modstamp, Deleted, Case ID, Contact ID, Created By ID, Last Modified By ID, Id |
| Case Feed | Feed Item Type, Created Date, Deleted, Last Modified Date, System Modstamp, Comment Count, Like Count, Title, Body, Link URL, Is Rich Text, Parent ID, Created By ID, Related Record ID, InsertedBy ID, Best Comment ID, Id |
| Case Solution | Created Date, System Modstamp, Deleted, Case ID, Solution ID, Created By ID, Id |
| Category Data | Deleted, Created Date, Last Modified Date, System Modstamp, Category Node ID, sObject ID, Created By ID, Last Modified By ID, Id |
| Group Feed | Feed Item Type, Created Date, Deleted, Last Modified Date, System Modstamp, Comment Count, Like Count, Title, Body, Link URL, Is Rich Text, Parent ID, Created By ID, Related Record ID, InsertedBy ID, Best Comment ID, Id |
| Group Records | Deleted, Created Date, Last Modified Date, System Modstamp, Created By ID, Last Modified By ID, Chatter Group ID, Record ID, Id |
| Consumption Rates | Deleted, Consumption Rate Name, Currency ISO Code, Created Date, Last Modified Date, System Modstamp, Description, Processing Order, Pricing Method, Lower Bound, Upper Bound, Price, Created By ID, Last Modified By ID, Consumption Schedule ID, Id |
| Consumption Schedules | Deleted, Consumption Schedule Name, Currency ISO Code, Created Date, Last Modified Date, System Modstamp, Last Viewed Date, Last Referenced Date, Active, Description, Billing Term, Billing Term Unit, Type, Unit of Measure, Rating Method, Matching Attribute, Number of Consumption Rates, Owner ID, Created By ID, Last Modified By ID, Id |
| ConsumptionSchedule | Feed Item Type, Created Date, Deleted, Last Modified Date, System Modstamp, Comment Count, Like Count, Title, Body, Link URL, Is Rich Text, Parent ID, Created By ID, Related Record ID, InsertedBy ID, Best Comment ID, Id |
| Contact Clean Info | Deleted, Contact Clean Info Name, Currency ISO Code, Created Date, Last Modified Date, System Modstamp, Last Matched Date, Last Status Changed Date, Contact Status in Salesforce, First Name, Last Name, Email, Phone, Street, City, State, Zip, Country, Latitude, Longitude, Geocode Accuracy, Title, Contact Status per Data.com, Name is Reviewed, Email is Reviewed, Phone is Reviewed, Address is Reviewed, Title is Reviewed, First Name is Different, Last Name is Different, Email is Different, Phone is Different, Street is Different, City is Different, State is Different, ZIP is Different, Country is Different, Title is Different, State Code is Different, Country Code is Different, Cleaned by Job, Cleaned by User, Name is Flagged Wrong, Email is Flagged Wrong, Phone is Flagged Wrong, Address is Flagged Wrong, Title is Flagged Wrong, Data.com ID, Created By ID, Last Modified By ID, Contact ID, User ID, Id |
| Contact Feed | Feed Item Type, Created Date, Deleted, Last Modified Date, System Modstamp, Comment Count, Like Count, Title, Body, Link URL, Is Rich Text, Parent ID, Created By ID, Related Record ID, InsertedBy ID, Best Comment ID, Id |
| Contact Point Type Consents | Deleted, Name, Created Date, Last Modified Date, System Modstamp, Last Viewed Date, Last Referenced Date, Contact Point Type ID, Privacy Consent Status, Effective From, Effective To , Capture Date, Capture Contact Point Type, Capture Source, Double Consent Capture Date, Owner ID, Created By ID, Last Modified By ID, Party ID, Data Use Purpose ID, Party Role ID, Business Brand ID, Id |
| Contact Requests | Deleted, Contact Request Number, Currency ISO Code, Created Date, Last Modified Date, System Modstamp, Last Viewed Date, Last Referenced Date, Related To ID, Requestor ID, Preferred Phone Number, Preferred Channel, Request Status, Request Reason, Request Description, Owner ID, Created By ID, Last Modified By ID, Id |
| ContentDocument Feed | Feed Item Type, Created Date, Deleted, Last Modified Date, System Modstamp, Comment Count, Like Count, Title, Body, Link URL, Is Rich Text, Parent ID, Created By ID, Related Record ID, InsertedBy ID, Best Comment ID, Id |
| Content Folders | Deleted, Name, Currency ISO Code, Created Date, Last Modified Date, System Modstamp, Created By ID, Last Modified By ID, Parent Content Folder ID, Id |
| Contract Contact Role | Role, Primary, Created Date, Last Modified Date, System Modstamp, Deleted, Contract ID, Contact ID, Created By ID, Last Modified By ID, Id |
| Contract Feed | Feed Item Type, Created Date, Deleted, Last Modified Date, System Modstamp, Comment Count, Like Count, Title, Body, Link URL, Is Rich Text, Parent ID, Created By ID, Related Record ID, InsertedBy ID, Best Comment ID, Id |
| D&B Companies | Deleted, Primary Business Name, Currency ISO Code, Created Date, Last Modified Date, System Modstamp, Last Viewed Date, Last Referenced Date, D-U-N-S Number, Street Address, City, State, Postal Code, Country, Geocode Accuracy, Telephone Number, Facsimile Number, International Dialing Code, Ownership Type Indicator, Ticker Symbol, Stock Exchange, Annual Sales Volume, URL, Out Of Business Indicator, Number of Employees - Total, FIPS MSA Code, FIPS MSA Code Description, Primary Tradestyle, Year Started, Mailing Street Address, Mailing City, Mailing State, Mailing Postal Code, Mailing Country, Mailing Geocode Accuracy, Latitude, Longitude, Primary SIC Code, Primary SIC Description, Second SIC Code, Second SIC Description, Third SIC Code, Third SIC Description, Fourth SIC Code, Fourth SIC Description, Fifth SIC Code, Fifth SIC Description, Sixth SIC Code, Sixth SIC Description, Primary NAICS Code, Primary NAICS Description, Second NAICS Code, Second NAICS Description, Third NAICS Code, Third NAICS Description, Fourth NAICS Code, Fourth NAICS Description, Fifth NAICS Code, Fifth NAICS Description, Sixth NAICS Code, Sixth NAICS Description, Location Ownership Indicator, Number of Employees - Location, Number of Employees - Location Indicator, Annual Sales Volume Indicator, Local Currency Code, Legal Structure, Number of Employees - Global, Number of Employees - Total Indicator, Minority-Owned Indicator, Woman-Owned Indicator, Small Business Indicator, Marketing Segmentation Cluster, Import/Export, Subsidiary Indicator, Second Tradestyle, Third Tradestyle, Fourth Tradestyle, Fifth Tradestyle, National Identification Number, National Identification System, US Tax ID Number, Geocode Accuracy, Number of Business Family Members, Delinquency Risk, Global Ultimate D-U-N-S Number, Global Ultimate Business Name, Parent Company D-U-N-S Number, Parent Company Business Name, Domestic Ultimate D-U-N-S Number, Domestic Ultimate Business Name, Location Type, Local Currency ISO Code, Company Description, Fortune 1000 Rank, S&P 500, Location Size, Location Size Accuracy, Location Size Unit of Measure, Employee Growth, Annual Revenue Growth, Primary SIC8 Code, Primary SIC8 Description, Second SIC8 Code, Second SIC8 Description , Third SIC8 Code, Third SIC8 Description, Fourth SIC8 Code, Fourth SIC8 Description, Fifth SIC8 Code, Fifth SIC8 Description, Sixth SIC8 Code, Sixth SIC8 Description, Prior Year Number of Employees - Total, Prior Year Revenue, Created By ID, Last Modified By ID, Id |
| Dashboard Component Feed | Feed Item Type, Created Date, Deleted, Last Modified Date, System Modstamp, Comment Count, Like Count, Title, Body, Link URL, Is Rich Text, Parent ID, Created By ID, Related Record ID, InsertedBy ID, Best Comment ID, Id |
| Dashboard Feed | Feed Item Type, Created Date, Deleted, Last Modified Date, System Modstamp, Comment Count, Like Count, Title, Body, Link URL, Is Rich Text, Parent ID, Created By ID, Related Record ID, InsertedBy ID, Best Comment ID, Id |
| Data Assessment Field Metrics | Deleted, Data Assessment Field Metric, Currency ISO Code, Created Date, Last Modified Date, System Modstamp, Field Name, Number of Matched Records that have the same value for this field as Data.com, Number of Matched Records that have different value for this field than Data.com, Number of Matched Records that have blanks for this field, Number of Unmatched Records that have blanks for this field, Created By ID, Last Modified By ID, Data Assessment Metric ID, Id |
| Data Assessment Metrics | Deleted, Data Assessment Metric, Currency ISO Code, Created Date, Last Modified Date, System Modstamp, Total Number of Records to access, Number of Processed Records, Number of Matched Records, Number of Matched Records with different field values, Number of Unmatched Records, Number of Duplicates, Created By ID, Last Modified By ID, Id |
| Data Assessment Field Value Metrics | Deleted, Data Assessment Field Value Metric, Currency ISO Code, Created Date, Last Modified Date, System Modstamp, Field Value, Number of times this value appears in this field, Created By ID, Last Modified By ID, Data Assessment Field Metric ID, Id |
| Data Use Legal Bases | Deleted, Name, Created Date, Last Modified Date, System Modstamp, Last Viewed Date, Last Referenced Date, Source, Description, Owner ID, Created By ID, Last Modified By ID, Id |
| Data Use Purposes | Deleted, Name, Created Date, Last Modified Date, System Modstamp, Last Viewed Date, Last Referenced Date, Description, Can Data Subject Opt Out, Owner ID, Created By ID, Last Modified By ID, Legal Basis ID, Id |
| Dated Conversion Rate | Currency Code, Date, Next Start Date, Exchange Rate, Created Date, Last Modified Date, System Modstamp, Created By ID, Last Modified By ID, Id |
| Documents | Deleted, Document Name, Document Unique Name, Namespace Prefix, MIME Type, File Extension, Externally Available, Body Length, Body, Url, Description, Keywords, Internal Use Only, Created Date, Last Modified Date, System Modstamp, Document Content Searchable, Last Viewed Date, Last Referenced Date, Folder ID, Author ID, Created By ID, Last Modified By ID, Id |
| Duplicate Record Items | Deleted, Duplicate Record Item Name, Currency ISO Code, Created Date, Last Modified Date, System Modstamp, Created By ID, Last Modified By ID, Duplicate Record Set ID, Record ID, Id |
| Duplicate Record Sets | Deleted, Duplicate Record Set Name, Currency ISO Code, Created Date, Last Modified Date, System Modstamp, Last Viewed Date, Last Referenced Date, Record Count, Created By ID, Last Modified By ID, Duplicate Rule ID, Id |
| Email Messages | Created Date, Last Modified Date, System Modstamp, Text Body, HTML Body, Headers, Subject, Email Message Name, From Name, From Address, From, To Address, CC Address, BCC Address, Is Incoming, Has Attachment, Status, Message Date, Deleted, Is Externally Visible, Message ID, Thread ID, Client Thread ID, Is Client Managed, Is Tracked, Opened?, First Opened, Last Opened, Bounced?, Case ID, Activity ID, Created By ID, Last Modified By ID, Email Message ID, Related To ID, Email Template ID, Id |
| Email Message Relations | Relation Type, Relation Address, Relation Object Type, Created Date, System Modstamp, Deleted, Email Message ID, Relation ID, Created By ID, Id |
| Event Feed | Feed Item Type, Created Date, Deleted, Last Modified Date, System Modstamp, Comment Count, Like Count, Title, Body, Link URL, Is Rich Text, Parent ID, Created By ID, Related Record ID, InsertedBy ID, Best Comment ID, Id |
| Event Relations | Status, Response Date, Response, Created Date, Last Modified Date, System Modstamp, Deleted, Relation ID, Event ID, Created By ID, Last Modified By ID, Id |
| Expression Filters | Deleted, Expression Filter Name, Currency ISO Code, Created Date, Last Modified Date, System Modstamp, Filter Condition Logic, Filter Description, Created By ID, Last Modified By ID, Macro Instruction ID, Id |
| Expression Filter Criteria | Deleted, Expression Filter Criteria Name, Currency ISO Code, Created Date, Last Modified Date, System Modstamp, Filter Target, Context, Operation, Sort Order, Created By ID, Last Modified By ID, Expression Filter ID, Id |
| Feed Comments | Created Date, System Modstamp, Revision, Last Edit Date, Comment Body, Deleted, Comment Type, Is Rich Text, Is a Verified Comment, Has entity links, Status, Thread Level, Thread Children Count, Thread Last Updated Date, Feed Item ID, Parent ID, Created By ID, Last Edit By ID, InsertedBy ID, Related Record ID, Feed Comment ID, Id |
| Feed Items | Feed Item Type, Created Date, Deleted, Last Modified Date, System Modstamp, Revision, Last Edit Date, Comment Count, Like Count, Title, Body, Link URL, Is Rich Text, Has Content, Has Link, Has Feed Entity Attachment, Has Verified Comment, Is Closed, Status, Parent ID, Created By ID, Last Edit By ID, Related Record ID, InsertedBy ID, Best Comment ID, Id |
| Feed Revisions | Created Date, System Modstamp, Deleted, Revision, Action, Edited Attribute, Value, Is Value RichText, Created By ID, Feed Entity ID, Id |
| File Search Activity | Deleted, Search Activity Name, Currency ISO Code, Created Date, Last Modified Date, System Modstamp, Search Term, Search Date, Number of Searches, Number of Users, Average Number of Results, Duration, Language, Average Click Rank, Created By ID, Last Modified By ID, Id |
| Flow Interviews | Deleted, Name, Created Date, Last Modified Date, System Modstamp, Current Element, Interview Label, Pause Reason, Flow Interview Guid, Was Paused From Screen, Flow Version View ID, Interview Status, Owner ID, Created By ID, Last Modified By ID, Id |
| Flow Record Relations | Deleted, Name, Currency ISO Code, Created Date, Last Modified Date, System Modstamp, Created By ID, Last Modified By ID, Flow Interview ID, Record ID, Id |
| Flow Interview Stage Relations | Deleted, Name, Currency ISO Code, Created Date, Last Modified Date, System Modstamp, Stage Order, Stage Type, Stage Label, Flex Index, Created By ID, Last Modified By ID, Flow Interview ID, Id |
| Forecasting Owner Adjustments | Deleted, Currency ISO Code, Created Date, Last Modified Date, System Modstamp, Owner Adjusted Amount, Owner Adjusted Quantity, Owner Adjustment Note, Period Start Date, Product Family, Forecasting Item Category, Forecast Category, Is Quantity, Is Amount, Created By ID, Last Modified By ID, Forecasting Item ID, Period ID, User ID, Forecasting Type ID, Id |
| Ideas | Deleted, Title, Currency ISO Code, Created Date, Last Modified Date, System Modstamp, Last Viewed Date, Last Referenced Date, Idea Body, Number of Comments, Vote Score, Vote Total, Categories, Status, Last Idea Comment Date, IsHtml, Is Merged, URL of Creator's Profile Photo, URL of Creator's Thumbnail Photo, Name of Creator, Record Type ID, Created By ID, Last Modified By ID, Zone ID, Idea Comment ID, Idea ID, Id |
| Images | Deleted, Name, Currency ISO Code, Created Date, Last Modified Date, System Modstamp, Last Viewed Date, Last Referenced Date, Image Orientation, Active, Category, Image Type, Camera Angle, Title, Accessibility Text, URL, Owner ID, Created By ID, Last Modified By ID, Content Document ID, Id |
| Individuals | Deleted, Last Name, First Name, Salutation, Name, Don't Track, Don't Profile, Don't Process, Don't Market, Forget this Individual, Export Individual's Data, OK to Store PII Data Elsewhere, Block Geolocation Tracking, Birth Date, Death Date, Conviction Count, Number of Children, Military Service, Is Homeowner, Occupation, Website, Individual's Age, Last Viewed Date, Consumer Credit Score, Consumer Credit Score Provider Name, Influencer Rating, Created Date, Last Modified Date, System Modstamp, Owner ID, Master Record ID, Created By ID, Last Modified By ID, Id |
| Installed Mobile Apps | Deleted, Installed Mobile App Name, Currency ISO Code, Created Date, Last Modified Date, System Modstamp, Status, Version, Created By ID, Last Modified By ID, User ID, Connected Application ID, Id |
| Lead Clean Info | Deleted, Lead Clean Info Name, Currency ISO Code, Created Date, Last Modified Date, System Modstamp, Last Matched Date, Last Status Changed Date, Contact Status in Salesforce, First Name, Last Name, Email, Phone, Street, City, State, Zip, Country, Latitude, Longitude, Geocode Accuracy, Title, Annual Revenue, Number of Employees, Industry, Company Name, Company D-U-N-S Number, Contact Status per Data.com, Name is Reviewed, Email is Reviewed, Phone is Reviewed, Address is Reviewed, Title is Reviewed, Annual Revenue is Reviewed, Number of Employees is Reviewed, Industry is Reviewed, Company Name is Reviewed, Company D-U-N-S Number is Reviewed, D&B Company D-U-N-S Number is Reviewed, First Name is Different, Last Name is Different, Email is Different, Phone is Different, Street is Different, City is Different, State is Different, ZIP is Different, Country is Different, Title is Different, Annual Revenue is Different, Number of Employees is Different, Industry is Different, Company Name is Different, Company D-U-N-S Number is Different, D&B Company D-U-N-S Number is Different, State Code is Different, Country Code is Different, Cleaned by Job, Cleaned by User, D&B Company D-U-N-S Number, Data.com Company ID, Name is Flagged Wrong, Email is Flagged Wrong, Phone is Flagged Wrong, Address is Flagged Wrong, Title is Flagged Wrong, Annual Revenue is Flagged Wrong, Number of Employees is Flagged Wrong, Industry is Flagged Wrong, Company Name is Flagged Wrong, Company D-U-N-S Number is Flagged Wrong, Data.com ID, Created By ID, Last Modified By ID, Lead ID, User ID, Id |
| Lead Feed | Feed Item Type, Created Date, Deleted, Last Modified Date, System Modstamp, Comment Count, Like Count, Title, Body, Link URL, Is Rich Text, Parent ID, Created By ID, Related Record ID, InsertedBy ID, Best Comment ID, Id |
| List Emails | Deleted, Name, Currency ISO Code, Created Date, Last Modified Date, System Modstamp, Last Viewed Date, Last Referenced Date, Subject, Html Body, Text Body, From Name, From Address, Status, Has Attachment, Scheduled Date, Total Sent, Is Tracked, Owner ID, Created By ID, Last Modified By ID, Campaign ID, Id |
| List Email Individual Recipients | Deleted, Name, Currency ISO Code, Created Date, Last Modified Date, System Modstamp, Created By ID, Last Modified By ID, List Email ID, Recipient ID, Id |
| List Email Recipient Sources | Deleted, Name, Currency ISO Code, Created Date, Last Modified Date, System Modstamp, Type, Created By ID, Last Modified By ID, List Email ID, SourceList ID, Id |
| Macros | Deleted, Macro Name, Currency ISO Code, Created Date, Last Modified Date, System Modstamp, Last Viewed Date, Last Referenced Date, Description, Supports Classic, Supports Lightning, Apply To, Owner ID, Created By ID, Last Modified By ID, Id |
| Macro Instructions | Deleted, Macro Instruction Name, Currency ISO Code, Created Date, Last Modified Date, System Modstamp, Operation, Target, Value, Value Record ID, Sort Order, Created By ID, Last Modified By ID, Macro ID, Id |
| Mail Merge Template | Deleted, Name, Description, File, Body Length, Body, Last Used Date, Created Date, Last Modified Date, System Modstamp, Attachment has been scanned for XSS, XSS threat was detected in the attachment, Attachment has been scanned for Flash Injection, Flash Injection was detected in the attachment, Created By ID, Last Modified By ID, Id |
| Notes | Deleted, Title, Private, Body, Created Date, Last Modified Date, System Modstamp, Parent ID, Owner ID, Created By ID, Last Modified By ID, Id |
| Opportunity: Competitor | Competitor Name, Strengths, Weaknesses, Created Date, Last Modified Date, System Modstamp, Deleted, Opportunity ID, Created By ID, Last Modified By ID, Id |
| Opportunity Contact Role | Role, Primary, Created Date, Last Modified Date, System Modstamp, Deleted, Currency ISO Code, Opportunity ID, Contact ID, Created By ID, Last Modified By ID, Id |
| Opportunity Feed | Feed Item Type, Created Date, Deleted, Last Modified Date, System Modstamp, Comment Count, Like Count, Title, Body, Link URL, Is Rich Text, Parent ID, Created By ID, Related Record ID, InsertedBy ID, Best Comment ID, Id |
| Line Item Schedule | Type, Revenue, Quantity, Comments, Schedule Date, Currency ISO Code, Created Date, Last Modified Date, System Modstamp, Deleted, Line Item ID, Created By ID, Last Modified By ID, Id |
| Order Feed | Feed Item Type, Created Date, Deleted, Last Modified Date, System Modstamp, Comment Count, Like Count, Title, Body, Link URL, Is Rich Text, Parent ID, Created By ID, Related Record ID, InsertedBy ID, Best Comment ID, Id |
| Order Product Feed | Feed Item Type, Created Date, Deleted, Last Modified Date, System Modstamp, Comment Count, Like Count, Title, Body, Link URL, Is Rich Text, Parent ID, Created By ID, Related Record ID, InsertedBy ID, Best Comment ID, Id |
| Org Delete Requests | Deleted, Name, Currency ISO Code, Created Date, Last Modified Date, System Modstamp, Request Type, Owner ID, Created By ID, Last Modified By ID, Id |
| Partner | Role, Primary, Created Date, Last Modified Date, System Modstamp, Deleted, Opportunity ID, Accounts From ID, Accounts To ID, Created By ID, Last Modified By ID, Reverse Partner ID, Id |
| Process Instance Node | Deleted, Created Date, Last Modified Date, System Modstamp, Node Status, Completed Date, Name, Elapsed Time in Days, Elapsed Time in Hours, Elapsed Time in Minutes, Created By ID, Last Modified By ID, Process Instance ID, Process Node ID, User ID, Id |
| Product Feed | Feed Item Type, Created Date, Deleted, Last Modified Date, System Modstamp, Comment Count, Like Count, Title, Body, Link URL, Is Rich Text, Parent ID, Created By ID, Related Record ID, InsertedBy ID, Best Comment ID, Id |
| Product Consumption Schedules | Deleted, Currency ISO Code, Created Date, Last Modified Date, System Modstamp, Created By ID, Last Modified By ID, Product ID, Consumption Schedule ID, Id |
| Quick Text | Deleted, Quick Text Name, Currency ISO Code, Created Date, Last Modified Date, System Modstamp, Last Viewed Date, Last Referenced Date, Message, Category, Channel, Include in selected channels, Source Entity Type, Owner ID, Created By ID, Last Modified By ID, Id |
| Quote PDFs | Name, PDF Document, Currency ISO Code, Grand Total, Discount, Deleted, Created Date, Last Modified Date, System Modstamp, Quote ID, Content Version ID, Created By ID, Last Modified By ID, Id |
| Quote Feed | Feed Item Type, Created Date, Deleted, Last Modified Date, System Modstamp, Comment Count, Like Count, Title, Body, Link URL, Is Rich Text, Parent ID, Created By ID, Related Record ID, InsertedBy ID, Best Comment ID, Id |
| Recommendations | Deleted, Name, Currency ISO Code, Created Date, Last Modified Date, System Modstamp, Last Viewed Date, Last Referenced Date, Action, Description, Acceptance Label, Rejection Label, Is Action Active, External Id, RecommendationResponse Identifier, Created By ID, Last Modified By ID, Asset File ID, Id |
| RecordActions | Deleted, Currency ISO Code, Created Date, Last Modified Date, System Modstamp, Flow Definition ID, Order, Status, Pinned, Action Type, Action Definition, Is Mandatory, Hide Remove Action in UI, Created By ID, Last Modified By ID, Parent Record ID, Flow Interview ID, Id |
| Report Feed | Feed Item Type, Created Date, Deleted, Last Modified Date, System Modstamp, Comment Count, Like Count, Title, Body, Link URL, Is Rich Text, Parent ID, Created By ID, Related Record ID, InsertedBy ID, Best Comment ID, Id |
| Custom S-Controls | Label, S-Control Name, Description, Encoding, HTML Body, Filename, Binary Length, Binary, Type, Prebuild In Page, Namespace Prefix, Created Date, Last Modified Date, System Modstamp, Deleted, Created By ID, Last Modified By ID, Id |
| Search Promotion Rules | Deleted, Created Date, Last Modified Date, System Modstamp, Term, Created By ID, Last Modified By ID, Id |
| Site | Feed Item Type, Created Date, Deleted, Last Modified Date, System Modstamp, Comment Count, Like Count, Title, Body, Link URL, Is Rich Text, Parent ID, Created By ID, Related Record ID, InsertedBy ID, Best Comment ID, Id |
| Solutions | Deleted, Solution Number, Title, Public, Visible in Public Knowledge Base, Status, Reviewed, Description, Created Date, Last Modified Date, System Modstamp, Num Related Cases, Currency ISO Code, Last Viewed Date, Last Referenced Date, Is Html, Owner ID, Created By ID, Last Modified By ID, Id |
| Solution Feed | Feed Item Type, Created Date, Deleted, Last Modified Date, System Modstamp, Comment Count, Like Count, Title, Body, Link URL, Is Rich Text, Parent ID, Created By ID, Related Record ID, InsertedBy ID, Best Comment ID, Id |
| Streaming Channels | Is Deleted, Streaming Channel Name, Currency ISO Code, Created Date, Last Modified Date, System Modstamp, Last Viewed Date, Last Referenced Date, Is Dynamically Created, Description, Owner ID, Created By ID, Last Modified By ID, Id |
| Task Feed | Feed Item Type, Created Date, Deleted, Last Modified Date, System Modstamp, Comment Count, Like Count, Title, Body, Link URL, Is Rich Text, Parent ID, Created By ID, Related Record ID, InsertedBy ID, Best Comment ID, Id |
| Goals | Deleted, Name, Currency ISO Code, Created Date, Last Modified Date, System Modstamp, Value, Owner ID, Created By ID, Last Modified By ID, User ID, Id |
| Topic Assignments | Record Key Prefix, Object Type, Created Date, Deleted, System Modstamp, Topic ID, Entity ID, Created By ID, Id |
| Topic Feed | Feed Item Type, Created Date, Deleted, Last Modified Date, System Modstamp, Comment Count, Like Count, Title, Body, Link URL, Is Rich Text, Parent ID, Created By ID, Related Record ID, InsertedBy ID, Best Comment ID, Id |
| Last Used App | Deleted, Currency ISO Code, Created Date, Last Modified Date, System Modstamp, Form Factor, Created By ID, Last Modified By ID, User ID, App Definition ID, Id |
| UserAppMenuCustomizations | Deleted, Currency ISO Code, Created Date, Last Modified Date, System Modstamp, Sort Order, Owner ID, Created By ID, Last Modified By ID, Application ID, Id |
| User Email Preferred People | Deleted, User Email Preferred Person Name, Currency ISO Code, Created Date, Last Modified Date, System Modstamp, Email, Owner ID, Created By ID, Last Modified By ID, Person Record ID, Id |
| User Feed | Feed Item Type, Created Date, Deleted, Last Modified Date, System Modstamp, Comment Count, Like Count, Title, Body, Link URL, Is Rich Text, Parent ID, Created By ID, Related Record ID, InsertedBy ID, Best Comment ID, Id |
| User Provisioning Accounts | Deleted, Name, Created Date, Last Modified Date, System Modstamp, External User Id, External Username, External Email, External First Name, External Last Name, Link State, Status, Deleted Date, Manual Override, Created By ID, Last Modified By ID, User ID, Connected App ID, Id |
| User Provisioning Account Stagings | Deleted, Name, Created Date, Last Modified Date, System Modstamp, External User Id, External Username, External Email, External First Name, External Last Name, Link State, Status, Created By ID, Last Modified By ID, Connected App ID, User ID, Id |
| User Provisioning Mock Targets | Deleted, Name, Created Date, Last Modified Date, System Modstamp, External User Id, External Username, External Email, External First Name, External Last Name, Created By ID, Last Modified By ID, Id |
| User Provisioning Logs | Deleted, Name, Created Date, Last Modified Date, System Modstamp, External User Id, External Username, Status, Details, Created By ID, Last Modified By ID, User Provisioning Request ID, User ID, Id |
| User Provisioning Requests | Deleted, Name, Created Date, Last Modified Date, System Modstamp, External User Id, App Name, State, Operation, Scheduled Provisioning Time, Approval Status, Retry Count, Owner ID, Created By ID, Last Modified By ID, User ID, Connected App ID, User Provisioning Configuration ID, User Provisioning Account ID, User ID, User Provisioning Request ID, Id |
| Work Capacity Limits | Deleted, Limit Number, Currency ISO Code, Created Date, Last Modified Date, System Modstamp, Last Viewed Date, Last Referenced Date, Limitation Value, Description, Start Date, End Date, Time Period, Active, Service Appointment Field, Field Value, Limitation Units, Monday, Tuesday, Wednesday, Thursday, Friday, Saturday, Sunday, Owner ID, Created By ID, Last Modified By ID, Territory ID, Id |
| Work Capacity Limit Feed | Feed Item Type, Created Date, Deleted, Last Modified Date, System Modstamp, Comment Count, Like Count, Title, Body, Link URL, Is Rich Text, Parent ID, Created By ID, Related Record ID, InsertedBy ID, Best Comment ID, Id |
| Work Capacity Usages | Deleted, Usage Number, Currency ISO Code, Created Date, Last Modified Date, System Modstamp, Last Viewed Date, Last Referenced Date, Service Appointment Field, Field Value, Start Date, End Date, Limitation Units, Limitation (in hours), Time Consumed (in minutes), Time Period, Wcu Unique Field1, Wcu Unique Field2, Owner ID, Created By ID, Last Modified By ID, Territory ID, Id |
| Work Capacity Usage Feed | Feed Item Type, Created Date, Deleted, Last Modified Date, System Modstamp, Comment Count, Like Count, Title, Body, Link URL, Is Rich Text, Parent ID, Created By ID, Related Record ID, InsertedBy ID, Best Comment ID, Id |
| Work Orders | Deleted, Work Order Number, Currency ISO Code, Created Date, Last Modified Date, System Modstamp, Last Viewed Date, Last Referenced Date, Street, City, State/Province, Zip/Postal Code, Country, Latitude, Longitude, Geocode Accuracy, Description, Start Date, End Date, Subject, Status, Priority, Tax, Subtotal, Total Price, Line Items, Discount, Grand Total, Is Closed, Duration, Duration Type, Duration in Minutes, Service Appointment Count, Status Category, Suggested Maintenance Date, Minimum Crew Size, Recommended Crew Size, Generated from maintenance plan, Service Report Language, Is Fill In Candidate, Prevent Geocoding For Chatter Actions, Scheduling Priority, Owner ID, Created By ID, Last Modified By ID, Accounts, Contact ID, Case ID, Asset ID, Root Work Order ID, Price Book ID, Parent Work Order ID, Business Hours ID, Work Type ID, Territory ID, Location ID, Maintenance Plan ID, Service Report Layout ID, Return Order Line Item ID, Return Order ID, Visiting Hours, Id |
| Work Order Feed | Feed Item Type, Created Date, Deleted, Last Modified Date, System Modstamp, Comment Count, Like Count, Title, Body, Link URL, Is Rich Text, Parent ID, Created By ID, Related Record ID, InsertedBy ID, Best Comment ID, Id |
| Work Order Line Items | Deleted, Work Order Line Item Number, Currency ISO Code, Created Date, Last Modified Date, System Modstamp, Last Viewed Date, Last Referenced Date, Description, Start Date, End Date, Status, Quantity, Unit Price, Discount, List Price, Subtotal, Total Price, Duration, Duration Type, Duration in Minutes, Street, City, State/Province, Zip/Postal Code, Country, Latitude, Longitude, Geocode Accuracy, Subject, Status Category, Is Closed, Priority, Service Appointment Count, Minimum Crew Size, Recommended Crew Size, Suggested Maintenance Date, Generated from maintenance plan, Is Fill In Candidate, Created By ID, Last Modified By ID, Work Order ID, Parent Work Order Line Item ID, Product ID, Asset ID, Order ID, Root Work Order Line Item ID, Product ID, Work Type ID, Territory ID, Location ID, Service Report Layout ID, Return Order Line Item ID, Return Order ID, Maintenance Plan ID, Visiting Hours, Id |
| Work Order Line Item Feed | Feed Item Type, Created Date, Deleted, Last Modified Date, System Modstamp, Comment Count, Like Count, Title, Body, Link URL, Is Rich Text, Parent ID, Created By ID, Related Record ID, InsertedBy ID, Best Comment ID, Id |
| Work Types | Deleted, Work Type Name, Currency ISO Code, Created Date, Last Modified Date, System Modstamp, Last Viewed Date, Last Referenced Date, Description, Estimated Duration, Duration Type, Duration in Minutes, Auto-Create Service Appointment, Minimum Crew Size, Recommended Crew Size, Due Date Offset, Exact Appointments, Owner ID, Created By ID, Last Modified By ID, Service Report Layout ID, Id |
| Work Type Feed | Feed Item Type, Created Date, Deleted, Last Modified Date, System Modstamp, Comment Count, Like Count, Title, Body, Link URL, Is Rich Text, Parent ID, Created By ID, Related Record ID, InsertedBy ID, Best Comment ID, Id |
| Work Type Groups | Deleted, Work Type Group Name, Currency ISO Code, Created Date, Last Modified Date, System Modstamp, Last Viewed Date, Last Referenced Date, Description, Group Type, Active, Owner ID, Created By ID, Last Modified By ID, Id |
| Work Type Group Feed | Feed Item Type, Created Date, Deleted, Last Modified Date, System Modstamp, Comment Count, Like Count, Title, Body, Link URL, Is Rich Text, Parent ID, Created By ID, Related Record ID, InsertedBy ID, Best Comment ID, Id |
| Work Type Group Members | Deleted, Work Type Group Member Name, Currency ISO Code, Created Date, Last Modified Date, System Modstamp, Last Viewed Date, Last Referenced Date, Created By ID, Last Modified By ID, Work Type ID, Work Type Group ID, Id |
| Work Type Group Member Feed | Feed Item Type, Created Date, Deleted, Last Modified Date, System Modstamp, Comment Count, Like Count, Title, Body, Link URL, Is Rich Text, Parent ID, Created By ID, Related Record ID, InsertedBy ID, Best Comment ID, Id |
Note: In addition to the standard Salesforce modules, you can sync up to five custom tabs (user-created tabs) from your Salesforce account.