Reports
REPORTS
You can track your previous sessions with ease using Reports. You can choose from a wide range of custom views to visually analyze your remote support details better. View, analyze and download remote session details for sessions carried out over the past few months and more. You can drop out manual analysis and use our reports for better monitoring and planning.
Reports allow you to
- Filter data based on session type, duration, and Technician.
- Download reports in CSV format.
- View and update session notes.
Steps
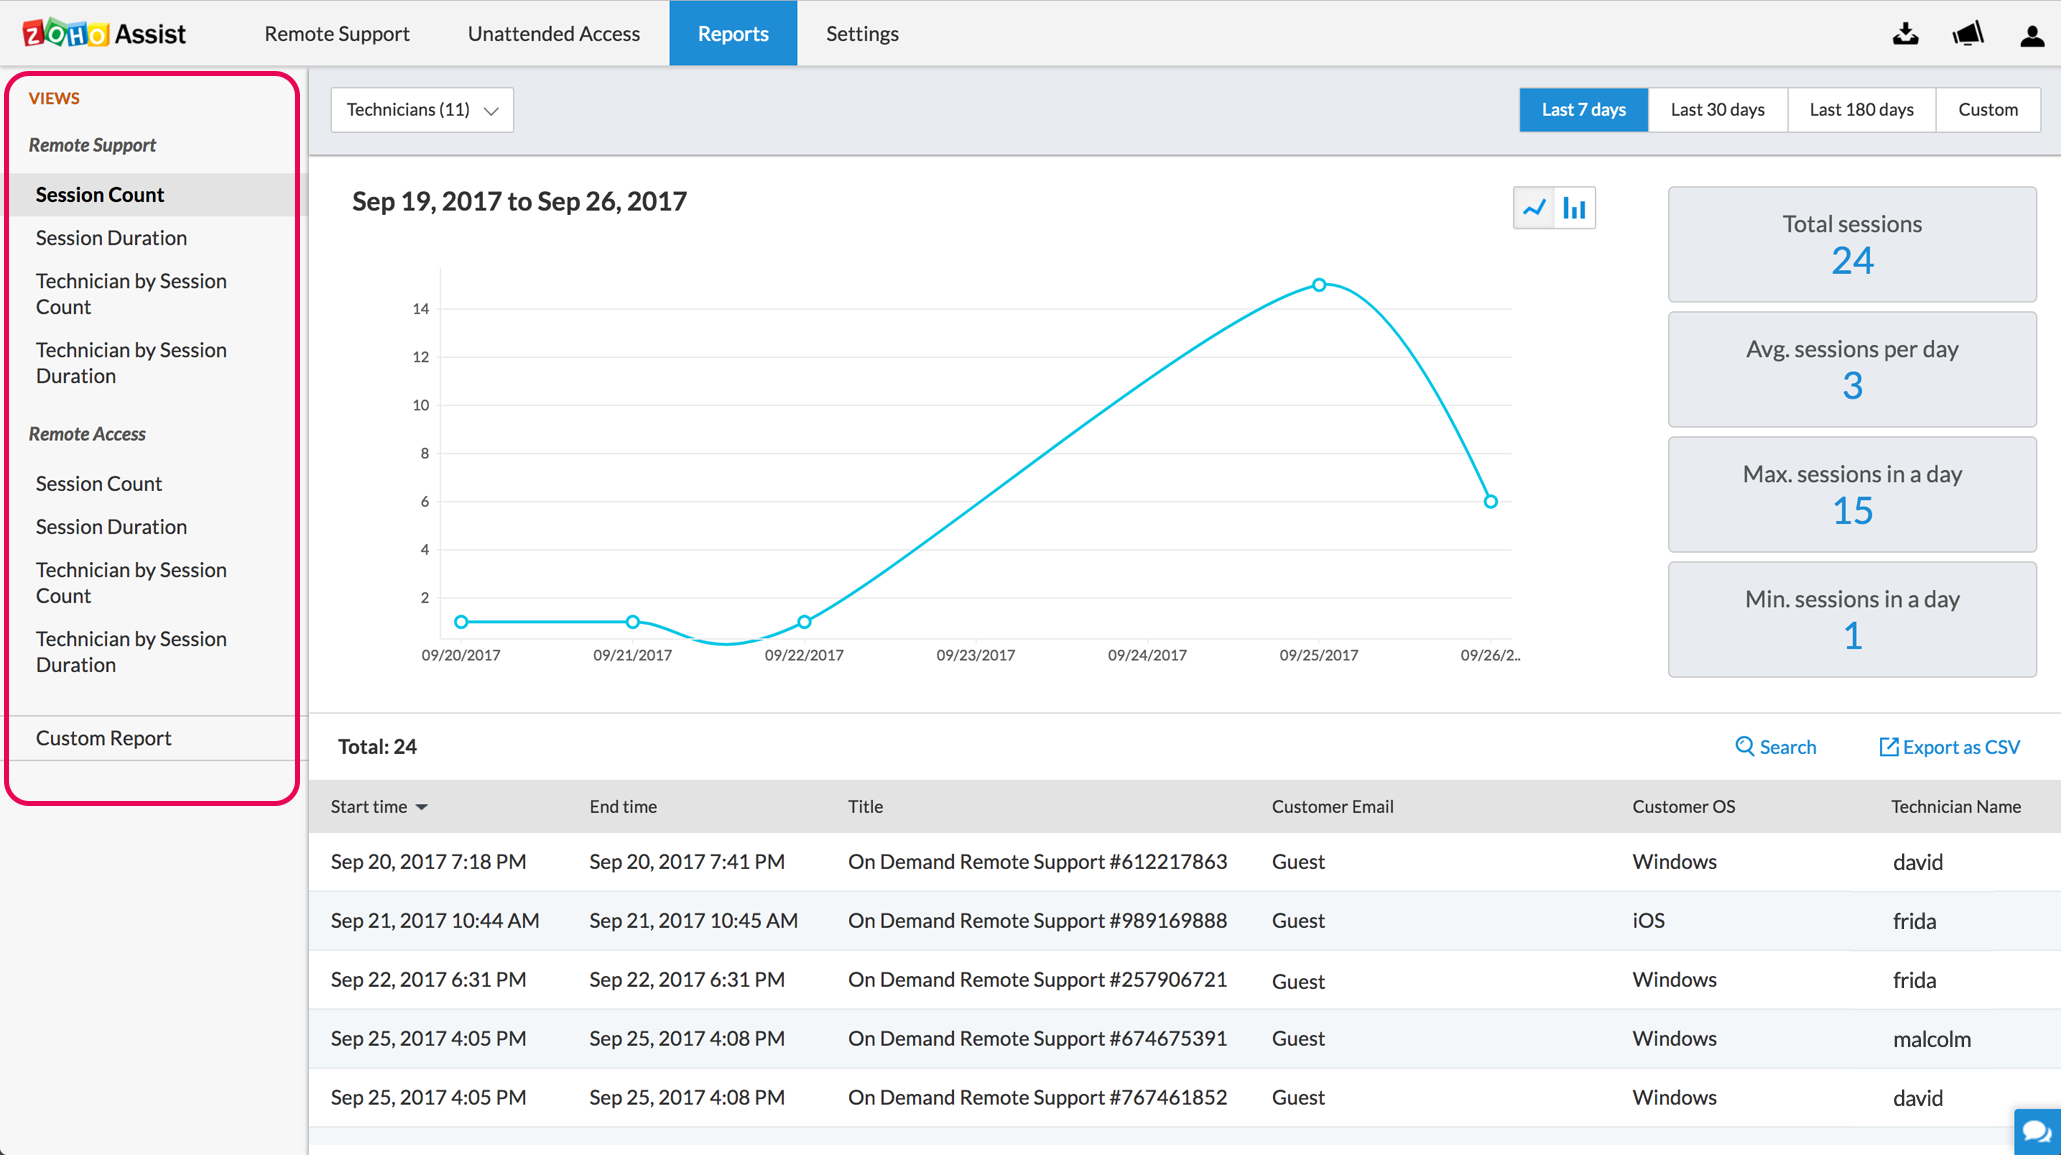
- Choose Reports from the top menu bar.
- Choose any one of the views segregated based on the session count, session duration and the technician from the left-hand sidebar.
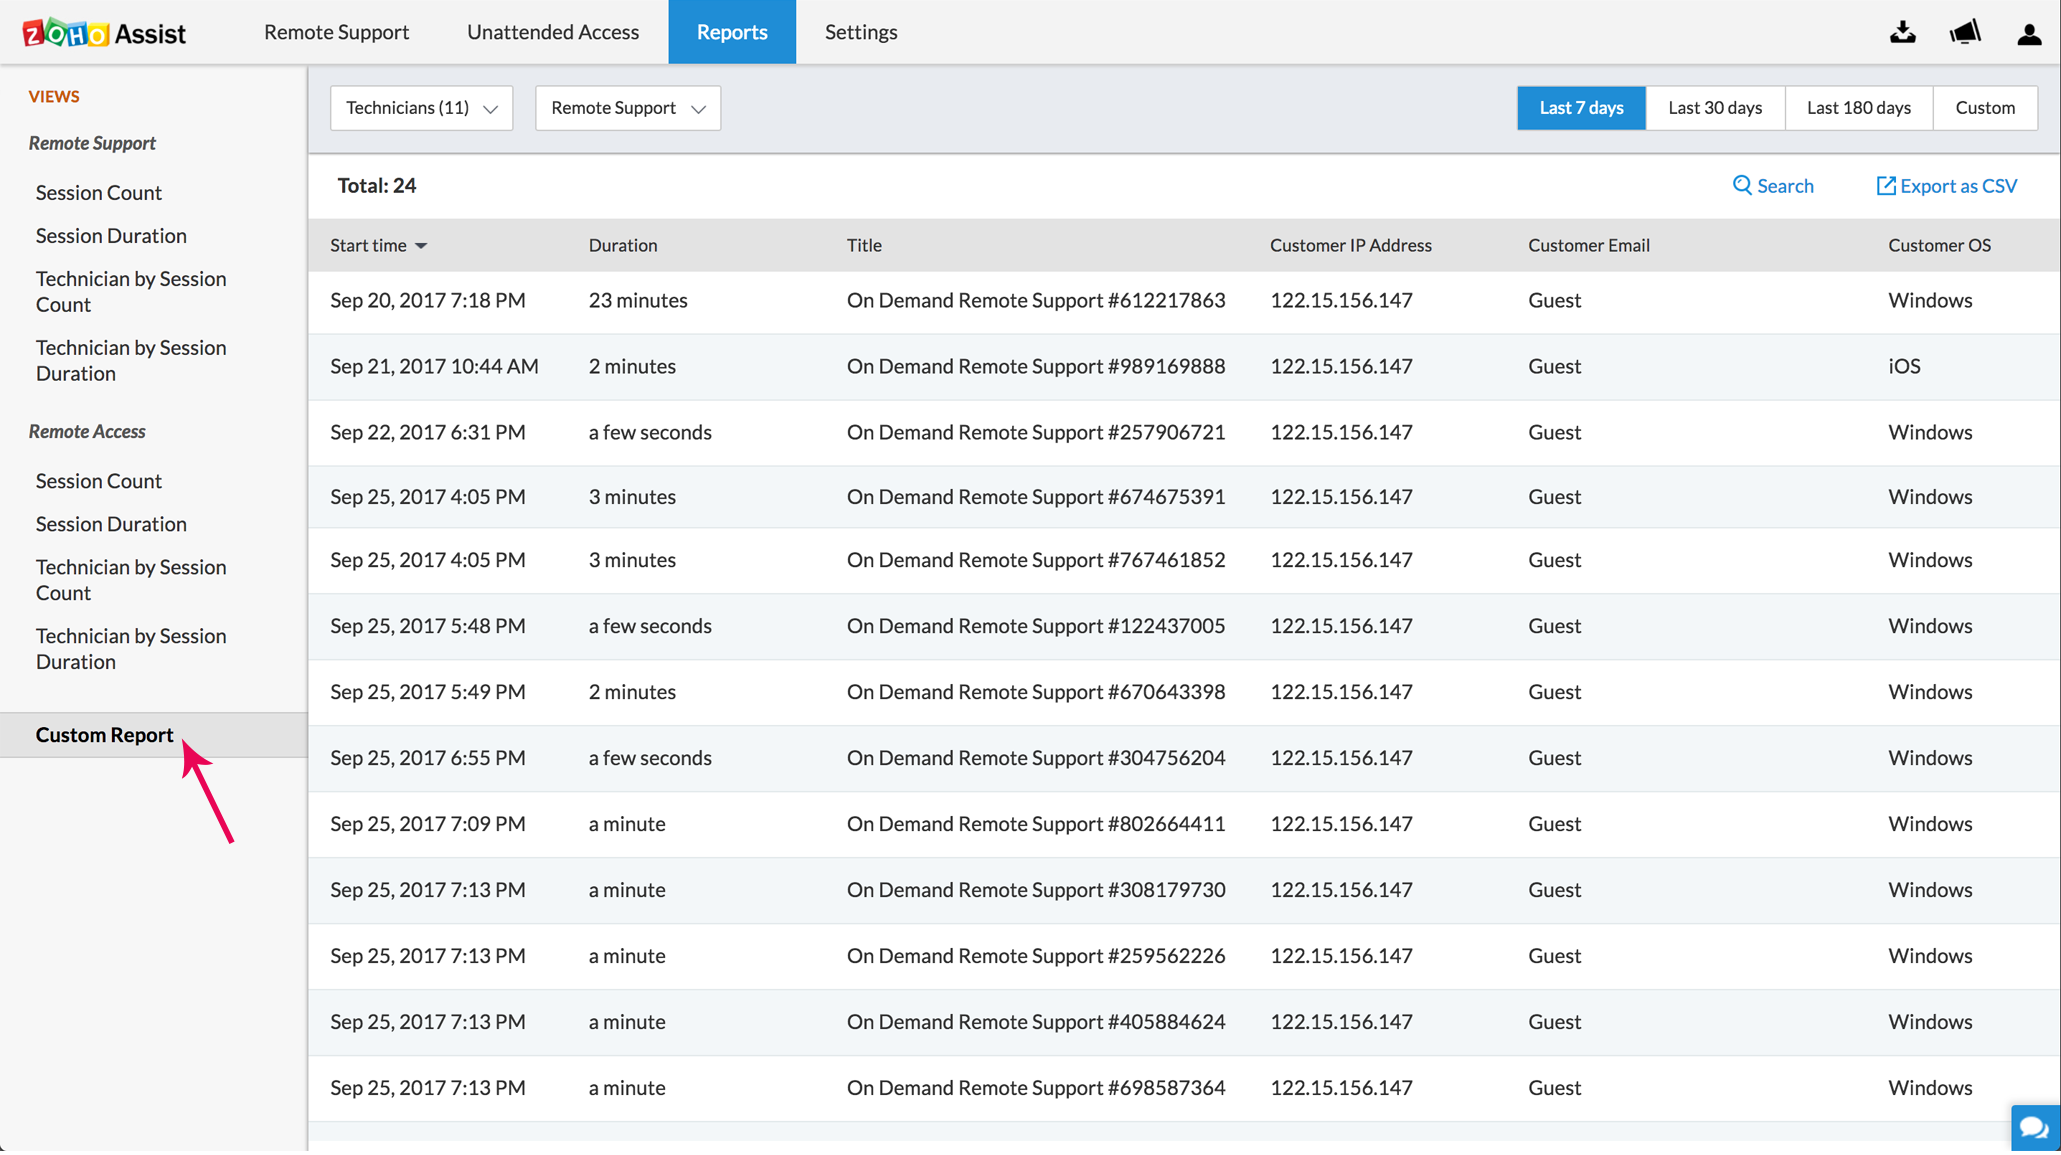
- Select Custom Report by choosing the technician type, type of session conducted and the time-period. You can even search column-wise for specific IP address, customer email, and customer OS.
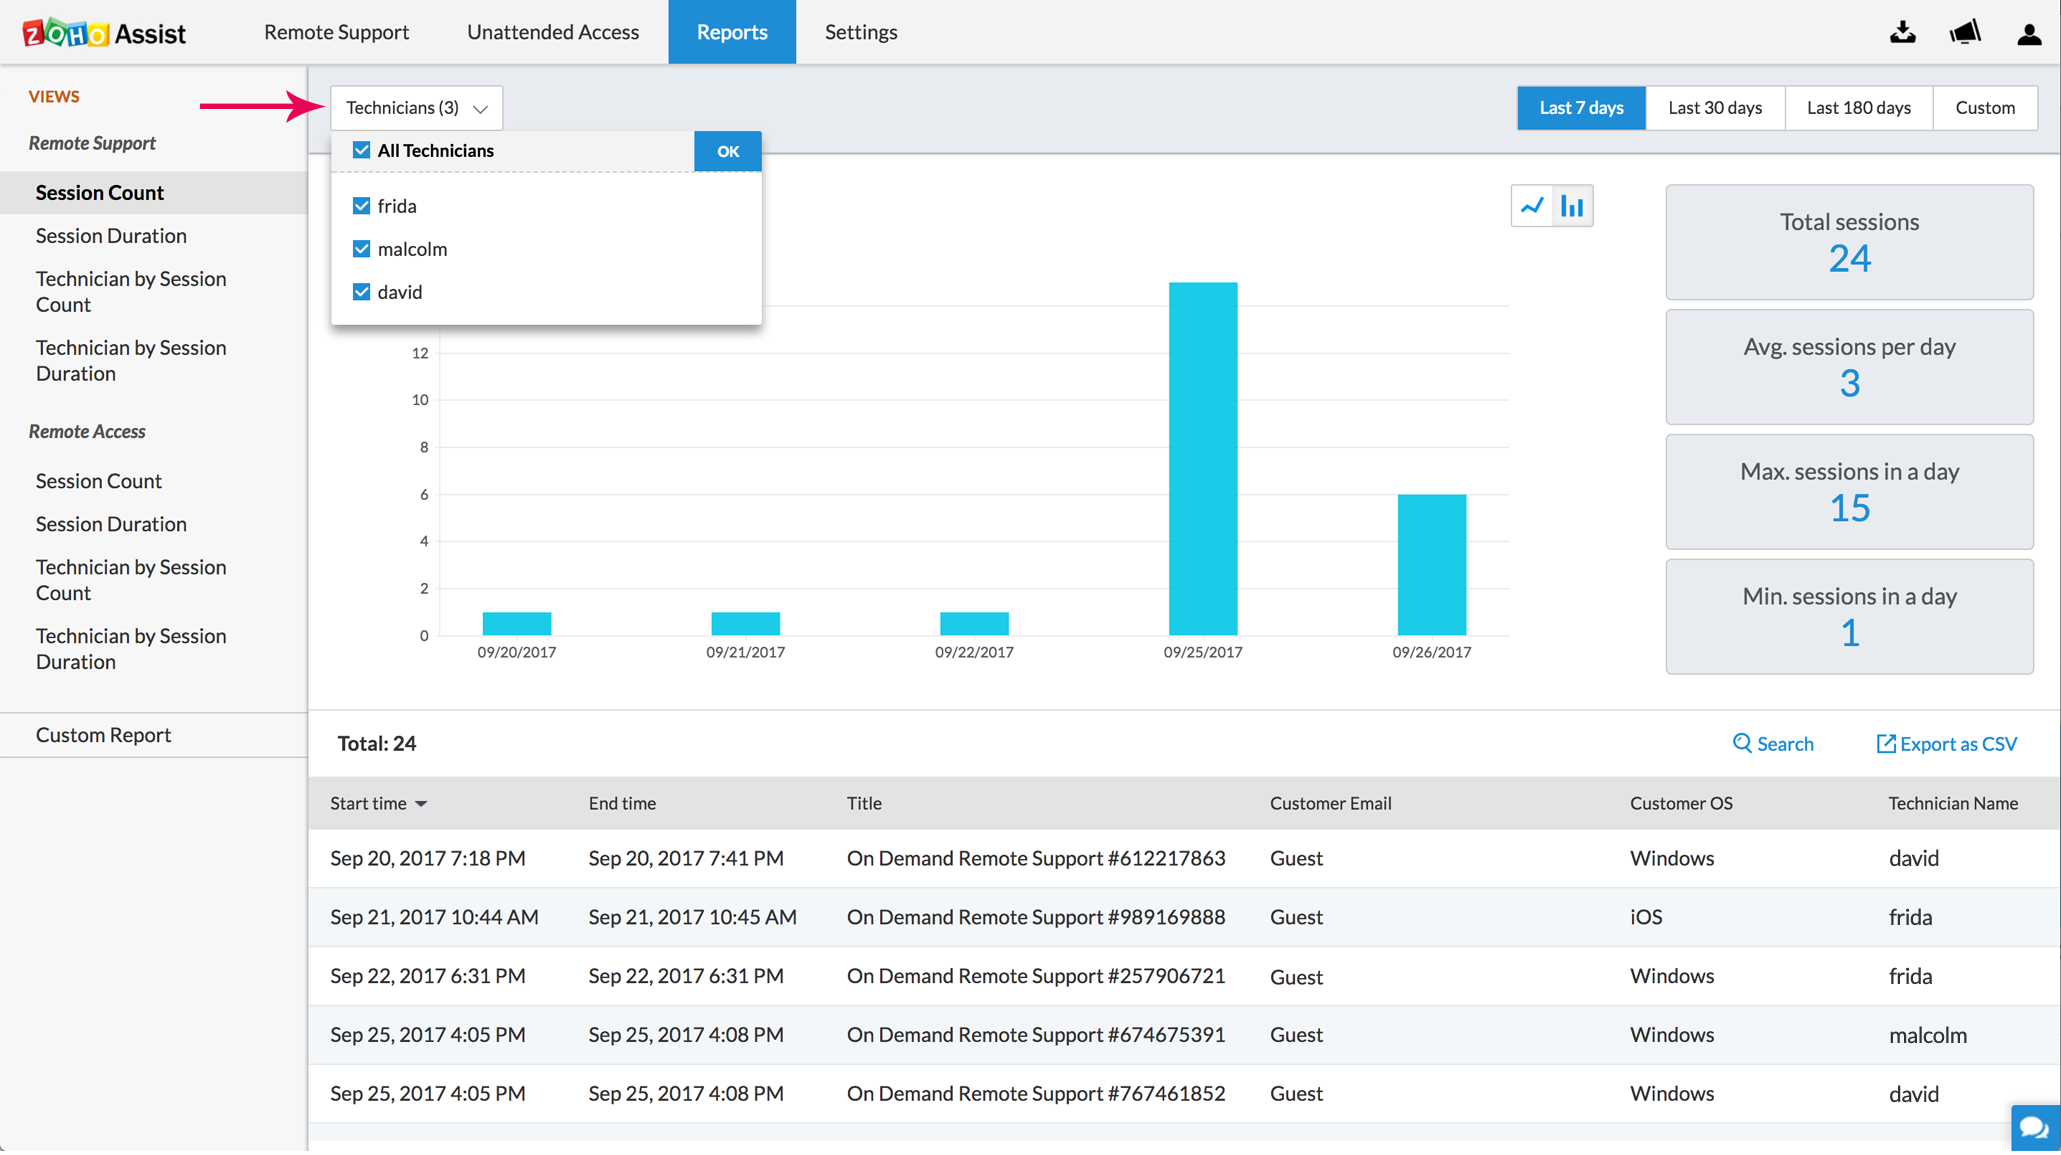
- Click on All Technicians and choose the Technician/s of your choice to view technician specific support session details.
- Choose the time-period for which you want to view the session report. You can also specify a custom time range within which you can view the session details.
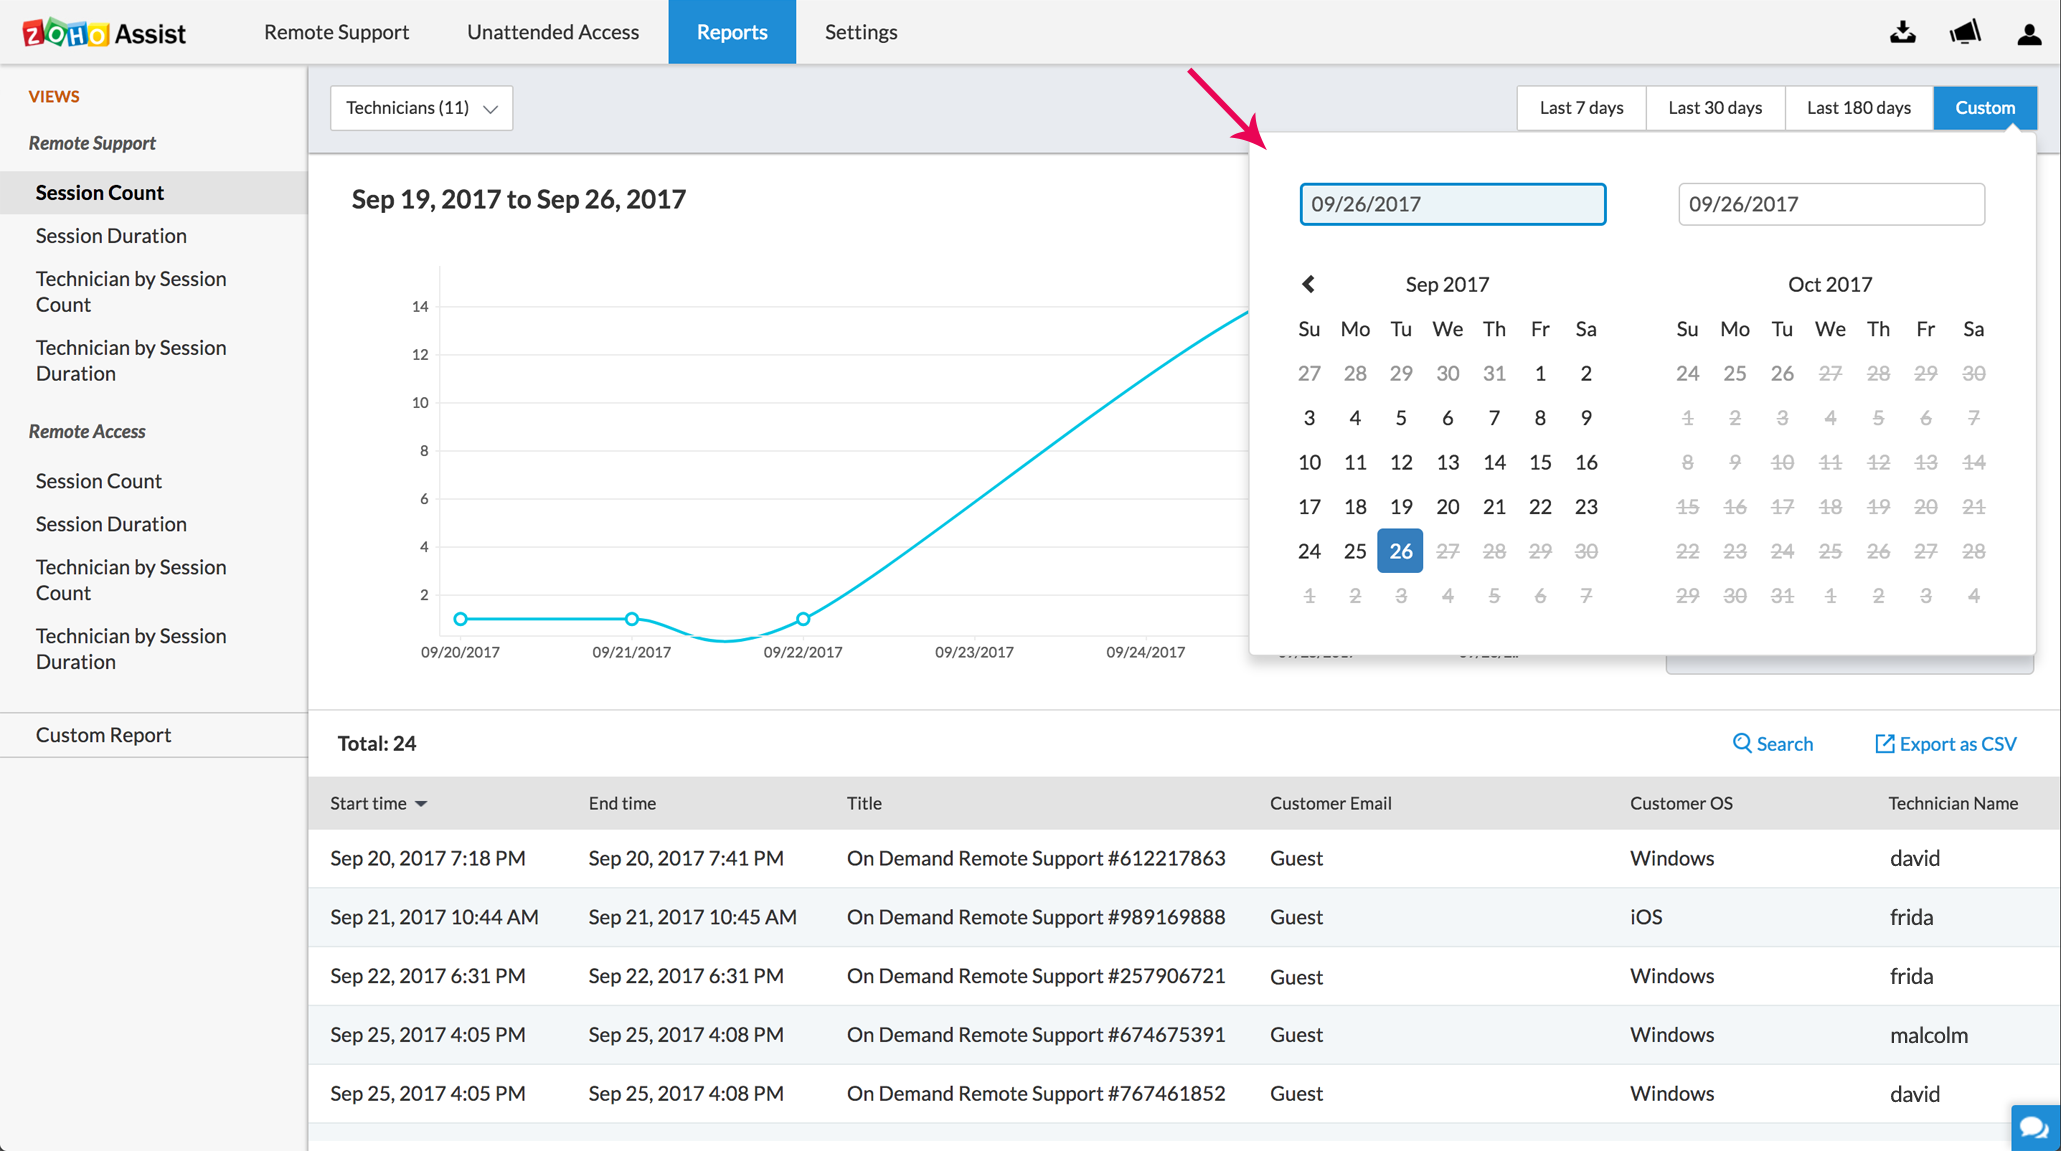
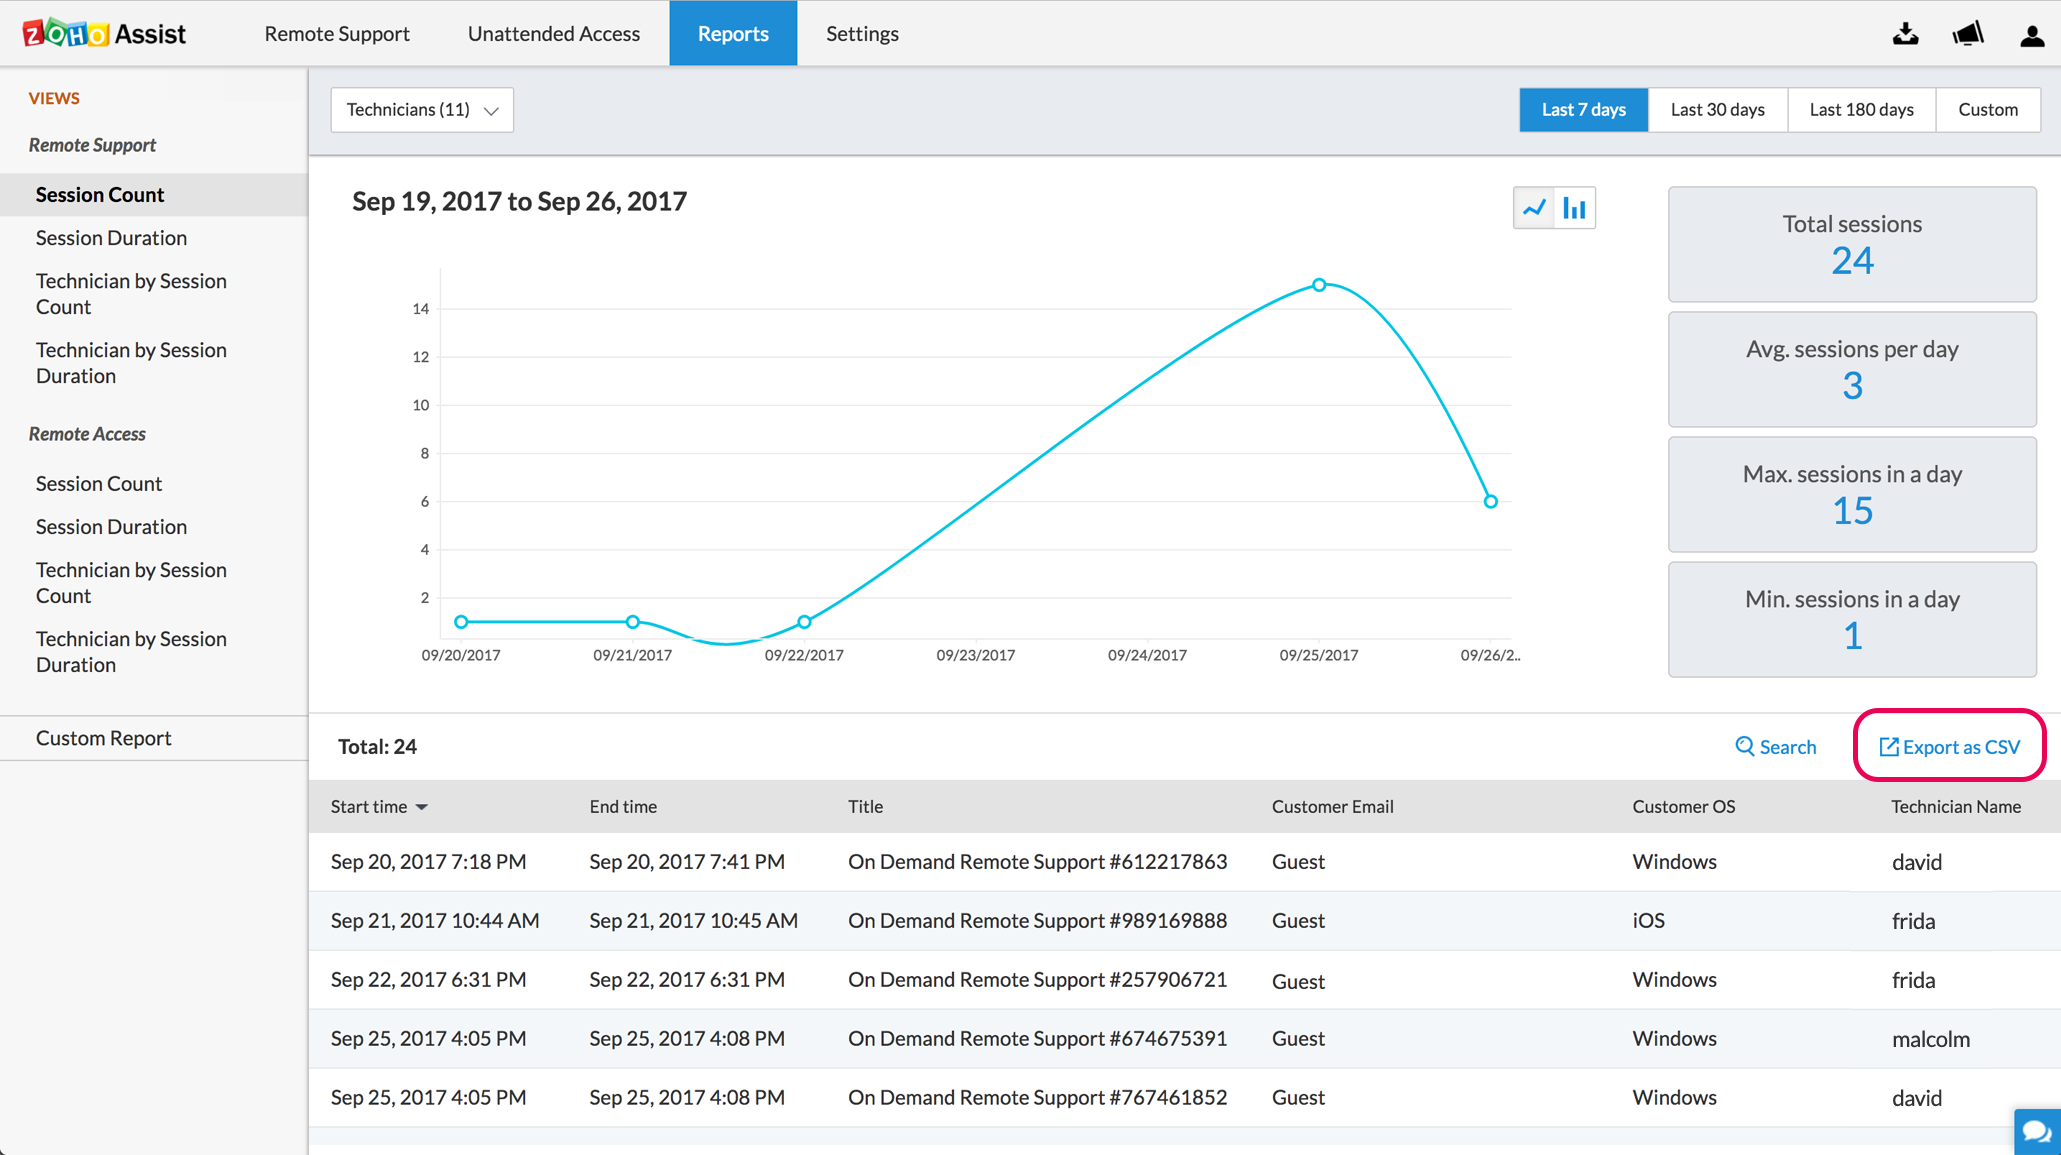
- You can download the generated reports for future reference by clicking on Export as CSV.