The Contacts Analytics page gives you a complete picture of your contact base at a glance. From tracking how your audience has grown over time to understanding where your contacts are coming from, this page consolidates all the key metrics you need to make smarter decisions about your contact management strategy.
To access this page, go to Analytics in the main navigation and select Contacts.
Availability
The Contacts Analytics page is available on all pricing plans, including the Forever Free plan. No upgrade is required to access this module.
Who can access
Any user with access to Zoho Campaigns, regardless of their role, can view the Contacts Analytics page.
Page controls
At the top right of the page, you will find a set of controls that apply across the entire Contacts Analytics page.
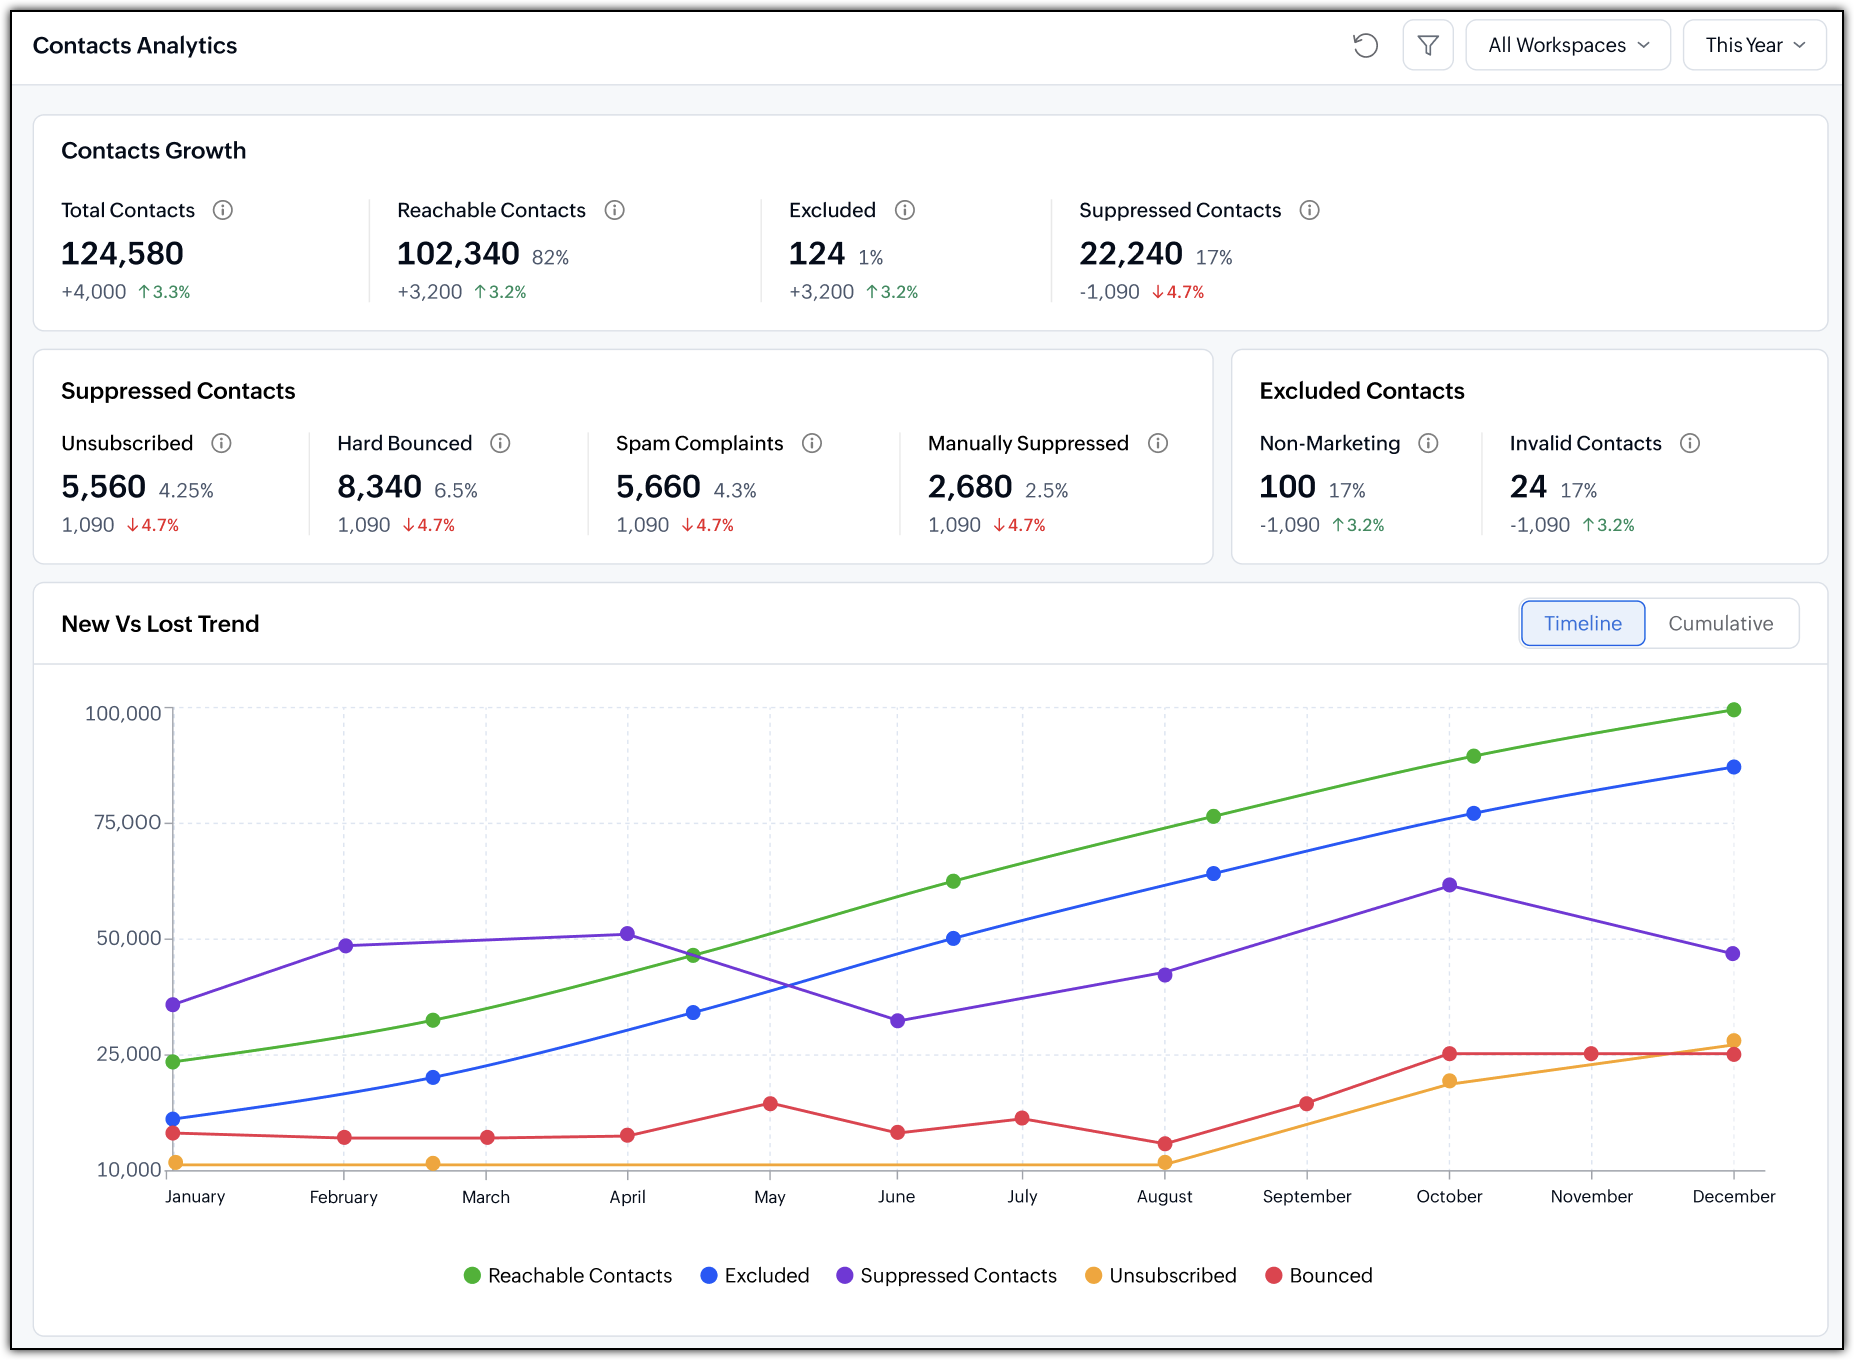 Top-half of the Contacts Analytics page displaying various metrics.
Refresh — Reloads the page data to reflect the most current information without requiring a full browser refresh.
All Workspaces — Filters the analytics data by workspace. This option is visible only to organization Admins, allowing them to view data across all workspaces or narrow it down to a specific one.
Date Filter — Controls the time range for all data displayed on the page. The following options are available:
| |
| Shows data recorded on the current day. |
| Shows data from the previous day. |
| Shows data from the past 7 days. |
| Shows data from the past 14 days. |
| Shows data from the past 30 days. |
| Shows data from the start of the current calendar month. |
| Shows data from the previous calendar month. |
| Shows data from the past 90 days. |
| Shows data from the past 3 calendar months. |
| Shows data from the past 6 calendar months. |
| Shows data from the start of the current calendar year. |
| Shows data from the day your organization was created in Zoho Campaigns up to the present date. |
| Lets you set a specific start and end date to view data for any period you choose. Start date will be from the date on which your Zoho Campaigns organization was created. |
For several metric cards across the dashboard, performance changes are indicated with color-coded percentages and directional arrows. It is important to note how these indicate the health of your list:
Indicator Rule: For negative performance indicators such as Suppressed Contacts, Excluded, Unsubscribed, Hard Bounced, Spam Complaints, Manually Suppressed, Non-Marketing, and Invalid Contacts:
A Red percentage with an Upward arrow (↑) indicates an increase in these metrics, which represents a negative trend for your contact list health.
A Green percentage with a Downward arrow (↓) indicates a reduction in these metrics, representing a positive trend for your contact list health.
The Contacts Growth section provides a high-level summary of your primary list health and volume for the selected time period. It includes the following high-level summaries:
All contacts present in the selected workspace and time range, including reachable, suppressed, excluded, and invalid contact records.
Contacts who are eligible to receive marketing communications.
Contacts who have been excluded from marketing communications due to custom classification or specific organization business rules.
Contacts prevented from receiving communications due to unsubscribe requests, bounces, or custom suppression settings.
This card provides a detailed breakdown of the contacts currently restricted from receiving emails. Keeping track of these numbers ensures you maintain high sender reputation and compliance.
Unsubscribed
The number of contacts who have opted out of receiving communications. These contacts could have been unsubscribed manually by an admin or automatically when they clicked an unsubscribe link.
Hard Bounced
The number of contacts with permanent email delivery failures.
Spam Complaints
Contacts who have explicitly marked your communications as spam in their email clients.
Manually Suppressed
Contacts who were added to the suppression list by an administrator (ie) contacts who have been marked as unsubscribed either under the Contacts module or via import.
This section displays a breakdown of contacts who are inside your account database but are systematically bypassed during active campaigns.
Non-Marketing
Contacts explicitly classified as non-marketing or transactional-only records.
Records with unparseable, malformed, or unusable contact information that cannot safely be sent an email.
The Contacts Growth Stats chart visualizes how your database composition shifts over time within your selected date range. It plots interactive data series representing Reachable Contacts, Excluded, Suppressed Contacts, Unsubscribed, and Bounced.
You can toggle between two primary views using the buttons at the top right of the chart:
Timeline — Shows contact activity exactly as it occurred over time, giving you a period-by-period view of database changes.
Cumulative — Shows the running total of each metric over time, making it easier to see overall growth trends.
Can you filter data in the chart?
To isolate or remove metrics from the graph view:
- Click a metric label in the legend at the bottom of the chart to toggle its visibility.
- Clicking a label will hide its data line so you can examine other particular metrics in isolation.
- Click the label again to bring the hidden metrics back into the visual timeline.
The Contacts by Source chart shows you how contacts are entering Zoho Campaigns by displaying the volume of contacts added from each connected source. Sources can include integrations like Shopify, Zoho CRM, GoToWebinar, as well as manual additions.
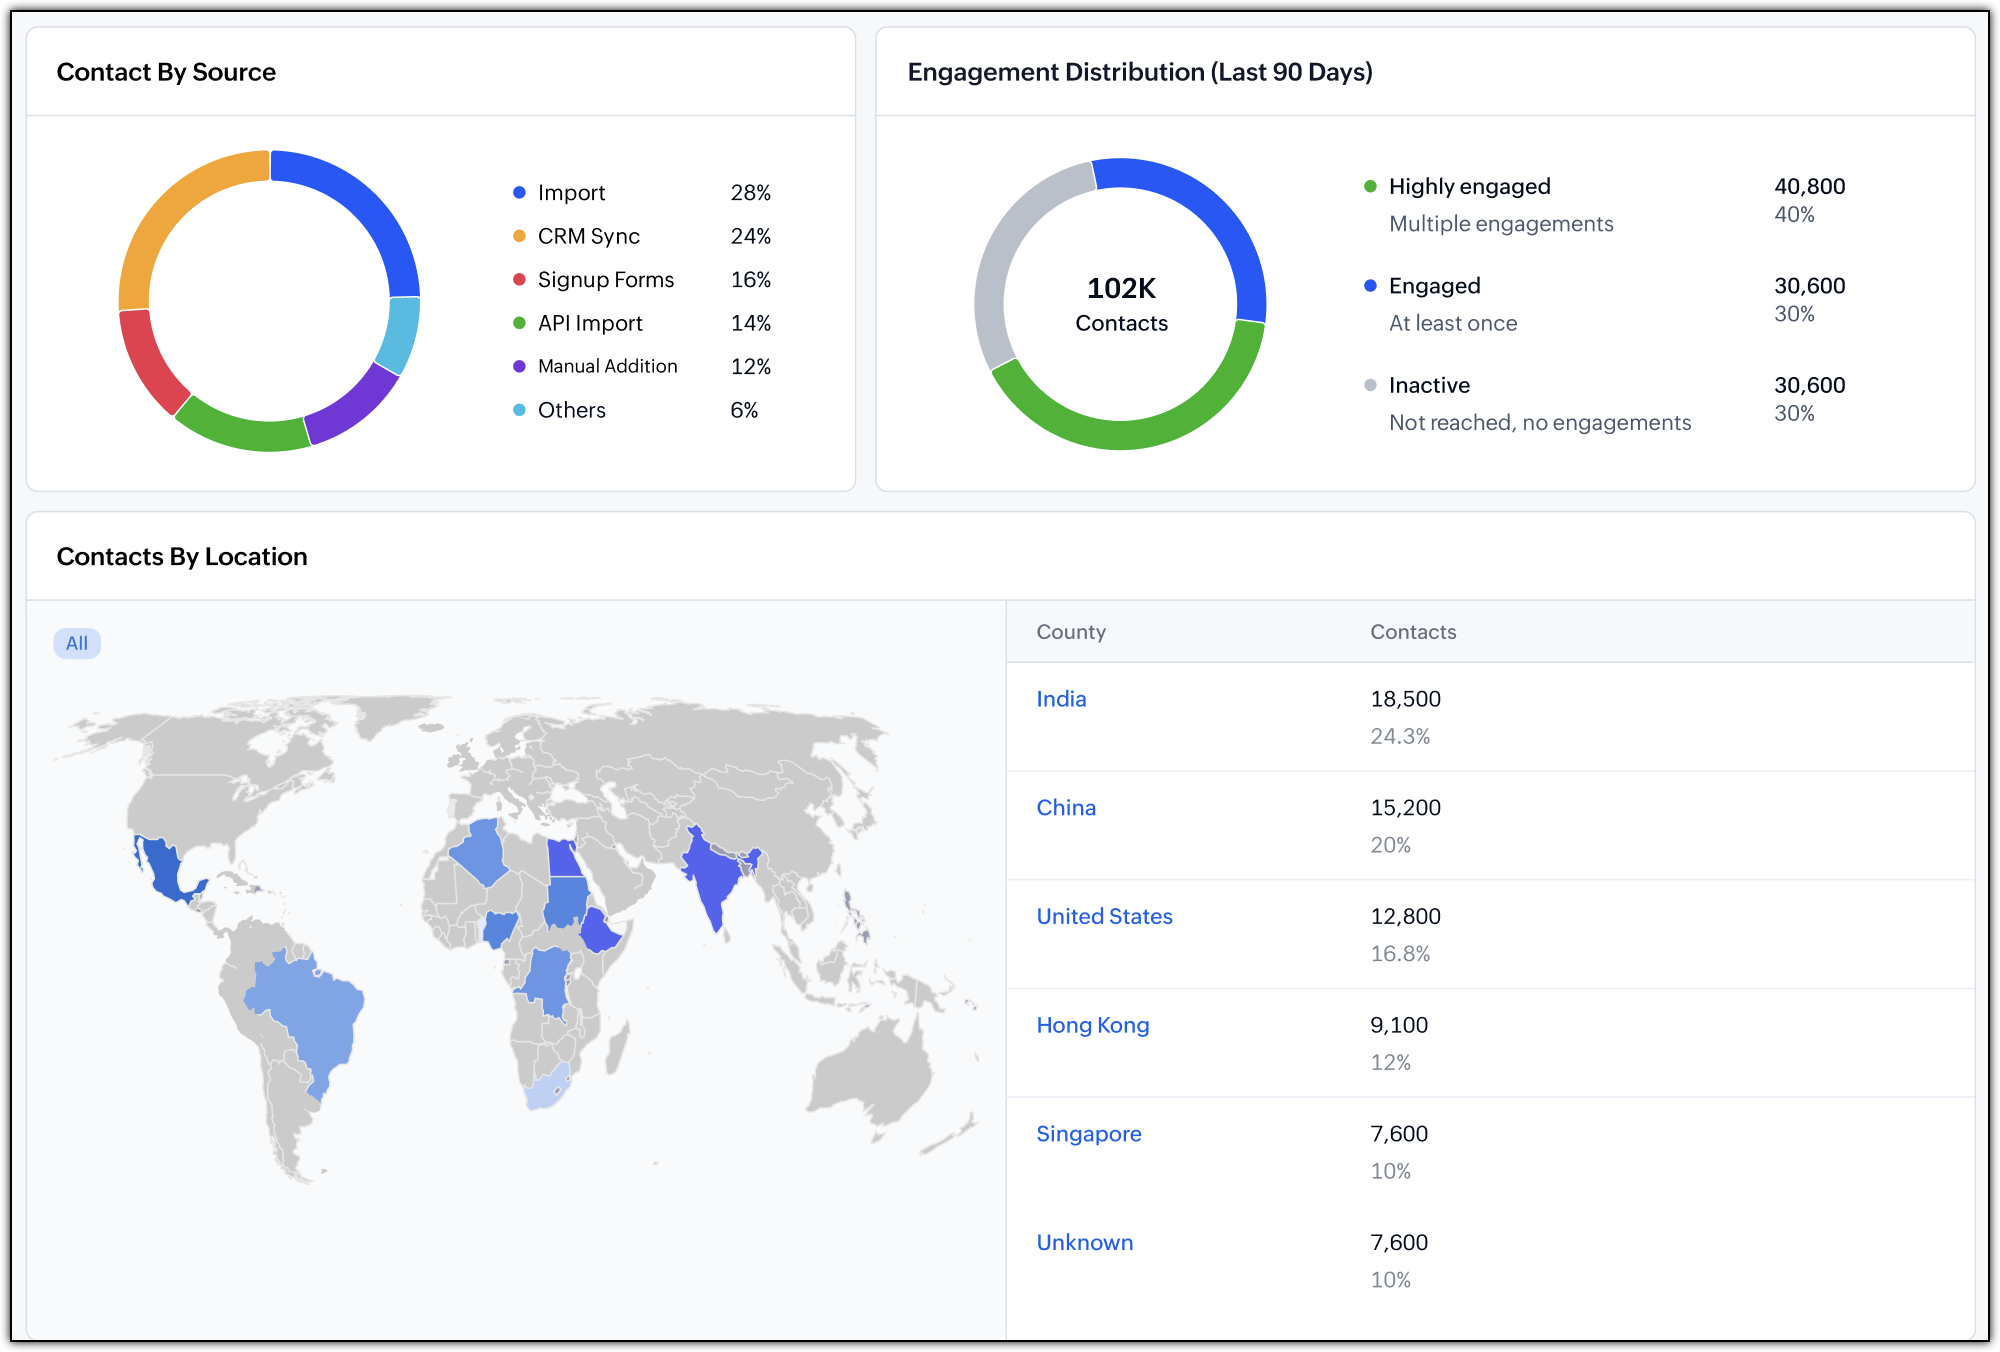 Bottom-half of the Contacts Analytics report displaying various source and location stats.
This chart helps you identify which channels or integrations are contributing the most contacts to your organization, so you can prioritize and optimize accordingly.
Engagement Distribution
The Engagement Distribution section categorizes your active database based on interaction activity.
 Note: The time range for this specific chart is fixed to the Last 90 Days by default to maintain consistent relevance. This duration constraint cannot be changed by the page controls or date filter dropdowns.
Contacts are classified into three levels of engagement:
Highly Engaged: Contacts who exhibit multiple campaign engagements, such as opening and clicking multiple emails over the fixed duration.
Engaged: Contacts who have interacted with your sent campaigns at least once.
Inactive: Contacts who have been reached but have recorded no views, opens, clicks, or general engagements.
Location Breakdown
The Location Breakdown section shows the geographical distribution of your contacts based on the country data available in their contact records.
The world map provides a visual overview of where your contacts are located. Alongside it, the Top Five Countries table lists the five countries with the highest number of contacts for the selected time period, along with the contact count and percentage share for each. This data is based on the value recorded in the Country field of each contact profile.