E-commerce Analytics

How do access these reports?
You can view these reports:
From the left sidebar, click Analytics.
Under the Analytics menu, click E-commerce.
Lets break it down from the top,
The top of the page shows the store name, its current status, and when it was connected and by whom.
A green dot with "Active" means the integration is live and data is syncing.
Store connected since shows the exact date, time, and admin who initiated the integration. Useful when more than one person on the team manages integrations.
In the top-right of the page, you have three controls:
A refresh icon to reload the page data.
A filter icon to refine the view to your needs.
A time range dropdown. Every chart and stat below updates to match the range you pick.
Store Revenue Stats 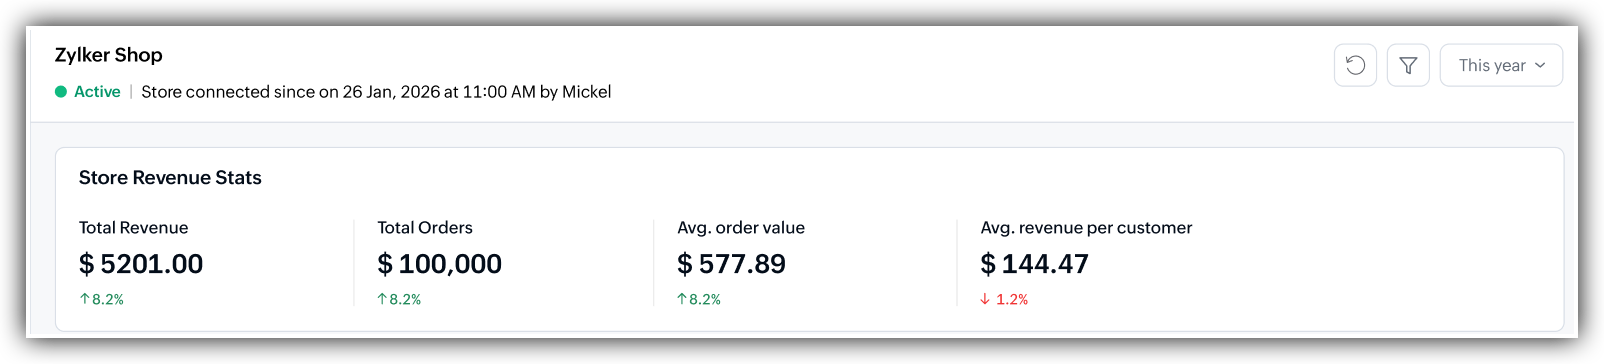
The headline section with four numbers that tell you how the store is doing in the selected time range.
Total Revenue: The total value of all orders placed in the store during the time range.

Total Orders: The count of orders placed in the time range.
Average order value: Total revenue divided by total orders.
Average revenue per customer: Total revenue divided by unique customers in the time range.
Each stat shows a trend indicator below it, comparing the current period's growth/decline to the previous one for the same time-period. A green up-arrow with a percentage means growth. A red down-arrow means decline.
Sales Performance
This section breaks down how much of your store's sales activity is comparable to the marketing you ran through Zoho Campaigns.
At the top of the section you'll see four summary stats:
Orders from Zoho campaigns: The number of orders placed by contacts who came through one of your Zoho campaigns or automations.
Revenue from Zoho campaigns: The monetary value of those orders. This is your direct result number.
Promotional: Part of total revenue generated specifically from promotional campaigns
Automation: Part of total revenue generated specifically from automations like welcome series, post-purchase flows, and abandoned cart sequences.
The All Channels dropdown in the top-right of this section lets you filter the chart to a specific channel.
The chart below plots three lines across the time range:
Promotional Revenue (blue): Revenue from promotional campaigns.
Automation Revenue (orange): Revenue from your automations.
Orders from Campaigns (green): The order count.
Abandoned Cart Analytics
Abandoned cart recovery is one of the highest-ROI things an ecommerce store can do, and this section tells you whether your emails are working.
The three stats at the top:
Abandoned cart value: The total monetary value of carts that customers added items to but didn't check out.
Abandoned follow-up sent: How many recovery emails were sent in response. If this number is zero, you don't have a cart recovery automation running.
Recovery revenue: The monetary value of orders that came from people clicking through your recovery emails and completing checkout.
The chart below plots two lines:
Abandoned (blue): Abandoned cart value over time.
Recovered (orange): Revenue recovered over time.
This section also has an All Channels dropdown in the top-right, so you can switch the view to a single channel.
Campaign Performance by Engagement
This section ranks your campaigns by how much engagement and revenue they have brought in from the connected store. It's how you find out which campaigns are actually working.
The table columns include:
Campaign Name: The campaign's name, with the creator and send date below it.
Revenue: Monetary value of orders from this campaign.
Orders: Number of orders received from the campaigns.
Recipients: How many contacts the campaign was sent to.
Delivered: How many actually received it, with the delivery rate underneath.
Clicked: How many clicked a link, with the click rate underneath.
CTOR (Click-to-open rate): The percentage of people who opened the campaign and then clicked. This measures whether your content matched what your audience was opening for.
Two controls in the top-right of this section:
Show: Filter to the top 5 campaigns or least 5 campaigns.
By: Sort by Revenue, Orders, Recipients, or CTOR.
Top Selling Products via Zoho Campaigns
This section lists which products are actually selling through your marketing campaigns. These are the products being bought by people who came in through campaigns and automations managed by Zoho Campaigns.
The table columns include:
Products Name: The product as it is listed in your store.
Revenue: Total revenue a product generated from campaign related orders.
Orders: Number of orders.
Units: Number of individual units sold.
Use the All Campaigns dropdown in the top-right to switch this list to a specific campaign instead of all campaigns combined.

Use case
An electronics store owner notices that their second-best performing product is a phone case, even though it isn't a top seller in-store. They run a follow-up campaign displaying the case as an add-on with the phone, and increase revenue significantly.
Oliver, an ecommerce store owner, reviews ecommerce analytics every Monday. He sorts campaigns by revenue, and notices that the Friday flash sale outperformed his Monday newsletter, and switches her sending calendar accordingly.