Email Analytics
Email campaign analytics give you a clear, consolidated view of how your email campaigns are performing. From delivery and open rates to clicks, bounces, and unsubscribes, these metrics help you understand how recipients are interacting with your emails. By analyzing this data, you can identify what’s working, spot areas for improvement, and make informed decisions to optimize your future campaigns for better engagement and results.
How to access email campaign analytics
Follow these steps to view email campaign analytics:
From the Navigation toolbar, click Analytics.
Then click Email.
The Email campaign reports page will load, showing metrics for all the emails you have sent so far.
You can view the following metrics:
Delivery stats 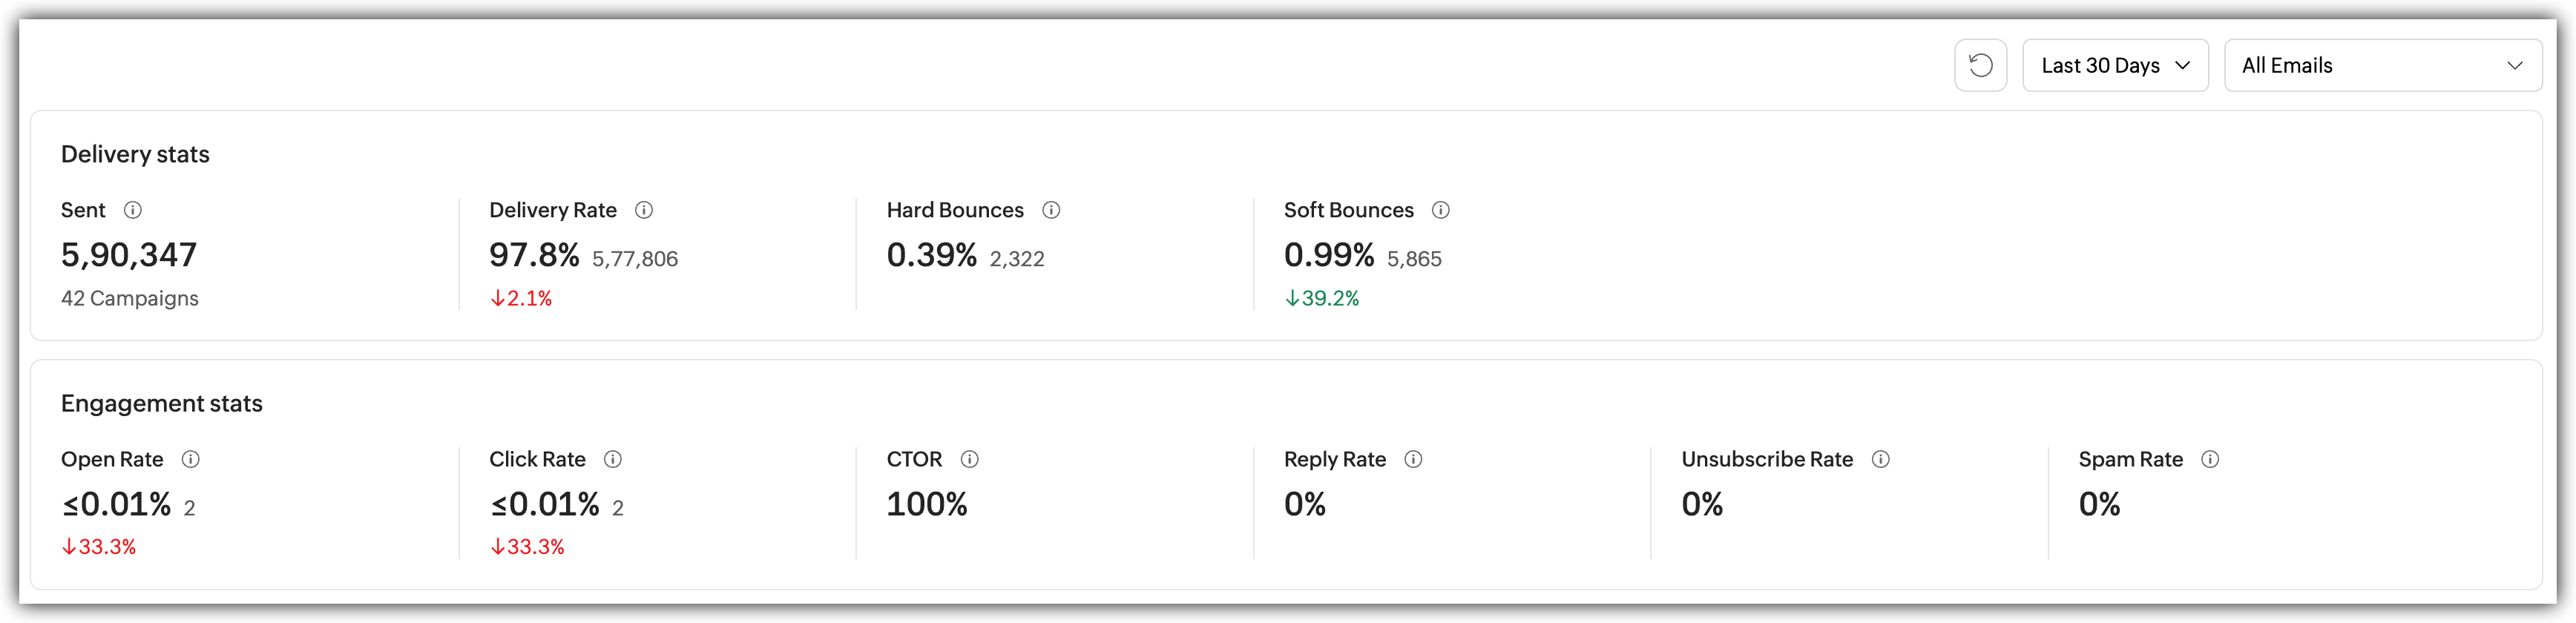
Sent: The total number of email campaigns that were sent out.
Delivery rate: The percentage of sent emails that were successfully delivered.
Hard bounces: Emails that permanently failed to deliver, mostly because the email address does not exist or is invalid.
Soft bounces: Emails that temporarily failed to deliver, for example, because the recipient's inbox was full. These addresses may still be valid, and the email might be delivered on the next attempt.
Engagement stats
Open rate: The percentage of delivered emails that were opened.
Click rate: The percentage of delivered emails where a recipient clicked on at least one link.
CTOR (Click-to-open rate): The percentage of people who clicked a link out of those who actually opened the email.
Reply rate: The percentage of recipients who replied directly to your email.
Unsubscribe rate: The percentage of recipients who clicked 'Unsubscribe' after receiving your email.
Spam rate: The percentage of recipients who marked your email as spam.
Performance over time 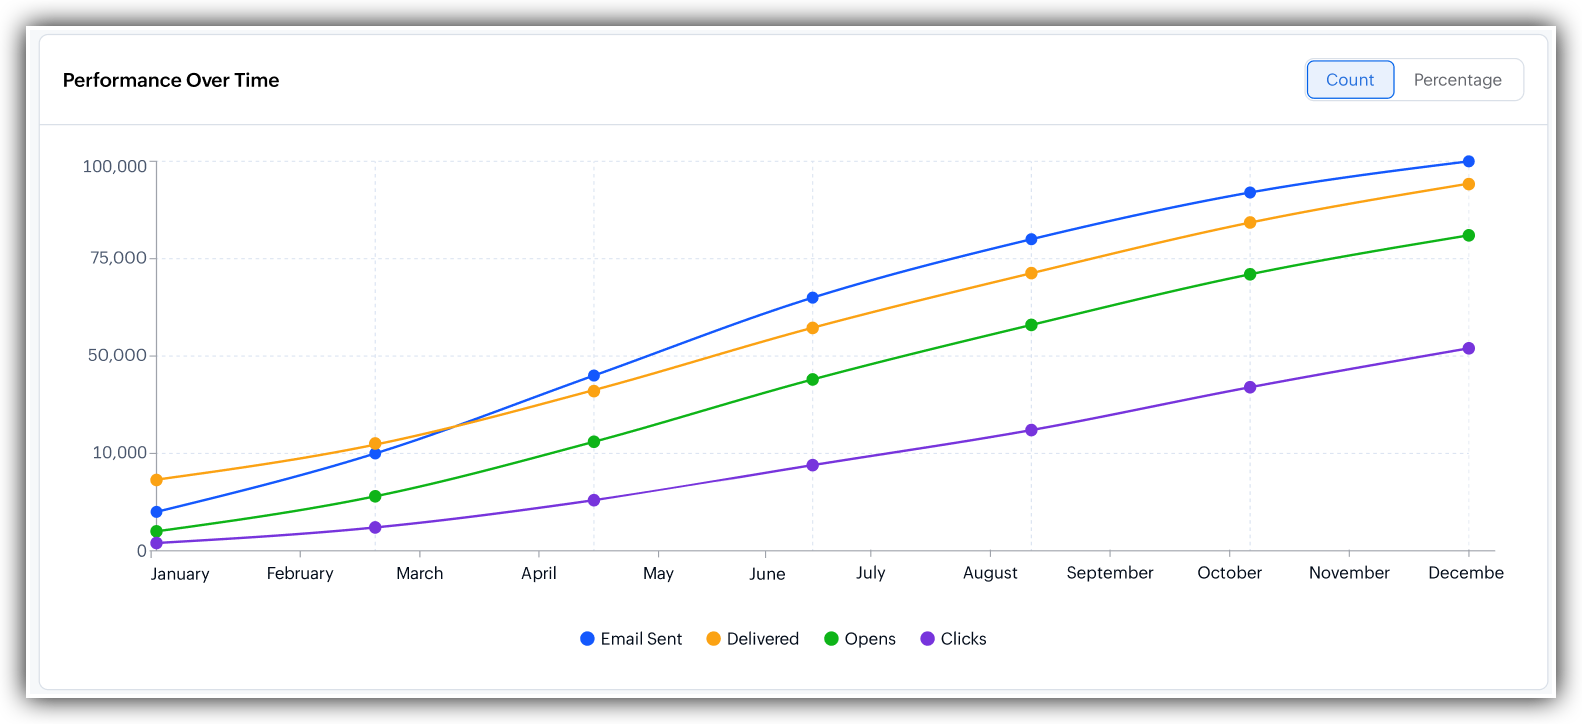
The Performance over time chart shows how your email metrics have trended across a period. Instead of just seeing total numbers, you can see how your campaigns are performing week by week or month by month.
Engagement by day and time 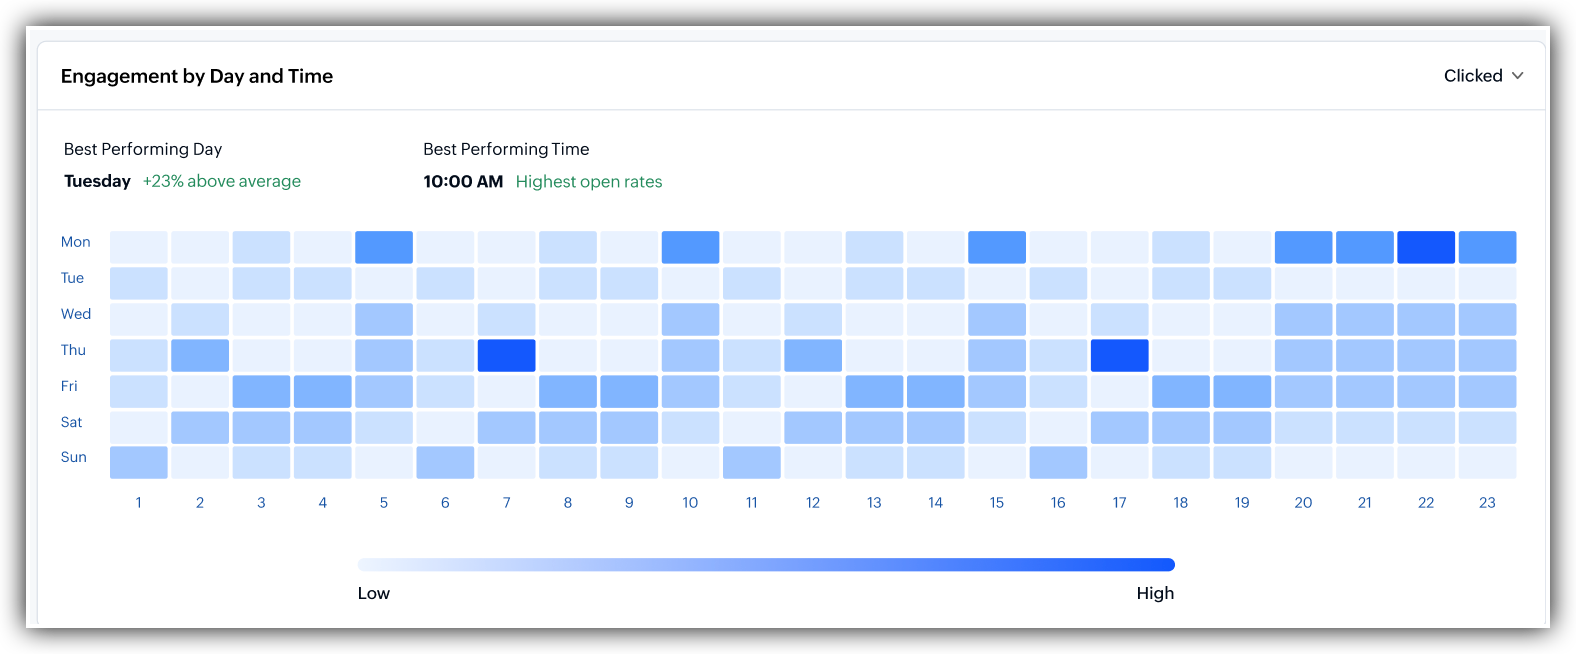
This section shows you when your audience is most likely to open or click your emails, broken down by day of the week and time of day. You can click the drop down to choose between Opens and Clicks. This lets you see separate patterns for when people open emails versus when they click links.
Best performing day: This highlights the single day of the week when your emails get the most engagement, whether that is opens or clicks. Use this to schedule future campaigns on the day your audience is most active.
Best performing time: This shows the time of day when your audience is most likely to engage with your emails. Sending your campaigns at the right time can significantly improve your open and click rates.
Campaign performance by engagement 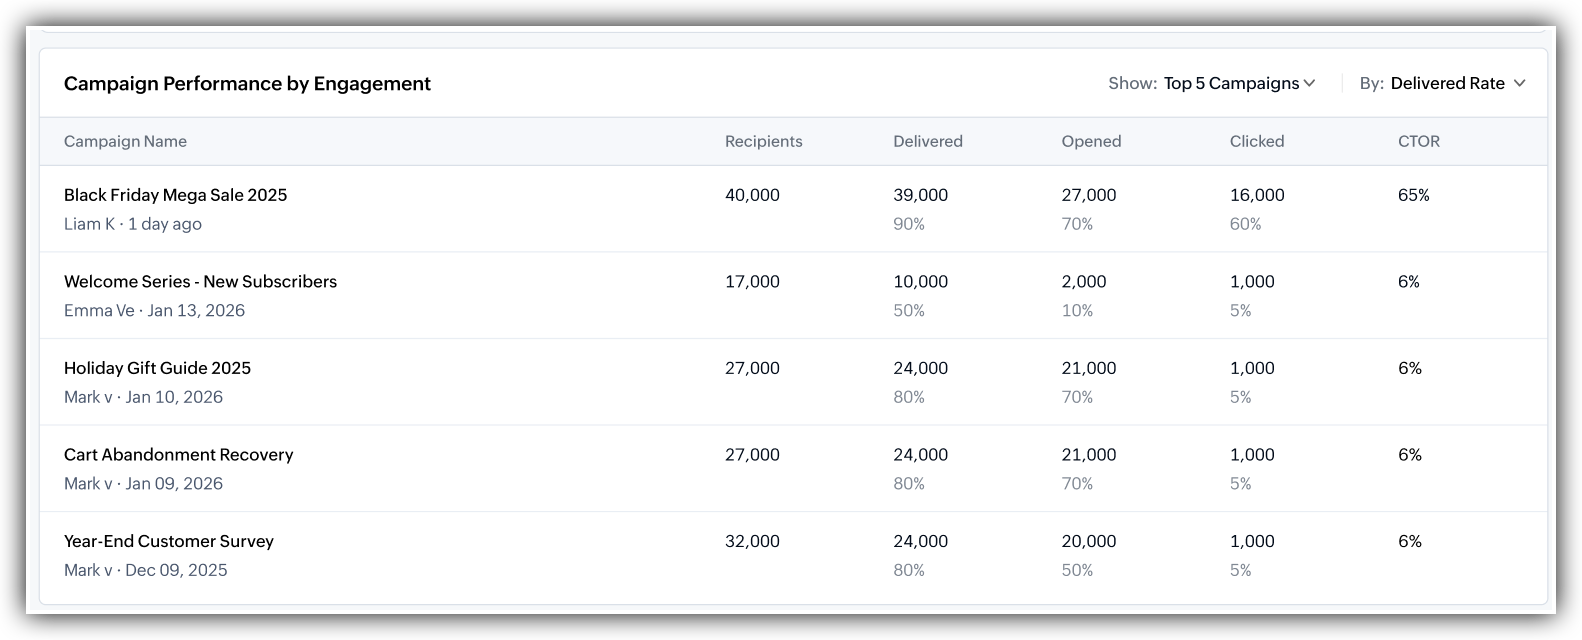
This section gives you a breakdown of how individual campaign has performed. Instead of looking at all your emails together, you can compare campaigns side by side. For each campaign, the table shows:
Campaign Name: The name of the email campaign
Sent: Total number of emails sent
Delivered: Number of emails successfully delivered
Opened: Number of recipients who opened the email
Clicked: Number of recipients who clicked a link
CTOR: Click-to-open rate for the campaign
You can use the filter option to quickly find the campaigns that matter most,
Top 5 Campaigns: Shows your five best-performing campaigns based on the selected metric
Least 5 Campaigns: Shows your five lowest-performing campaigns, helping you identify what did not work
Open rates by device 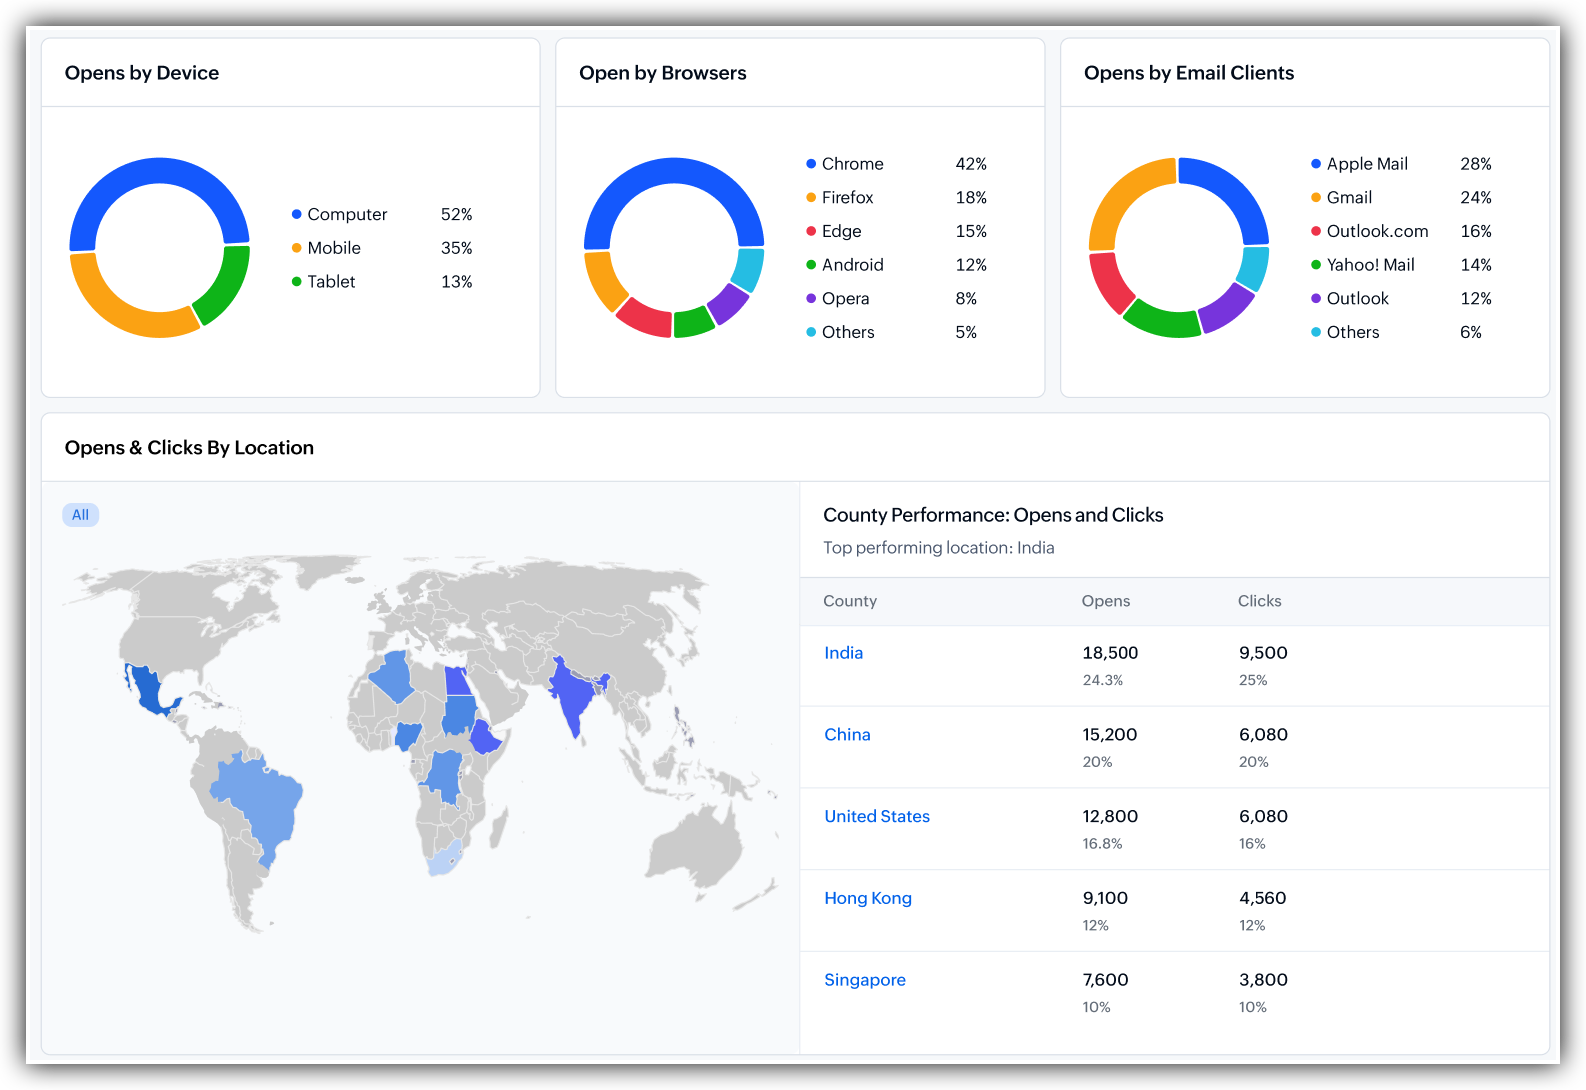
This shows the percentage of email opens that came from different device types — such as desktop computers, smartphones, and tablets. If most of your recipients open emails on mobile, your emails should be designed to look great on small screens.
Open rates by browser
This shows which web browsers your recipients are using when they open emails — for example, Chrome, Safari, or Firefox. This helps you ensure your email designs are compatible with the most popular browsers.
Open rates by email client
This shows which email applications your readers are using, such as Gmail, Outlook, Apple Mail, or Yahoo Mail. Different email clients display emails differently.
Location breakdown
The Location Breakdown section shows you where in the world your email opens and clicks are coming from. This geographic data helps you understand your audience distribution and refine your targeting strategy.
Country performance: This shows email engagement broken down by country, including both opens and clicks.
Top performing country: At a glance, you can see which country is generating the most engagement for your email campaigns. This can help you decide where to focus your marketing efforts or whether to create region-specific campaigns.