Understand Metrics
What Does This Page Cover?
Learn about Metrics Dashboard and how it makes it easier to analyze and monitor the usage statistics across applications and its users in a single platform.
Availability
- Metrics is available in the United States (.com), Europe (.eu), Australia (.au) and India (.in) data centers.
- Metrics will be available only in the Creator 6 version of Zoho Creator.
Overview
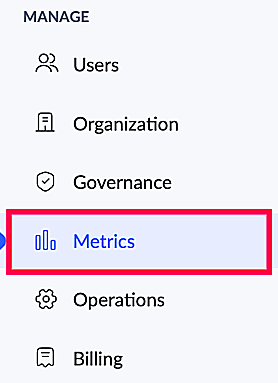
Dashboards are an effective tool for visualizing data into a single page in order to provide insights quickly. Zoho Creator comes with a built-in analytic and monitoring tool called Metrics, which gives a holistic view of the usage statistics across applications and its users(anyone accessing the live mode of the application). Our dashboard provides insights into engagement statistics with the help of key performance indicators (KPIs), charts, heat maps, and more. This feature is present under the Manage section present in left navigation pane in your Creator.
This intuitive dashboard, which is accessible only by admins and super admins, acts as a helpful tool to move from flying blind and reactive to fully aware and proactive. Gather information on how well your apps and users are performing over different time periods, and use them to improve productivity.
Terminologies
- Access count/Accessed - The moment the user enters into the live mode of an application, it will be counted as an access.
- Hit count - Any action that the user performs within the live mode of an application will be counted as a hit. For example, submitting a form, editing a record, triggering a workflow action, clicking a button in a page, report actions etc. will be counted as hits.
- Public users - Users who access published components of the application.
Dashboards inside Metrics:
The Metrics is neatly split into three different tabs to provide granular insights using specific KPIs:
- Application activity - Captures usage statistics of all applications based on users' access and hits in the live mode. Filter application activity based on
All users - Users, portal users, and public users.
Users - Users, and public users. This includes developers who access the live mode of the application.
Portal users - Only Portal users.
- User activity - Captures usage statistics of users and public users who access live mode of the application.
- Portal user activity - Captures usage statistics of portal users who access portal of the application.
Benefits of Metrics
- Get unparalleled access to in-depth insights on users activity over applications in your Creator account.
- Measure application engagement using various metrics, and use this data to identify trends and ensure efficient app usage.
Business Scenario & Illustration
Consider an organization that supplies industrial equipments, named 'Zylker'. With the help of Zoho Creator, they have created multiple applications like Leave Tracker, Employee Management, Stock Management, and Customer Management. Some of these applications are being used as Portals for the benefit of external stakeholders (like vendors) as well, and have been using this setup for a long period of time.
When the Board member of Zylker asks the admin about the usage of applications, users, activities, and other details within Creator, the admin finds it tedious to gather the statistics from different sections of Creator specific to applications. Instead, the admin would appreciate it if all the stats were consolidated in a holistic view, as it would save his productive time, enabling him to quickly make informed decisions.
This is where the Metrics comes in handy. It helps optimize efficiency by giving administrators and the organization all the necessary information in a holistic view, making it easier to make more informed decisions. This results in maximum resource utilization and the ability to save time that would otherwise be spent collating data. These saved hours can then be redirected towards revenue-generating activities.
Click here to learn the important points to remember when working with the Dashboard.