1. Navigate to the edit mode of the target page and click Open Page Builder.
2. Click Chart from the page elements menu on the left. A gallery will slide in.
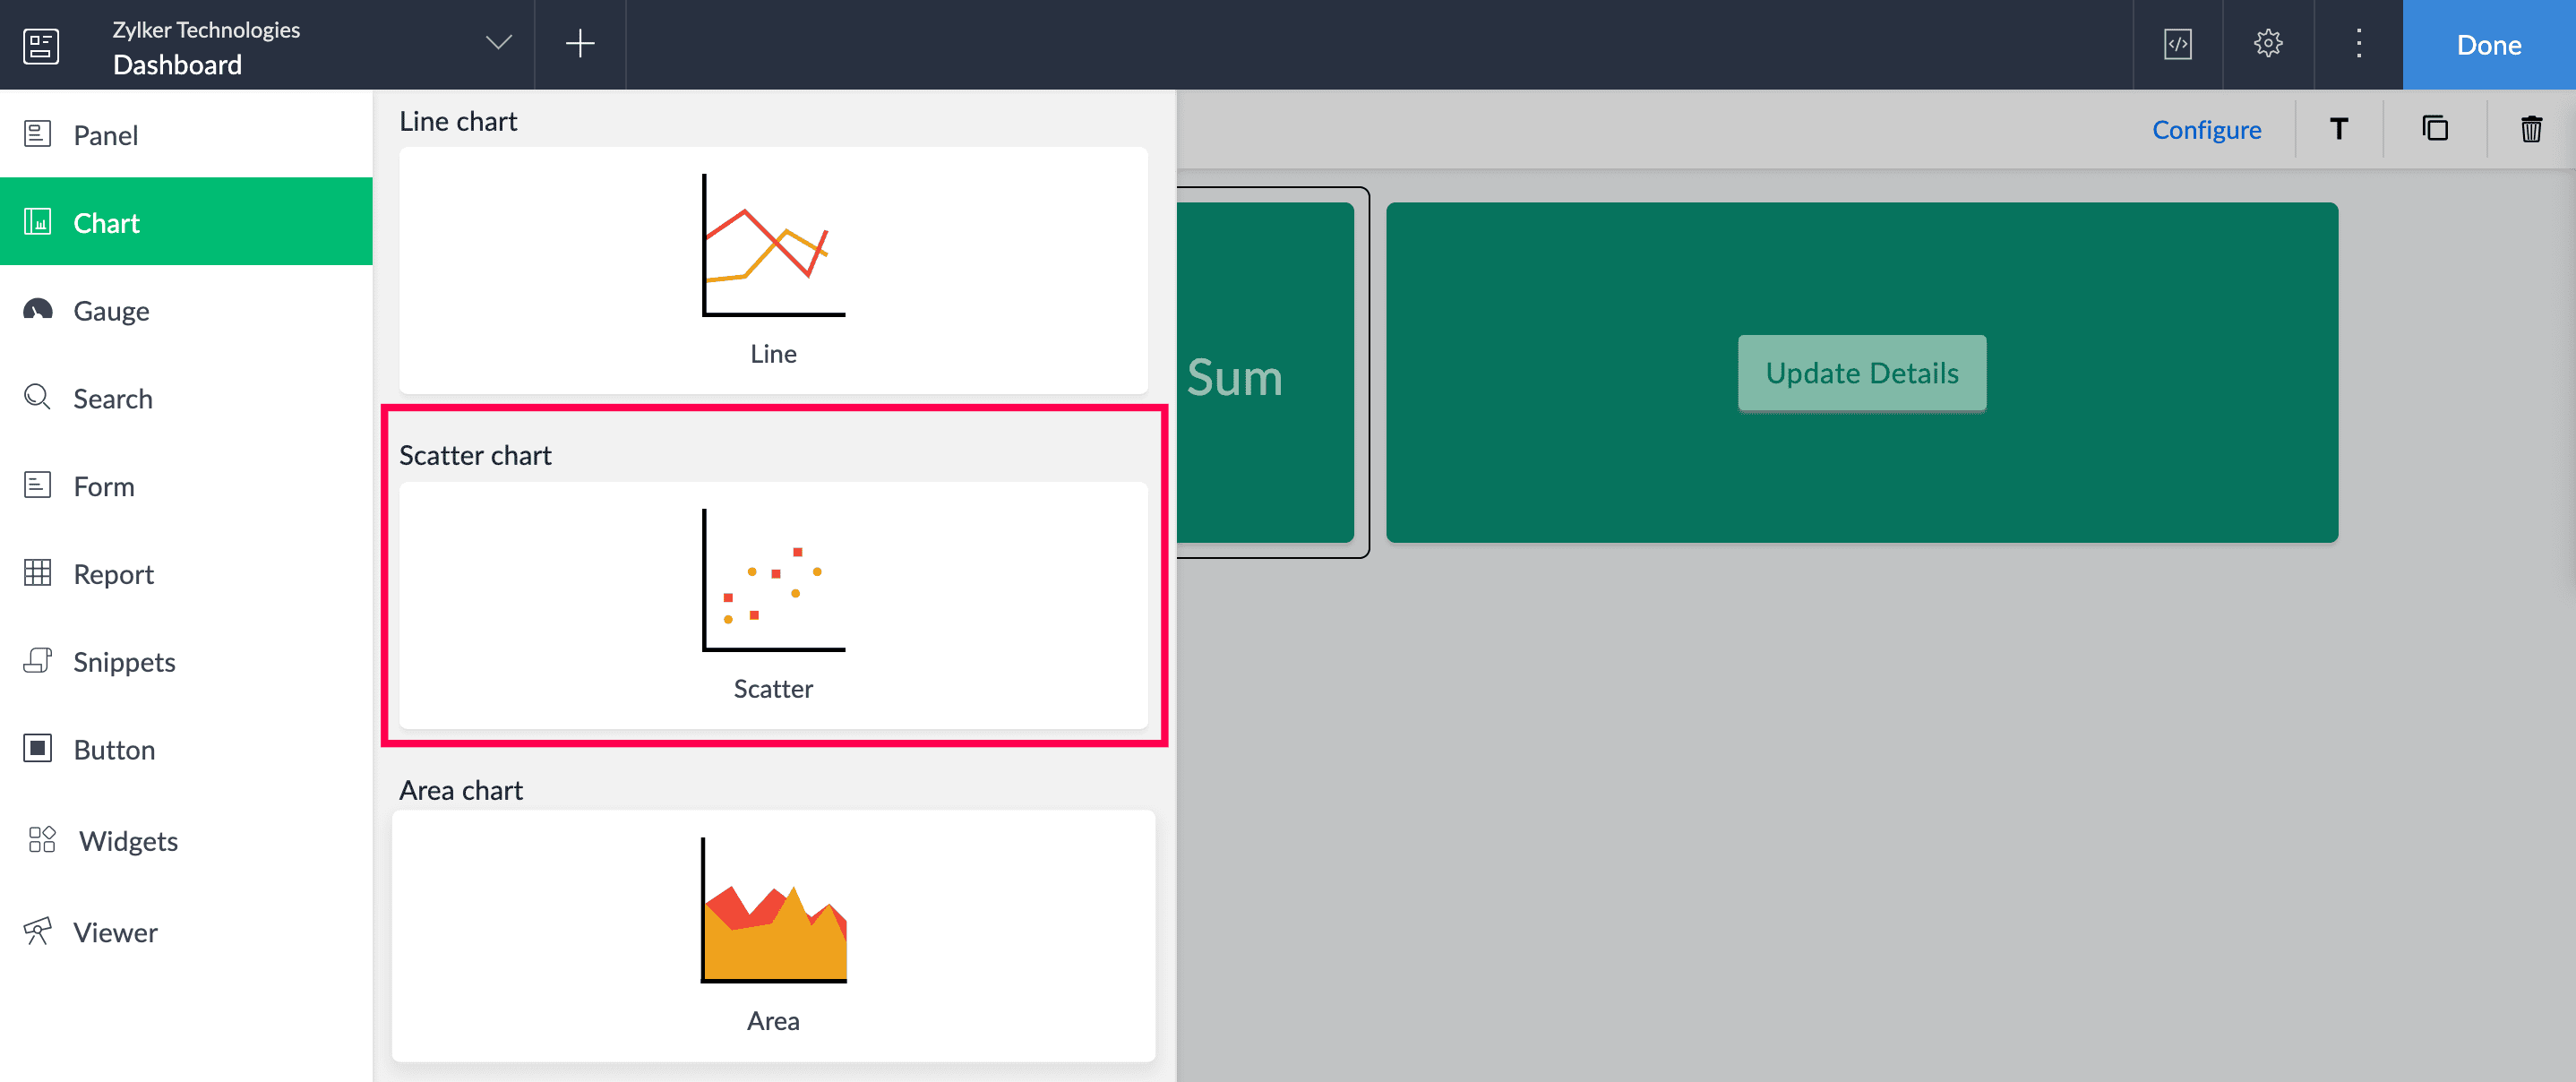
3. Drag and drop a scatter chart from the chart gallery. The Chart Configuration pane will slide in from the right.
4. Select a form to represent its data visually on the chart.
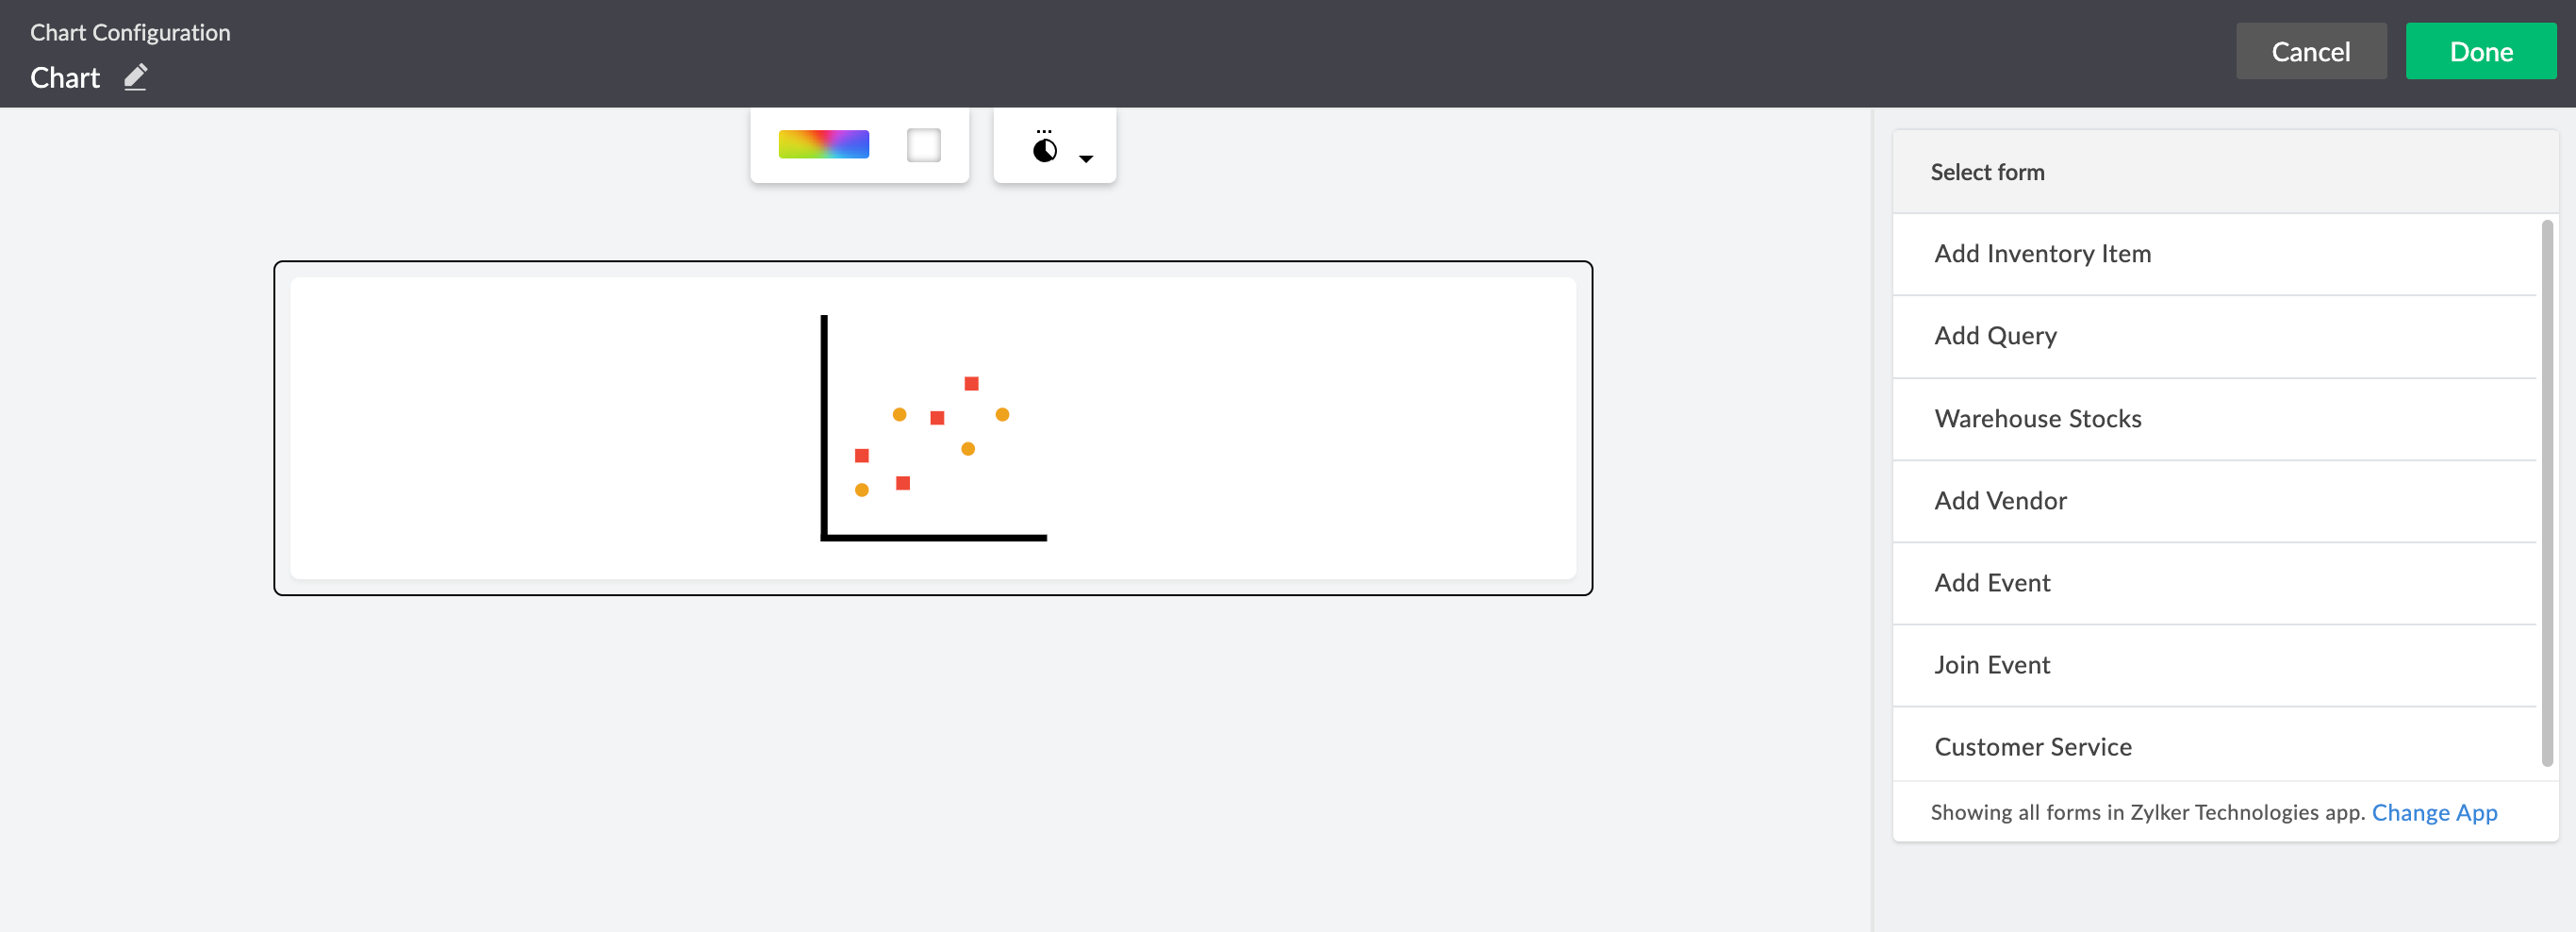

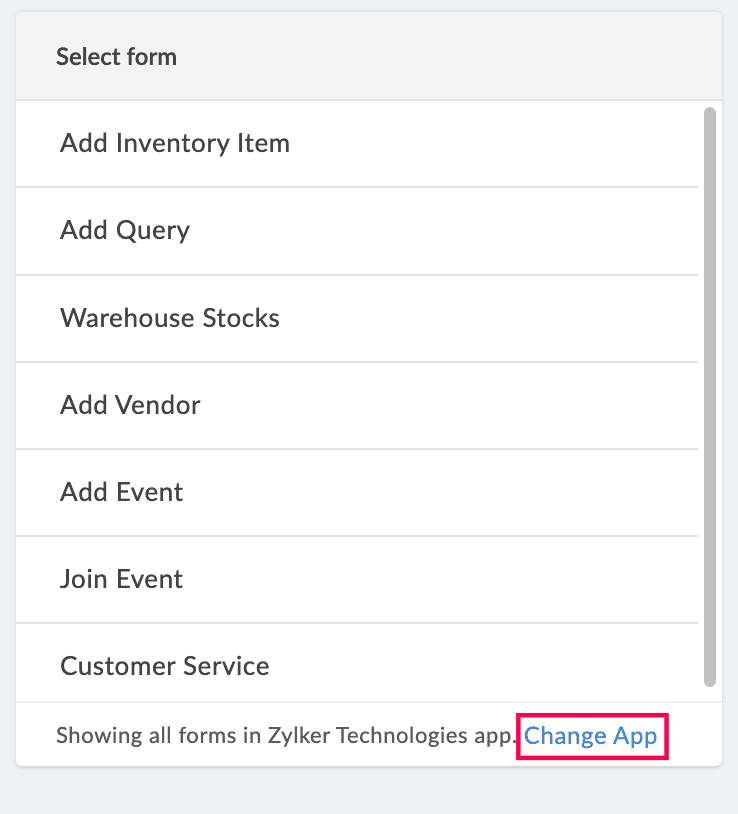
Note: The Select Form dropdown lists all the forms in the application you are currently working on. To select a form from another application, click Change App in the footer of the form dropdown. Select another application and click Done to view all of its forms.
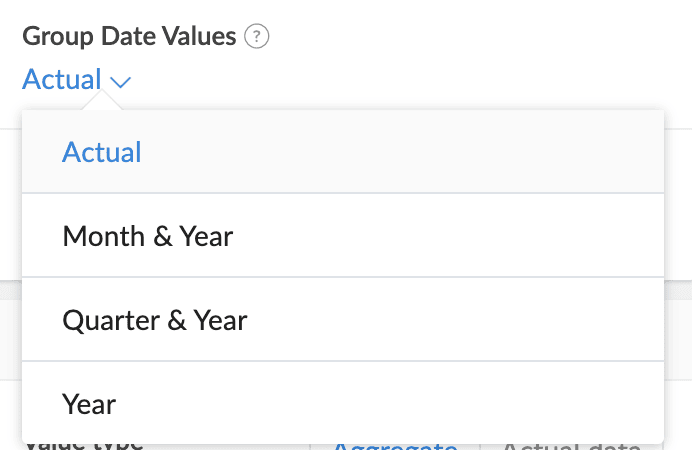
5. Select a field to be mapped with the X-axis of the chart and enter a label that will be displayed on the live mode of the chart.

Note: If a date field is chosen, you can group the X-axis values based on the time range selected under Group Date Values dropdown that appears below. The available options are Actual, Year, Month & Year, Quarter & Year.
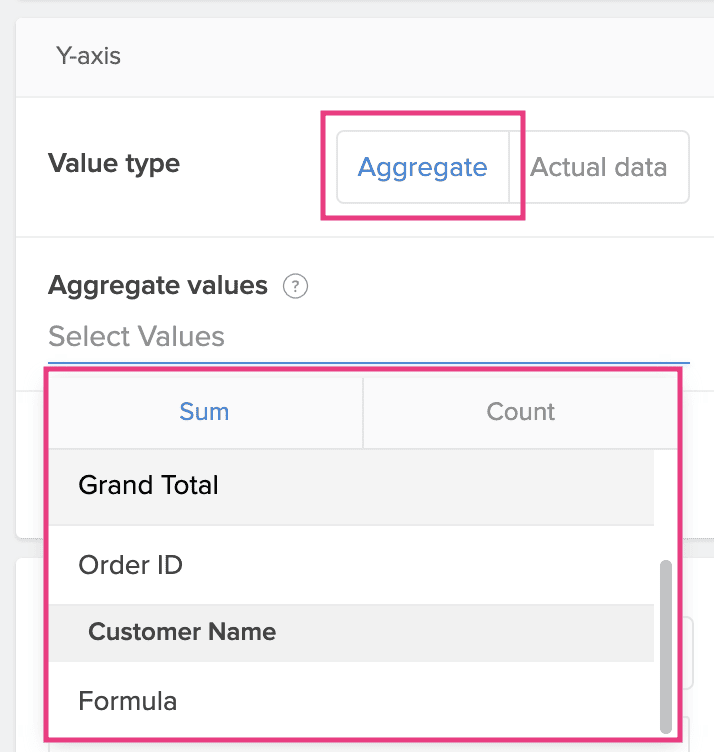
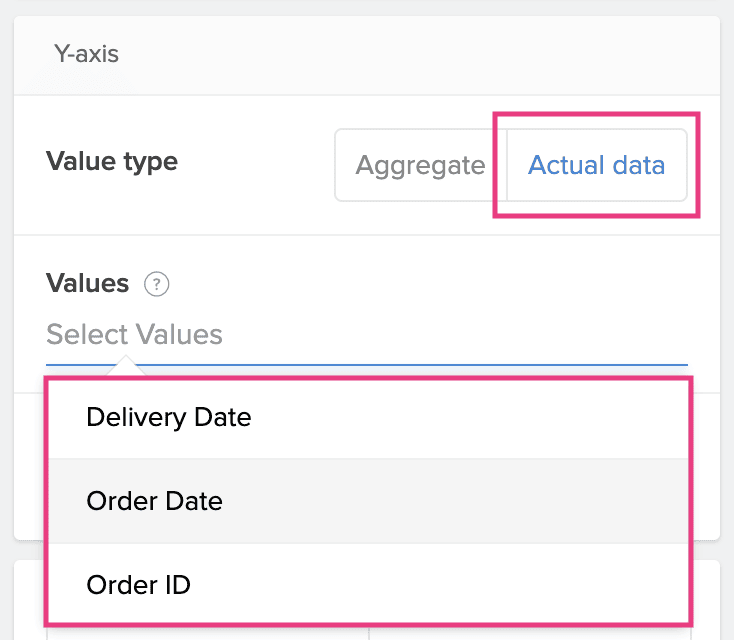
6. Choose a value type to be displayed on the Y-axis.
- Aggregate: Display the aggregate values such as Sum, the sum of the chosen field's values, or Count, the number of records that have a value for the chosen field.
- Actual data: Display the field value as it is.
7. Enter a label for the Y-axis that will be displayed in the live mode of the chart.
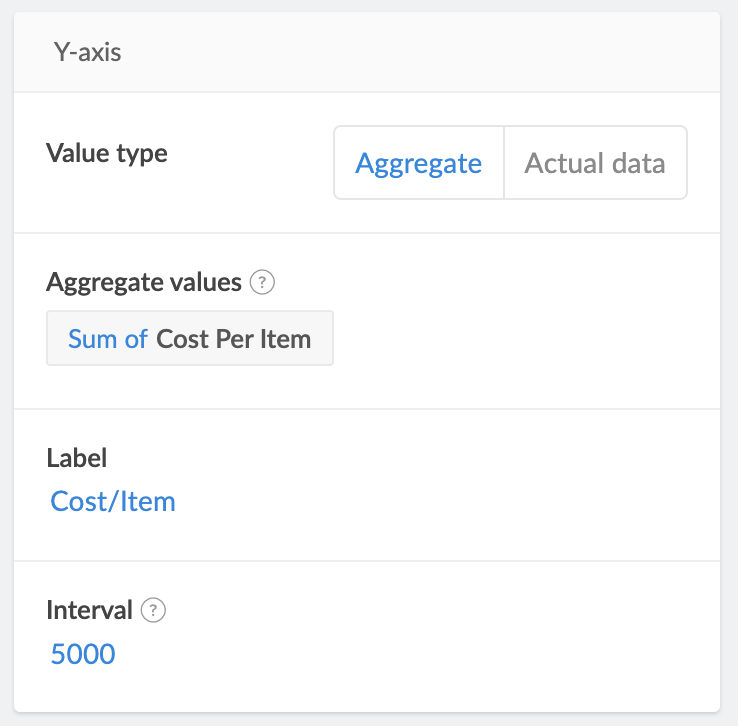
8. Specify an Interval value to determine the spacing of the tick marks on the Y-axis. The first tick mark will be the nearest multiple of the interval below the minimum value in the chosen field's data. For example, with an interval set as 100 and values of 332, 445, and 498, the tick marks will be at 300, 400, and 500.
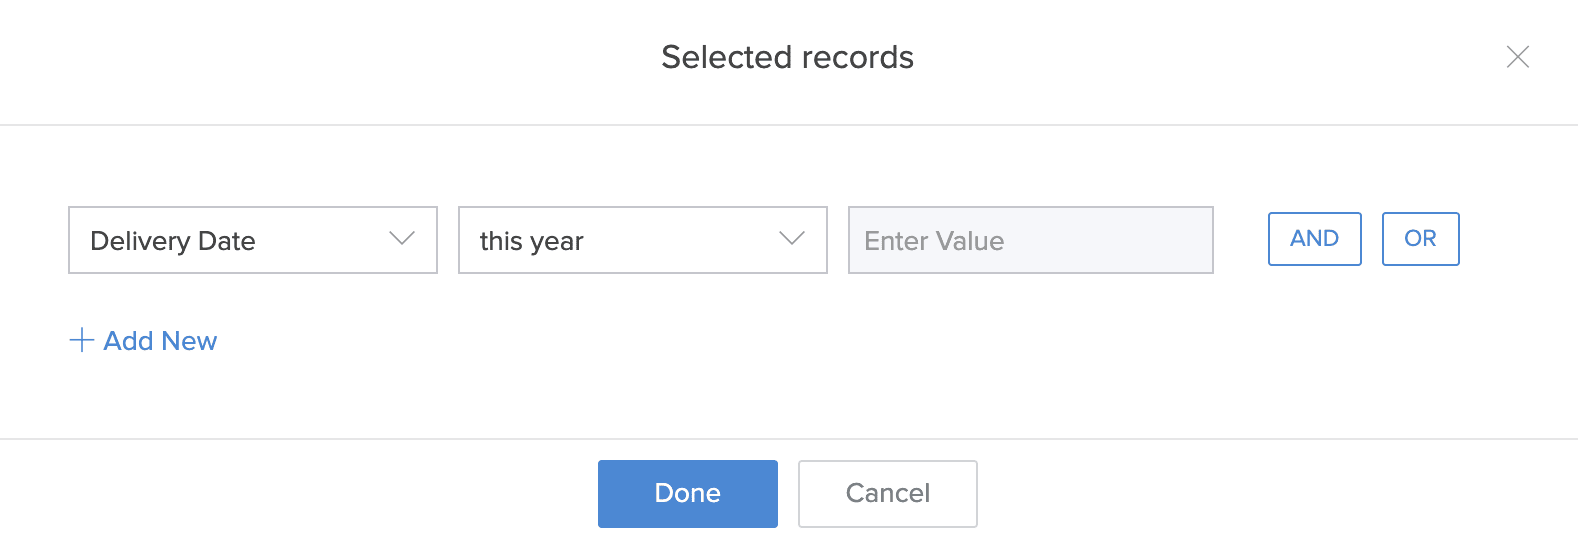
9. Choose All records to evaluate all records from the selected form or Selected records to evaluate a specific set of records that satisfy a criterion, to create the chart.


Note: If Selected records is chosen, set a criteria based on which the records will be filtered: Select Field > Select Operator > Enter Value. Choose AND or OR to add further conditions.
10. Select fields under Filter Data Based On to create a filter dropdown in the live mode of the chart. The dropdown will list the values of the chosen fields, which can be selected by the user to display the chart accordingly.

Note: Only single select fields such a Radio, Dropdown, and Lookup can be selected to create the filter dropdowns.
11. Enable Data Label under the Chart Controls section to show the Y-axis metrics permanently for each section displayed by a chart. This can either be a
- Count of the records based on the selected field for the Y-axis.
- Sum of the values of a Number, Percent, Currency, Decimal, Formula, Prediction, or OCR field chosen for the Y-axis.

Note: If Data Label is disabled, the metrics can still be accessed when the sections are hovered upon.
12. Enable Underlying Data to show the associated records upon clicking a chart section. Use the Report dropdown to choose the specific report for displaying these records.
13. Enable Allow public access to display the chart in a published page.
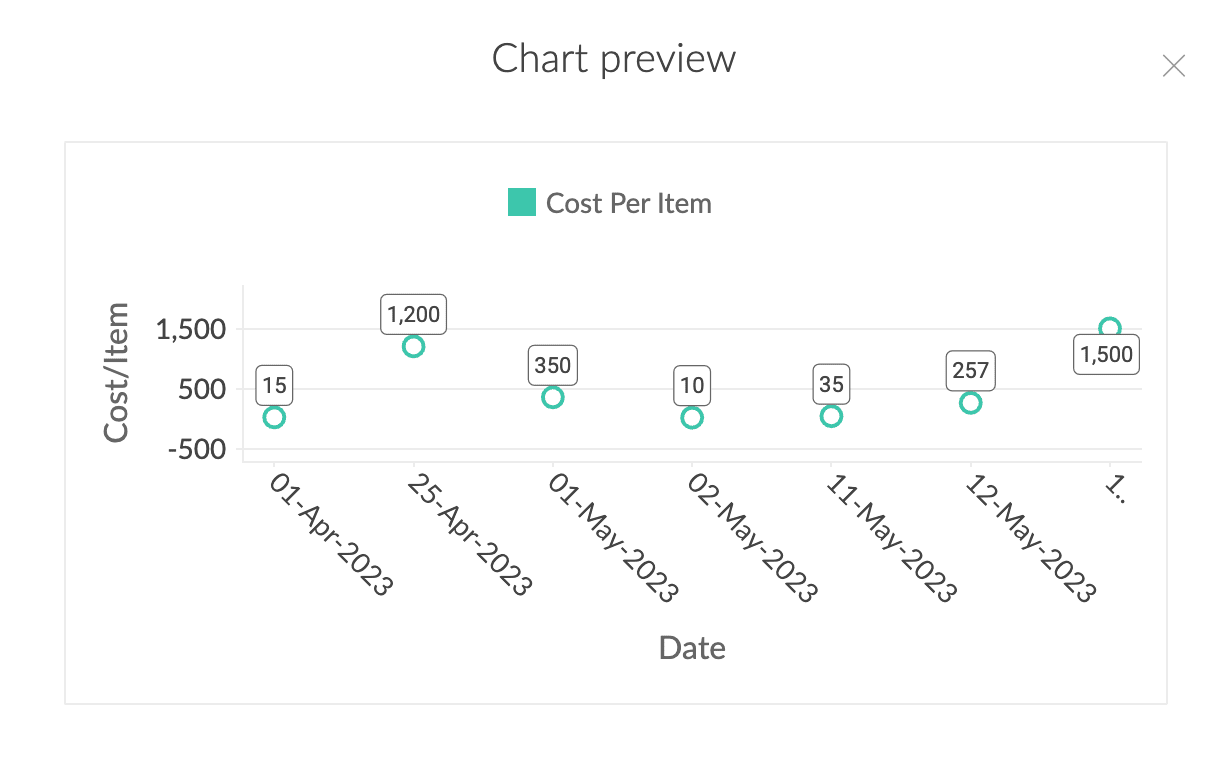
You can preview the configured chart by clicking Preview at the top right of the Chart Configuration pane, or click Done to save the configuration.


 Note: The dropdown will only display list reports.


