Report Types
 Note: To optimize efficiency and security, support for XLS format has been deprecated, and instead, the XLSX format will be supported with effect from 21-March-2024. We insist you to replace any instance of .xls to .xlsx across Deluge scripts in your Creator applications.
Zoho Creator provides you with different options to spin your data into meaningful reports that make substantial information for the intended audience.
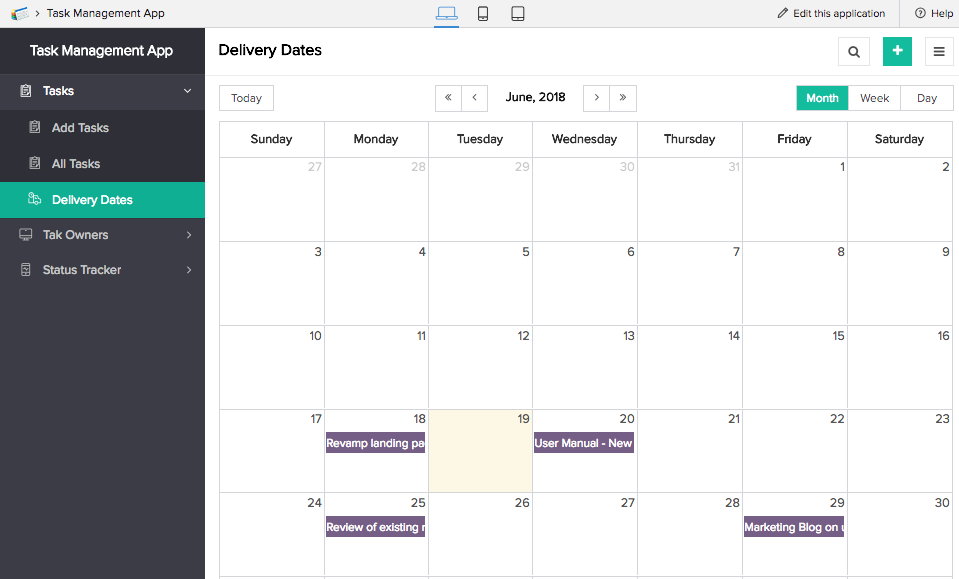
Calendar report: The records are charted based on date and date-time type of field values. It displays a calendar that features scheduled. The records are present on specific dates in the report. It is best suited to keep track of events.
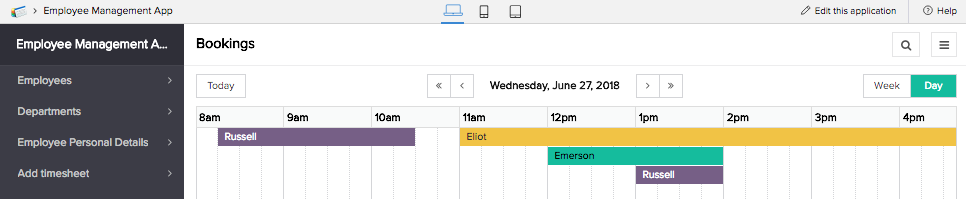
Timeline report: The records are charted based on date and date-time type of field values. It is a higher level view of calendar report that captures time frames that relate to the records. It can be used to track time span like in the case of duration of projects and so on.
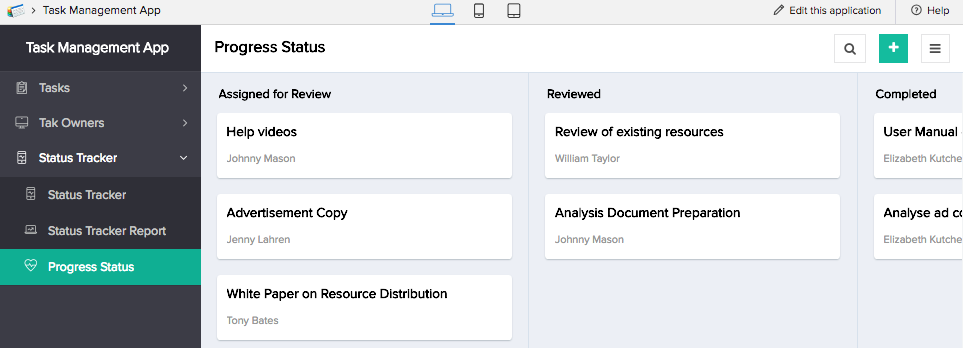
Kanban report: It helps you organize data into categorical entities in a single report. Your records are sorted into preset groups based on the selected field. This type of report comes in handy when you want to maintain records based on their status and capture the stages of a process.
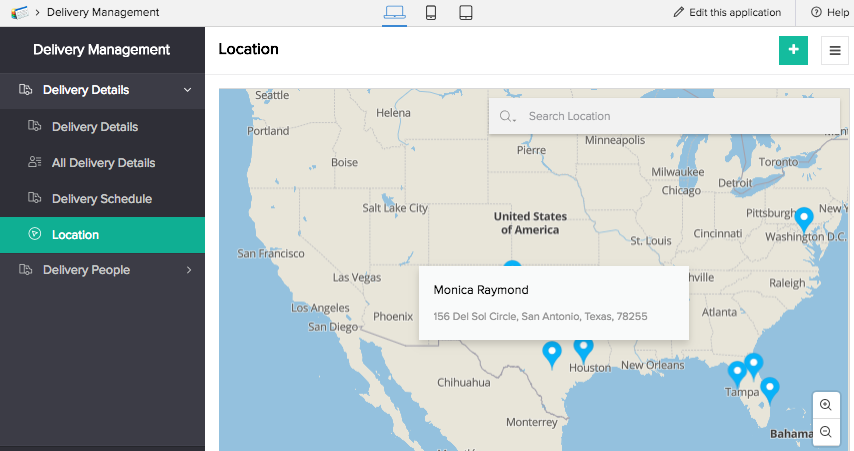
Map report: The records are plotted on a map based on the location type of field values. The report is suitable for geographical representation of records.
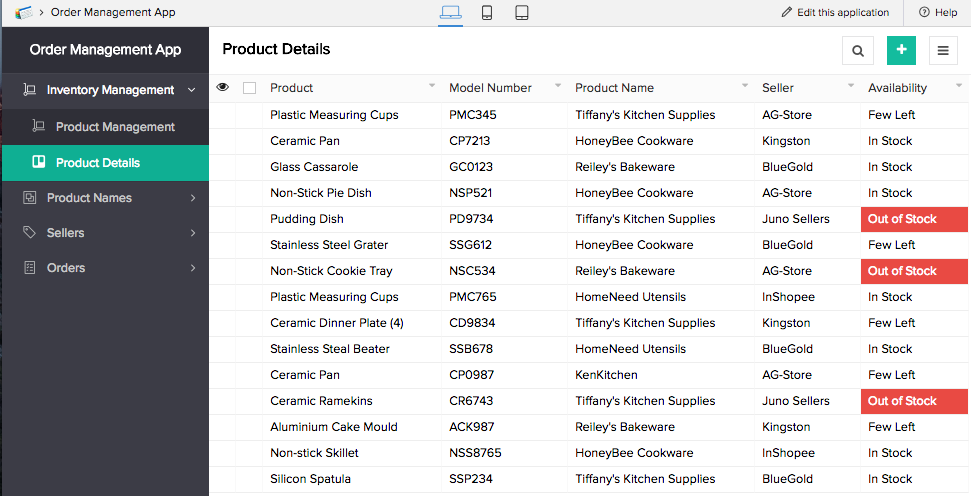
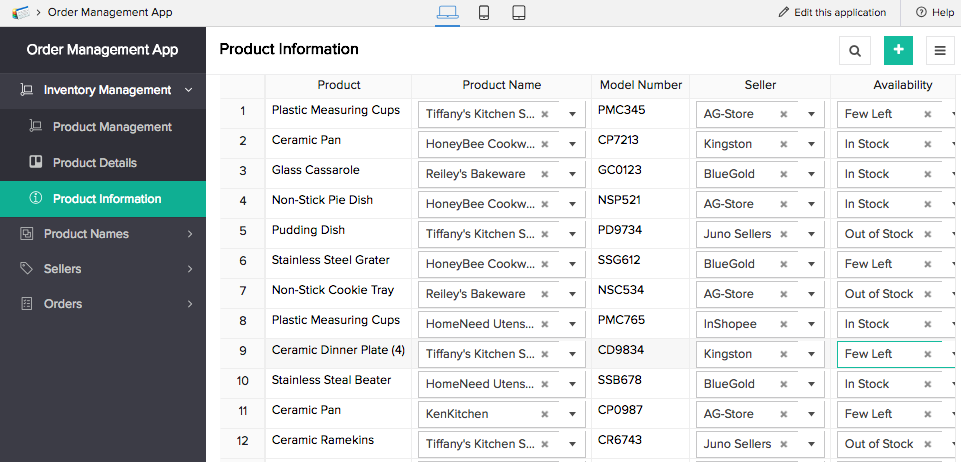
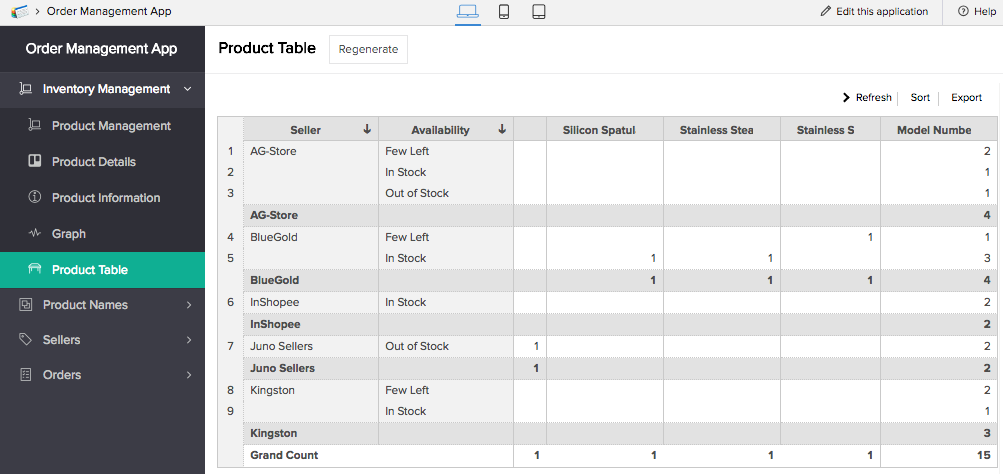
Pivot table: It enables you to organize information as summarized grids. It allows you to dynamically rearrange, group and summarize information for easy analysis of large sets of data. The records are presented as rows and columns of information based on the selections that you make to create the table.
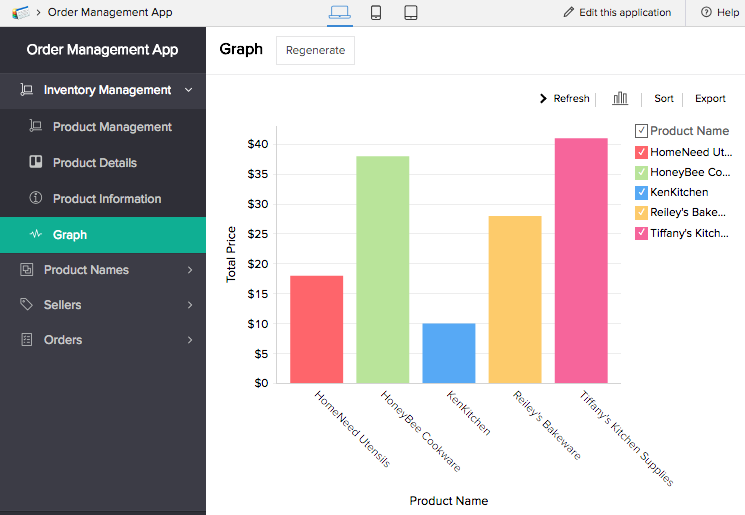
Pivot chart: The data can be presented graphically for visual appeal and assimilation. Area, Line, Bar, Stacked, Pie, Scatter, Combination, Funnel, Web, and more are the chart types supported.