Understanding and building reports
As your organization grows, you notice two things:
- Your CRM data becomes increasingly complex. This data contains valuable insights about your customers, employees, profits, sales, and opportunities.
- You need to leverage this data to gain clarity about your business and make confident decisions. Data-driven support is essential to provide evidence and build trust in your choices.
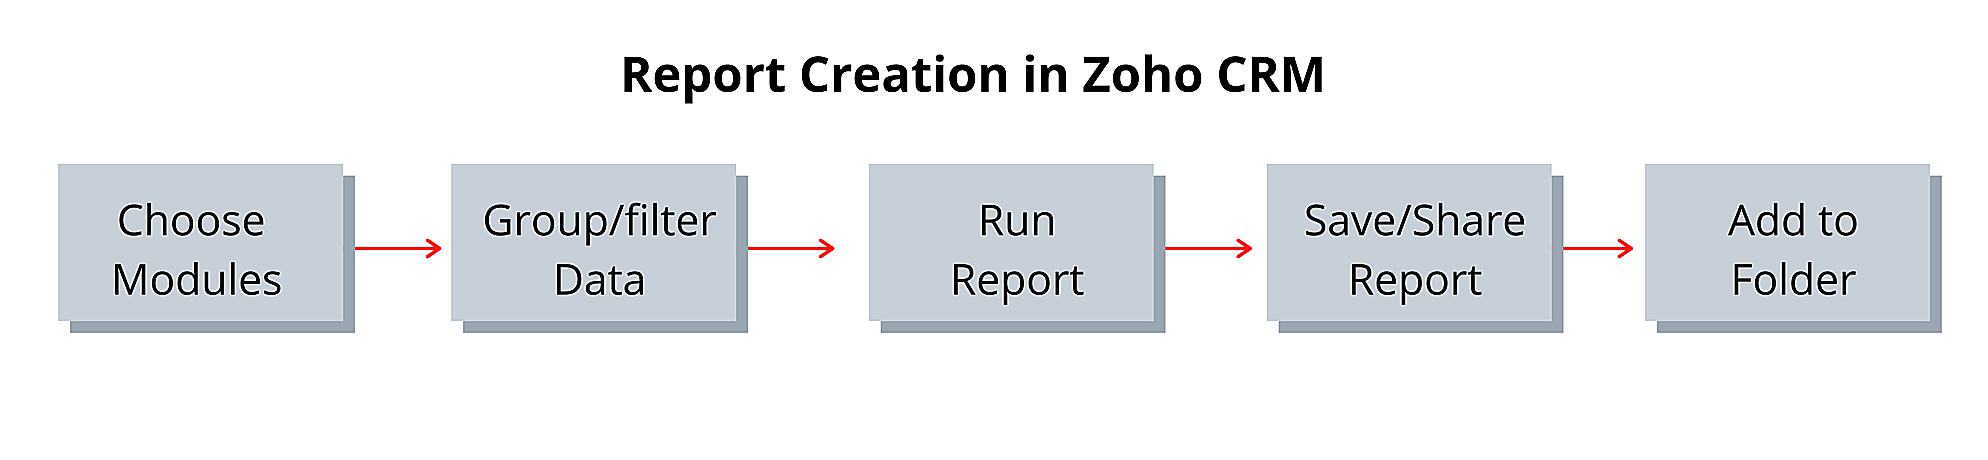
Reports in Zoho CRM help you do this by compiling relevant data to achieve specific goals, such as a monthly report that tracks newly acquired leads. Once created, you can share the report in multiple ways to those who need it.
Creating reports
Dive deeper into choosing modules for your report
When you build reports, the first step involves choosing a primary module.
The second (optional) step is adding related modules and choosing the relationships between them. The concepts presented here will help you understand this second step.
Please note that you don't need to remember all the concepts presented here. You can always refer to this page when you need it!
Building a report
Reports
can be created and shared in different formats by CEOs, managers, sales
reps, and other CRM users, and are built using data from one or more
modules in your CRM. Reports can be created for a specific module and
the data associated with it in another module, for example, accounts and
their associated contacts or deals and their associated quotes.
Start with one data set and build from there
We
allow you to build relationships between the data sets in your report,
so that only the data that matters is displayed. You can do this by
establishing parent-child relationships between the modules you want to
include.
Let's take a closer look at how these relationships work.
Primary module
The
primary module is the base module where the data for the report is
taken from. You can also choose one or more modules which are related to
the primary module to include in the report. For example, here is a report on leads acquired in the past quarter, using Leads as the primary module.
Related Modules
The
Relationship between a module is split into parent and child. The
parent listing shows all the modules referred in the lookup fields of
the primary module. Whereas, the child listing shows all the modules
referred in the related lists of the primary module. If you need only
the primary module to create the report, you can skip this step.
Parent modules
A
parent module is a module that is related to the primary module via a
lookup field. For example, if there is a lookup field for Accounts in
the Deals module, then Accounts can be selected as a parent module for
Deals. When you select a parent module, the name of the lookup field
will also be displayed. You can select more than one parent module for
the primary module in your report.
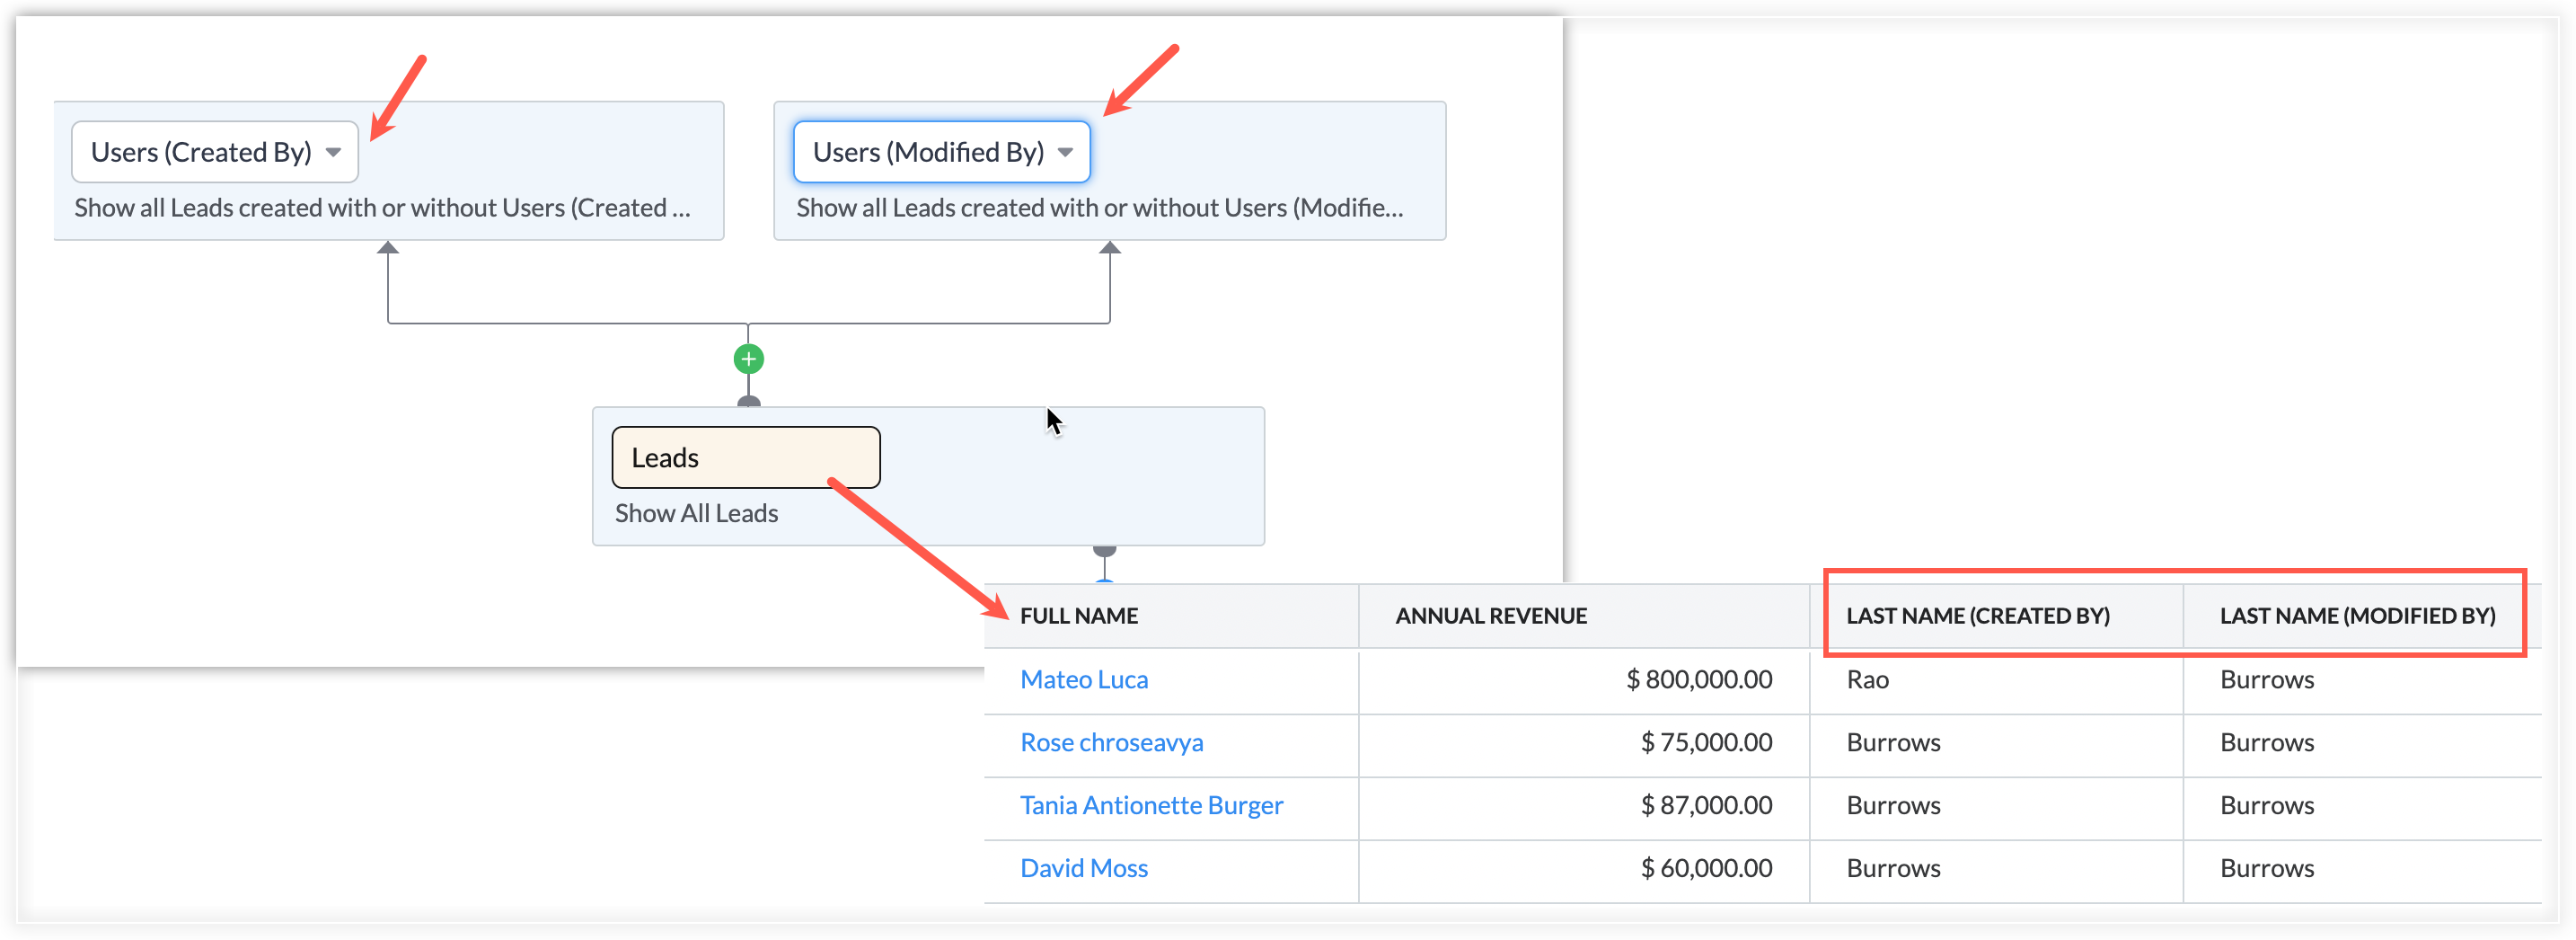
Multiple parent modules
If you want to create a report which offers more complex insights into the primary module, you can add multiple parent modules. For
example, Users (Created By) and Users (Lead Owner) can be added as
parent modules for the Leads module to display which CRM users have
worked on each lead.
Similarly,
Contact Name, Deal Owner, and Campaign Name can be added as parent
modules for the Deals module to include this information in the report. A
maximum of five parent modules can be added to each report.
Child modules
Modules
that appear in the primary module's related list can be added to the
report as child modules. For example, Contacts can be added as a child
module when the primary module is Accounts.
To create a
combination report using multiple modules, you will need to associate
child modules with the primary module. The modules available to add as
child modules will depend on the primary module.
Parent-child module relationship
When
you create a report, you can add both parent and child modules to the
primary module. The parent list shows all the lookup fields a module
has, while the child list shows all the related lists. For example, if
you choose Deals as the primary module, only the modules linked to it
via related lists will be listed as child modules.
Note :
In a report, users will be able to see all the records accessible to them in the primary module
- If this primary module is connected to parent and/or child modules and fields from those parent/child modules are included in the report
- Then, users will be able to see those fields and records, even if they don't have access to those records in the parent/child module. This applies when they have access to the modules but not to the specific records. If the user doesn't have access to either the parent or child module in their profile, they won't be able to view the report.
Drill down into related modules
You can use the parent-child relationships between modules to add more modules to a report. For
example, if you choose Deals as the primary module and then choose
Activities as a child module then you can choose from the modules which
appear as related lists in the Activities module to add as another level
of data.
Type of relationship between modules
When
you choose a child module for a report, you can choose whether you want
it to have an exclusive or inclusive relationship with its parent
module. This allows you to control what data is shown in your report.
Exclusive: An
exclusive relationship will only show records from the parent module
which have related data in the child module. For example, an educational
institution could build a report to display only the students who have a
sports scholarship. Choosing an exclusive relationship allows you to
exclude data which is not required for the report.
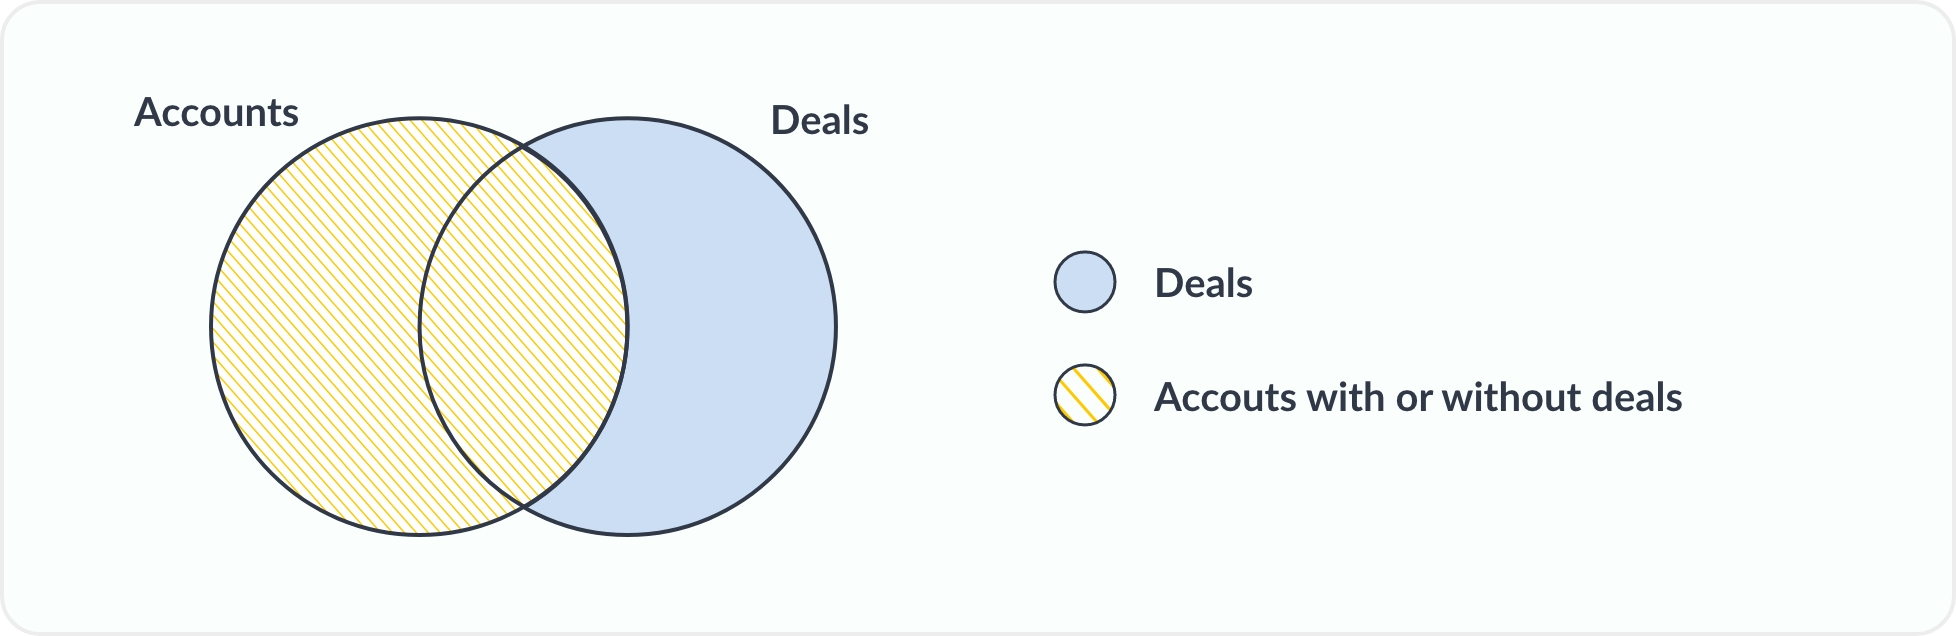
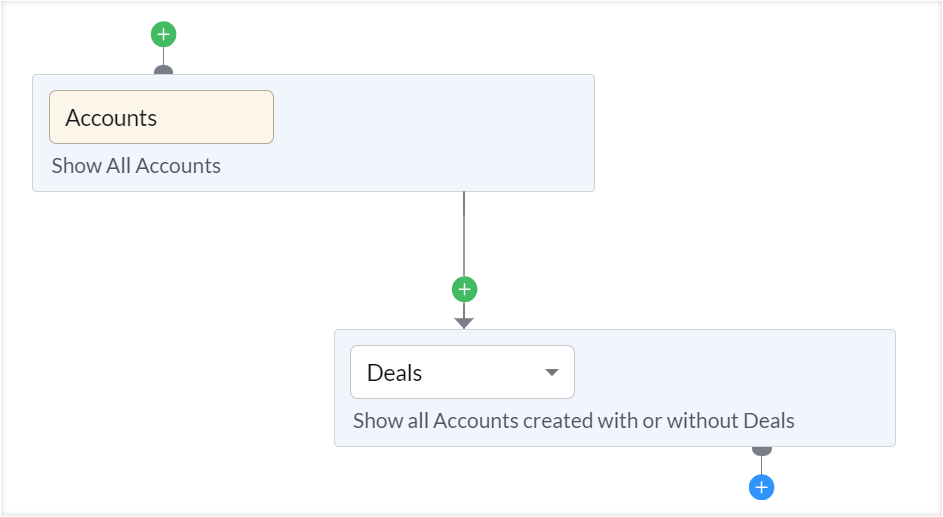
Inclusive: An inclusive relationship will show all the records in the parent
module, whether or not they have related data in the child module. For
example, you could create a report which displays all accounts, whether
or not they have deals associated with them.
Examples
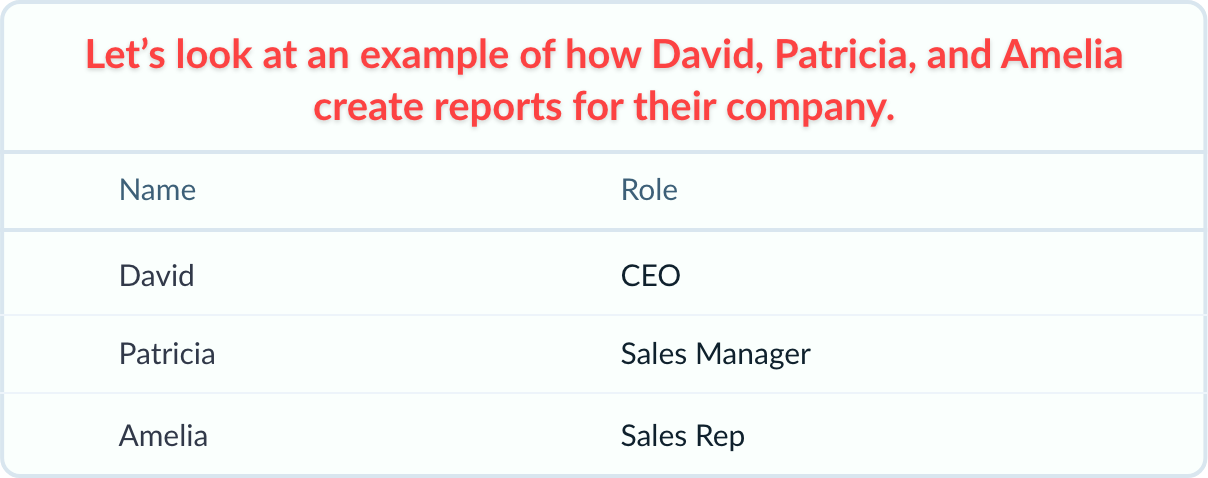
Example: 1
Patricia
wants to analyze last quarter's sales performance so she can see all
the accounts created in the past quarter and show any deals associated
with them.
She can create a report with an inclusive relationship between the Accounts and Deals modules.
Example: 2
David
wants to see the latest accounts added to the company and the status of
the deals associated with them for a discussion at the next stakeholder
meeting.
He can create a report with an exclusive relationship between the Accounts and Deals modules.
Example: 3
Amelia
wants to submit a monthly report to Patricia and David on the accounts
which have had deals created for them in the last month, showing whether
or not there are activities associated with those deals.
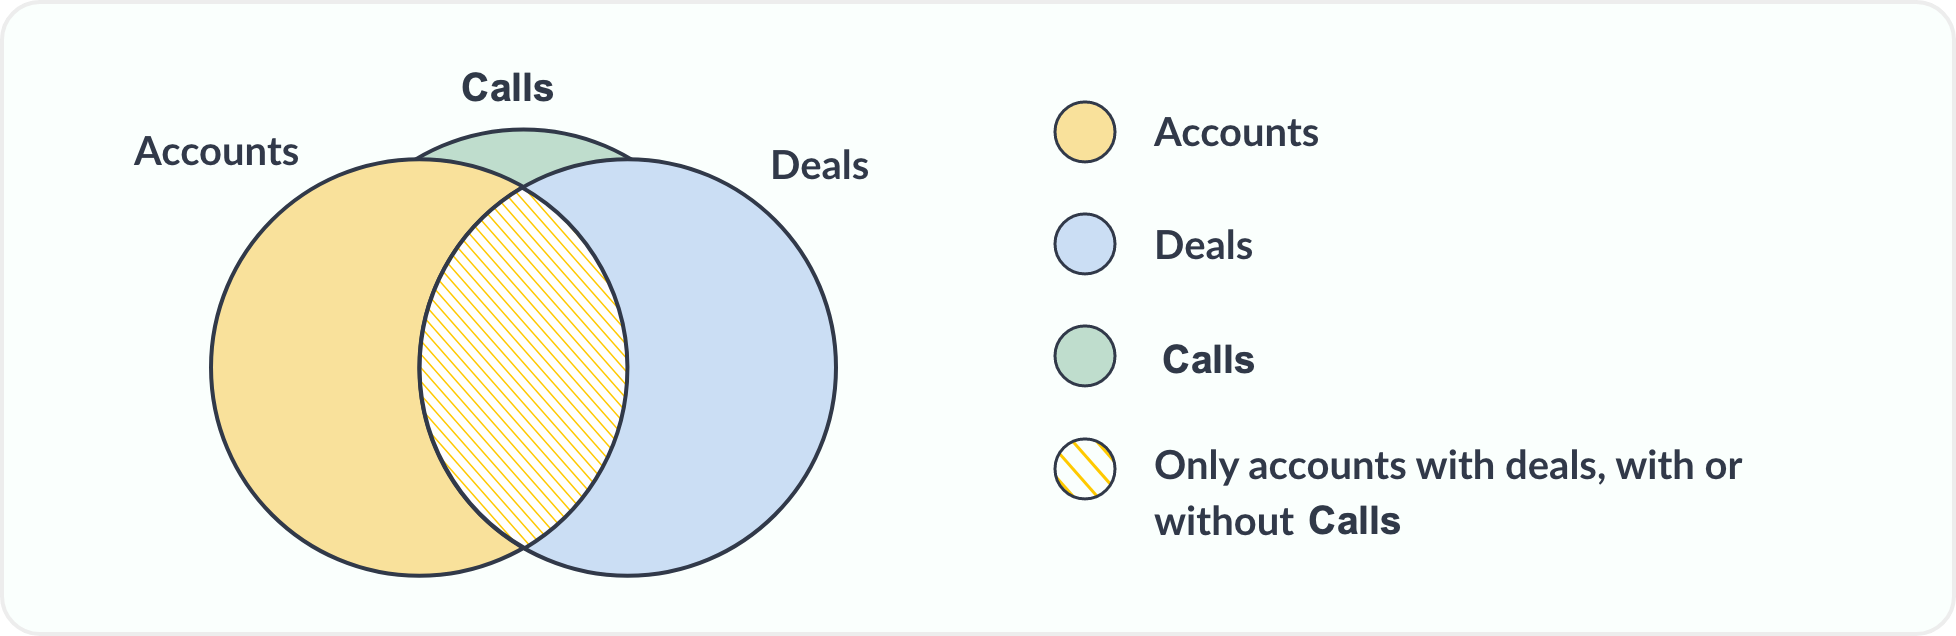
She
can create a report with an inclusive relationship between the Accounts
and Deals modules and an exclusive relationship between Deals and
Activities.
To create a report
- Log in to your Zoho CRM and click Reports.
- Click the Create Report button on the top-right to create a report..
- Choose the primary module from the dropdown.
- If you want to add more data related to the primary module, click the + icons to add additional modules.
- Click the green + above the primary module to add a parent module, or the blue + below the primary module to add a child module.
- If you add a child module, choose the relationship type as either Inclusive or Exclusive.
- Once you have added all the modules you want to include, click Continue.
You will now see the data you selected arranged in a table. This can be customized as required.
Customizing reports
When you create a report, you can customize how the data is presented by grouping or aggregating columns and rows, filtering data, and showing or hiding fields. This helps you display exactly the information you need to analyze how close you are to meeting your business goals.
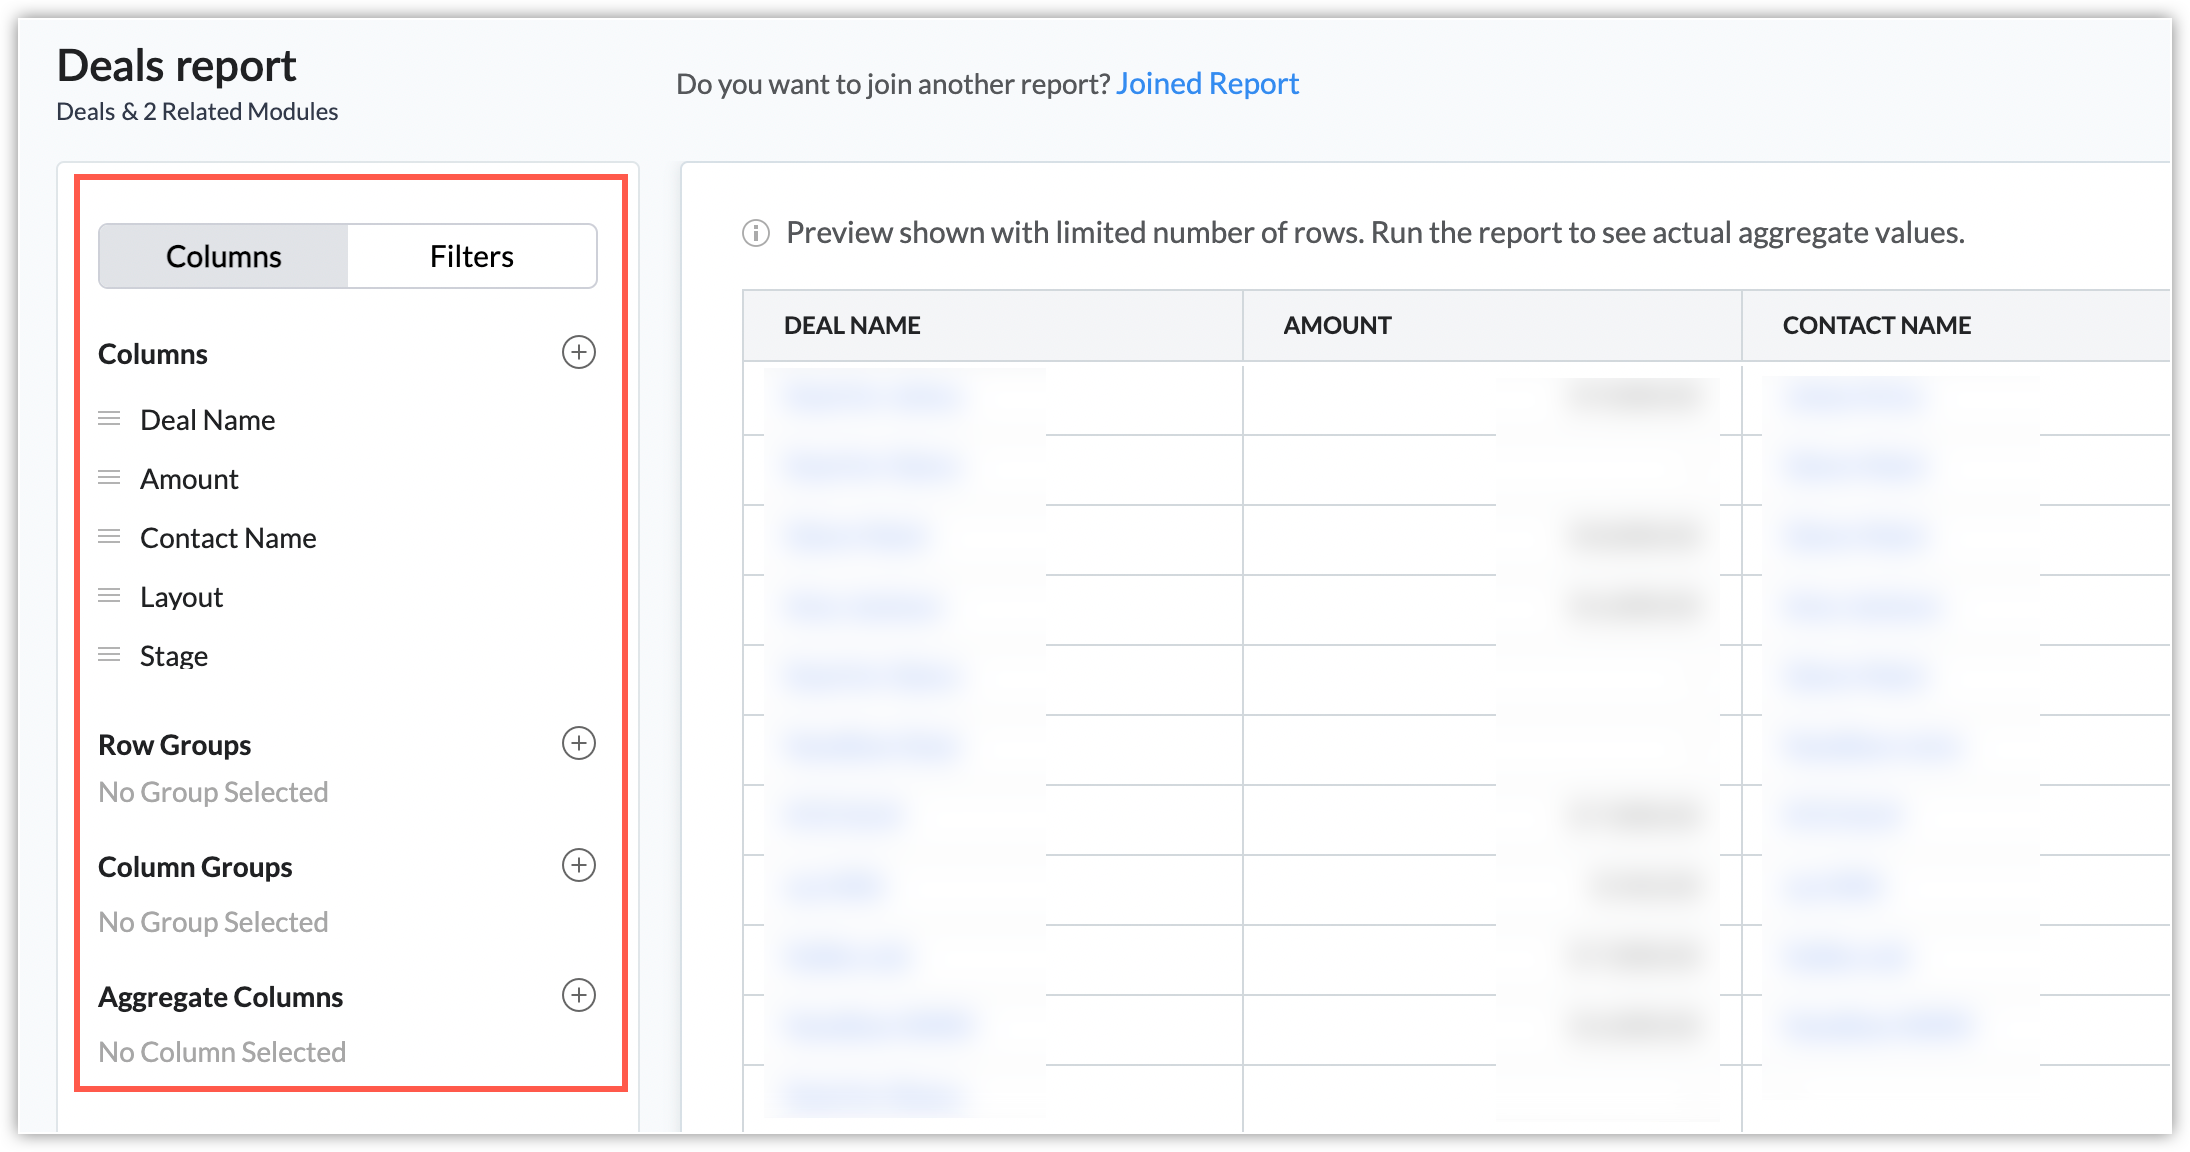
Modifying columns
Click the + icon next to Columns on the left of the report to make changes to the columns displayed in the report.
Add or delete columns from the report using the checkboxes. You can scroll down the list or use the Search Fields field to search for a particular field you want to add or remove as a column. Click Clear All to uncheck all the checkboxes.
You can drag and drop the columns to reorder them. To resize the columns, click and drag a column header's vertical lines to adjust the size of a column.
In addition, you can drag and drop the columns to reorder them.
Note:
- If you configure multi-line field as part of the report, then you can view the content only upto 255 characters in reports within the application. Records with characters exceeding the limit, will have the content constricted and collapsed at the end. However, you can expand them and view the entire content as a hover message.
Limitations on export: When you choose to do a formatted export of a report with 4 or more columns with multiline fields, then the following character limitations are applicable: - For the first three multiline columns , the export will display 5000 characters per field.
- For reports with more than 3 (four and above), the remainder of the multiline columns will display only the first 255 characters.
- With this constriction in place, if you export a report, the formatted export will export the report with current view and truncated content. If you rely on the values in the multi-line fields for your analyses (say, you want to analyze customers' requirements), in which case we recommend you use the detailed export type.
- You have about 10 multiline fields in a report.
Filtering data
You may not need all of the data in your CRM for your report. For example, you might only want to display information about the leads created in the last 30 days. You can add a filter to the report to limit the data it shows.
Select the Filters tab and then click the + icon next to Filters. Choose the filter criteria in the Add Filter popup. There are two ways to create filters:
- Create date-based criteria to filter records based on the date fields in the primary module used for the report.
- Create advanced filters using other fields as well. Define the criteria that records must match to be included in the report.
You can add a static value (example: USD 40,000) or choose another field from the selected modules to define the criteria. This helps you perform field-to-value comparison or field-to-field comparison based on your needs.
Notes:
- The fields used in a criteria should be of the same data type.
- All the fields present in the modules used in the report will be displayed in the criteria.
- For joined reports, the filter will be configured and applied for each report.
Limitations:
- Currently, you can only use the following field type as criteria value:
- Date, date and time
- Checkbox
- Number, decimal, percentage, and long integer
- Currency
If multicurrency is enabled in your organization, you can use the fields from the same module to compare and filter. - You currently cannot use other data types like picklist or look up fields to compare and qualify.
- You can add up to four filter criteria for a report.
Grouping data
If you have a large amount of data in a report, you can condense it into groups to make it easier to understand. Grouping data generally means segmenting or categorizing it based on specific properties. This helps users to focus on the important information that they are looking for. You can group rows and columns in reports to categorize the records based on specific criteria.
For example, you added a few records to your CRM. You could create a report to view the records created in each month during that year. You can create a row group to categorize the records by Added Month. You might then want to be able to see the lead source for the records added in each month, so you could create a column group using the Lead Source field. This will allow you to view the leads created in a specific month and their source, for easy comparison.
Row and column groups can be used to make it easier to summarize complex information or compare values in different fields.
Grouping rows
Grouping rows allows you to group all the records in the same category. For example, you can create a row group for the Industry field to consolidate customers based on the work they do.
To group rows, click the + icon next to Row Grouping choose the fields you want to group by from the list.
Grouping columns
Column grouping is used to create another layer of grouping within the row groups. For example, to categorize records that have already been grouped by Industry by their Annual Revenue and Account Type. If you use both types of grouping, the data will be displayed in a grid format with both row and column labels, also known as a matrix report.
To group columns, click the + icon next to Column Groups and choose the fields you want to group by from the list.
Aggregating data
Aggregating data allows you to perform calculations on the row and column groups you create. You can use these functions to display the sum, average, largest value, lowest value, and number of records. For example, you could find the average annual revenue and the total number of employees in each billing country.
To aggregate data, click the + icon next to Aggregate Columns and choose the fields from the list. Under Show Details link, uncheck the Detail Rows, Sub Totals or Grand Totals boxes as per your requirement.
Joined reports
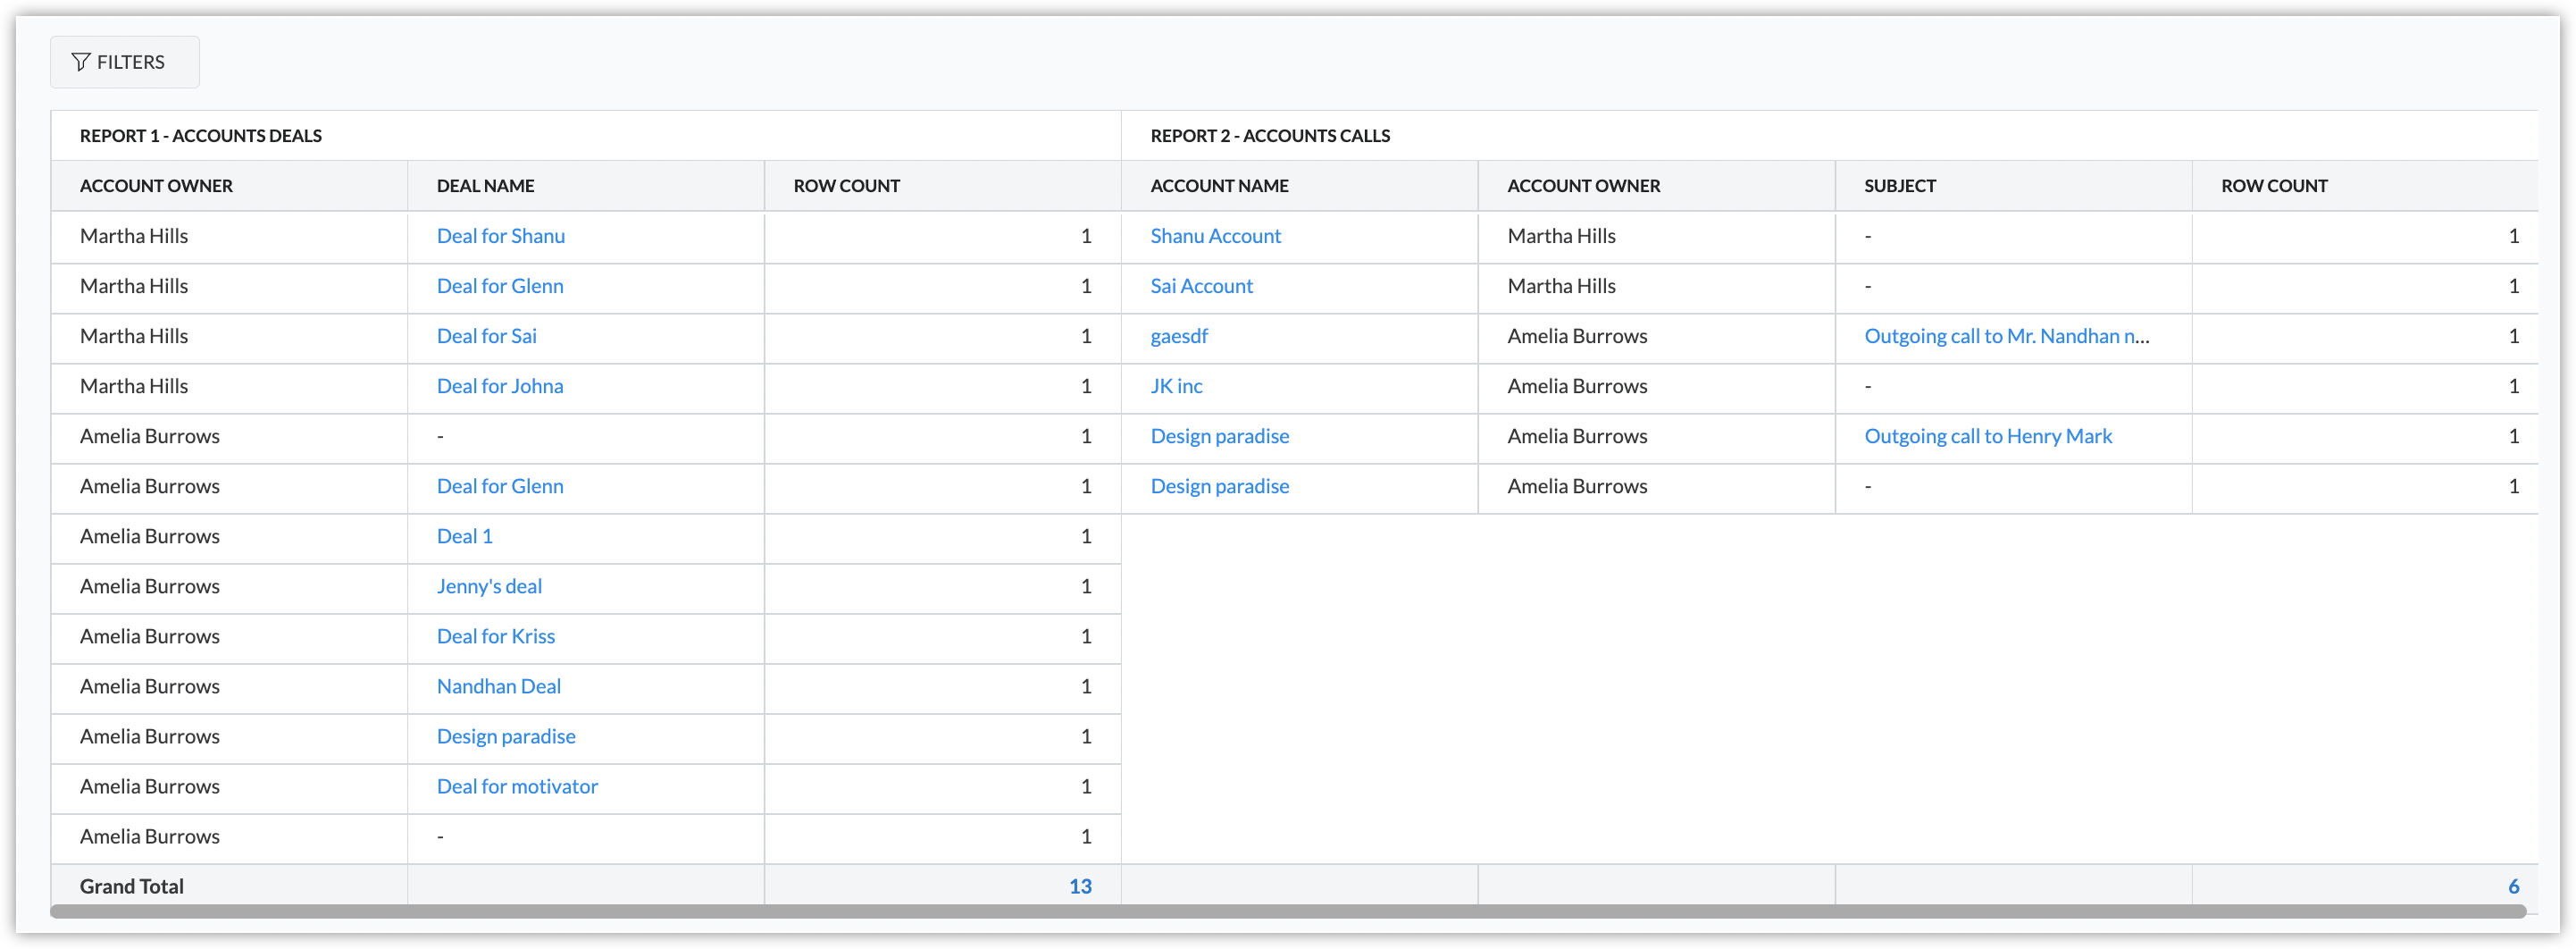
You can join two or more reports to create a combined view. This lets you compare different data sets from the same module side by side. You can only join reports which were created with the same primary module.
For example, you could join three reports which all have Accounts as the primary module, showing data about the deals, quotes, and invoices associated with accounts, respectively. This will let you see the deals, quotes, and invoice status for each account name at a glance.
Note:
You can add primary module's fields as 'row groupings' which will group all the reports associated with that join report.
To join reports
- Open an existing report and click the Join Report link at the top of the report.
- Click Add Report in the Create Join Report and choose reports from the dropdown. You can join a maximum of three reports.
- Rearrange the reports as required via drag-and-drop.
- Click Done.
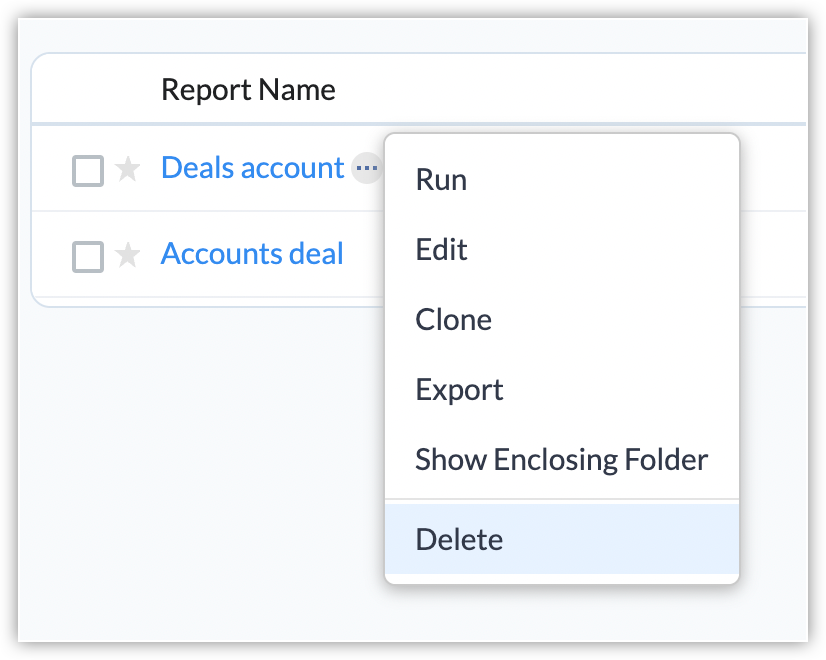
Performing actions on reports
You can perform quick actions using the icon next to a report's name on the Reports list page. The Run, Edit, Clone, and Export options can also be accessed from each report.
Running and editing reports
Once you have created a report, you can run it to preview how the data will be displayed.
Cloning reports
Copy a report's data and customization by cloning it. Click the Clone option and the cloned report will open automatically.
Export reports
Export reports to download them in Excel, PDF, or CSV format. You can choose to export the report in either of the following types:
- A formatted report that includes all the row and column groupings you have created, and will be exported in the exact formatting as seen in UI.
- A detailed report that does not include any row or column groupings.
To export a report
- Navigate to the Reports tab.
- Hover over the report you want to export and click the more icon
. Select Export.
Alternatively, you can open a report. Click the down arrow near the Edit button and select Export. - Based on your needs, you can:
- Choose the Export Type as formatted report or detailed report.
- Enable the Show record ID column checkbox if you want to include the primary module's record IDs in the export.
Please note that if you've added the primary module's record ID as a column in the report, it will be included in the export even if you've left this option unchecked. - Choose the Export format as Excel, PDF, or CSV.
- Click Export to initiate the export.
Note:
- You can export a maximum of up to 2000 rows in formatted export and 50,000 rows in detailed export
- Make sure you sort the columns so that the rows you need to export are at the top. For example, in a formatted report with (6000) rows, only the top (2000) rows will be exported.
- Daily report export limits:
Formatted Reports: Unlimited exports.
Detailed Reports:
Free Edition: 0 exports
Ultimate Edition: Up to 300 exports
Other Editions: Up to 200 exports
Sorting order in reports
Ascending (Asc) and Descending (Desc) are the sorting options available for columns in a summary or matrix report. The columns can be sorted in any order, depending on the requirement.
For example, the column Account Type is sorted by ascending order.
Filtering a report using the quick-view filter
In addition to the filters present at the report's customization stage, you can use the quick-view filters to quickly sort the processed report based on the desired characteristics.
You can use the following data types to sort the report:
Date, Date Time, Checkbox, User Lookup, Picklist, Multi Pick List.
Notes:
You can apply only up to five filters to a report.
In addition to this quick filtering of the report, you can also pre-define the filter criteria in the report customization stage. This pre-defining of criteria will help share contextual report values to the recipients even if the report is exhaustive. 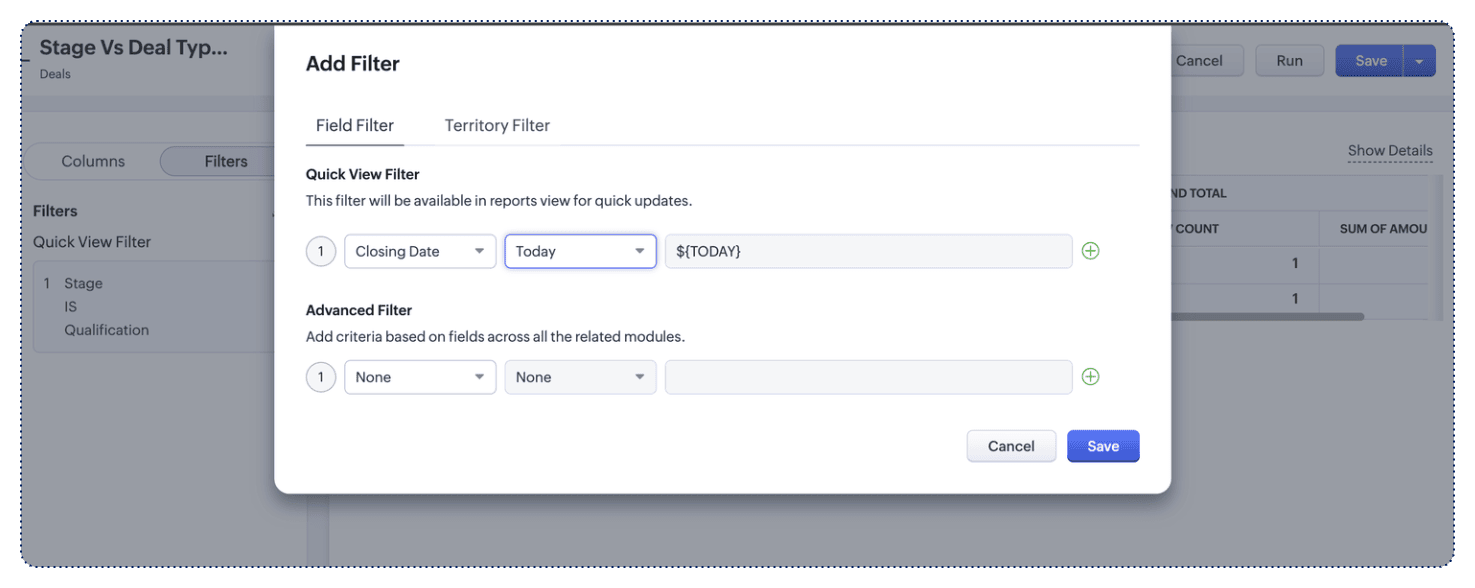
To set quick view filter criteria
- Go to the report you want to sift through.
- Hover or click on the filter option from the left side of the reports page.
- Provide the criteria by choosing the fields, qualifier, and value(s).
- Click Apply Filter to view the results.
- If you'd like to view all the values of the report, you can clear the filter attributes by clicking the Clear options from above the report.
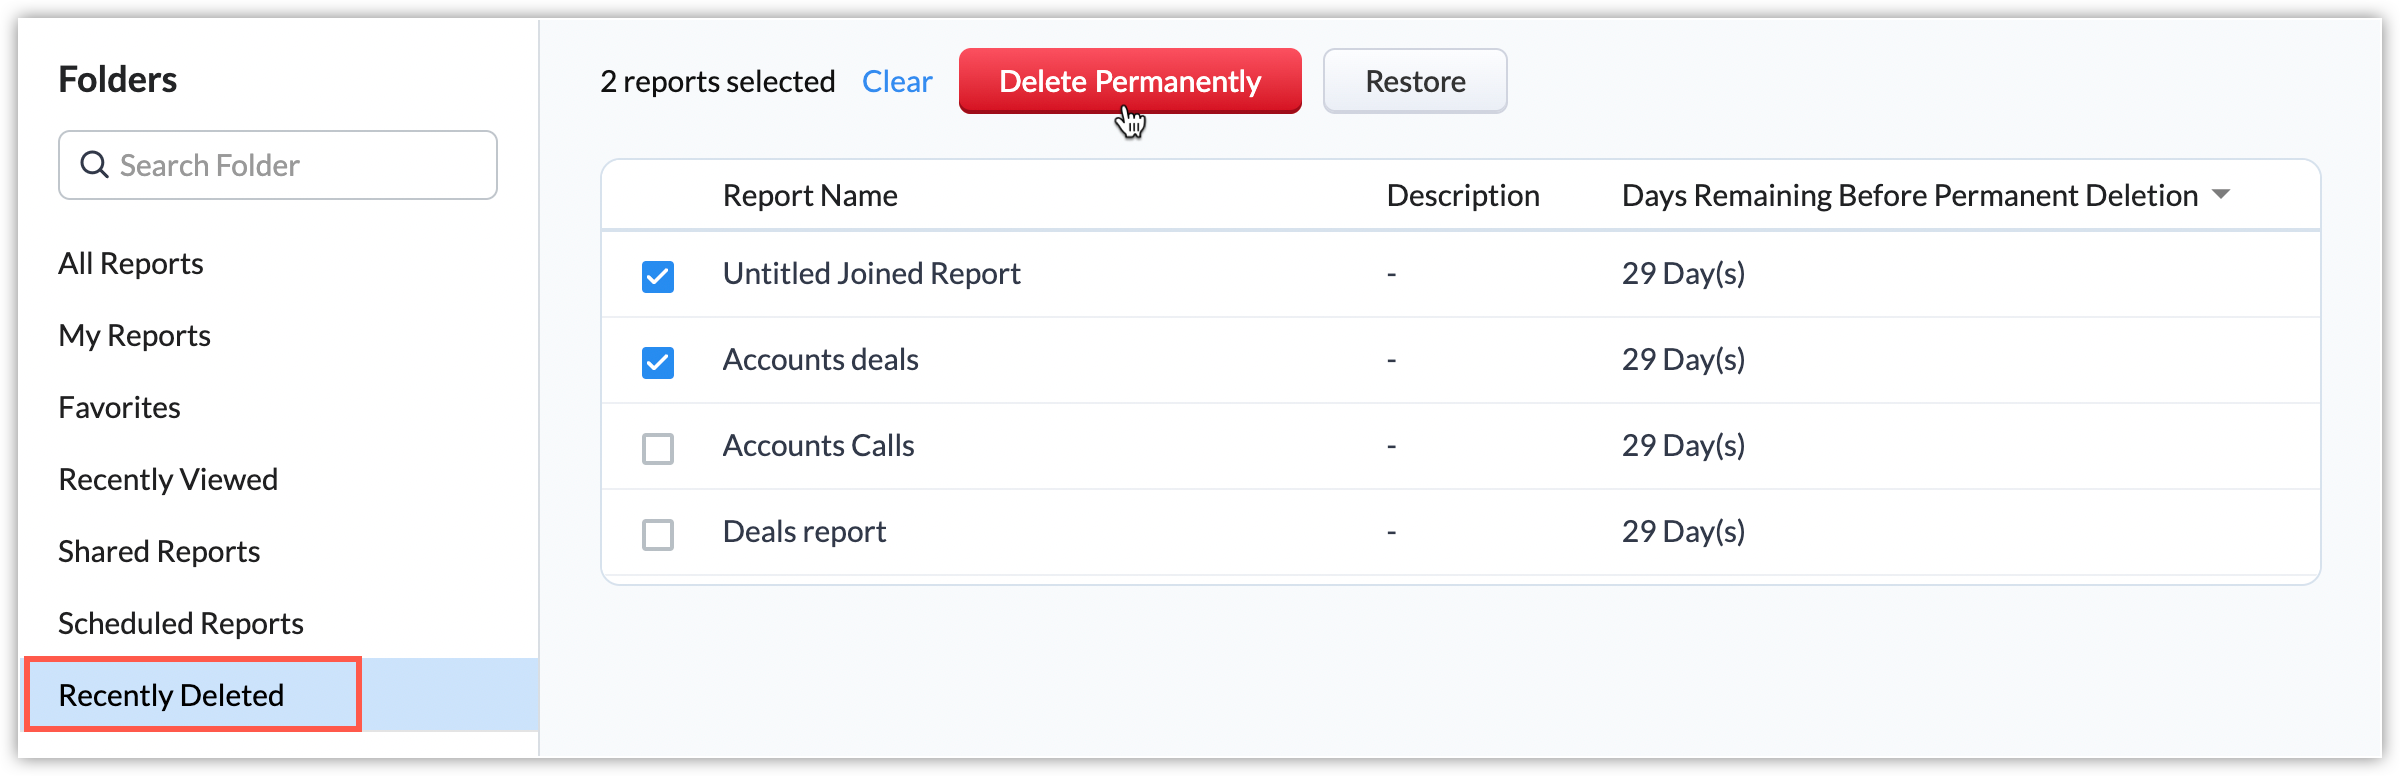
Deleting reports
You can delete reports that you no longer use. The deleted reports will appear in the Recently Deleted list for 30 days, and then they will be permanently deleted. You can also choose to restore them from the Recently Deleted list, or delete them permanently before the 30 days have elapsed.
Creating charts for reports
Communicate the findings from your report more effectively by creating visual representations of your data as charts. You can create a range of different types of charts, like pie, bar, or line charts, when you finish creating your report.
To create a chart
- Go to the report and click Create Chart.
- Choose the field names for Grouping (x-axis) and Measure (y-axis). Choose the type of chart from the dropdown.
- Click More Options to add benchmark and grouping limits to the chart.
- Click Save. Your newly created chart will appear on top of the report. You can edit or delete the chart at any time.
Add charts as dashboard components
The charts can be used to provide analytical insights to your organization. You can add them to your dashboard as a component by clicking Add to Dashboard. Enter a name and choose the dashboard you want to add the chart to in the Add to Dashboard pop-up.
Note:
Editing or deleting a chart from a report will have no effect on any dashboards the chart has been added to.
Roles and permissions for reports
There are two types of users who can view reports: the report owner, who created the report, and the users the report is shared with. Permissions to create, view, and share reports are based on the user's role type.
|
Role Type
|
Permission Available
|
|
User
|
1. Create, view, and share their own reports.
2. View other reports which are in a folder which has been shared with them.
|
|
Administrator
|
1. Create, view, and share their own reports
2. View all reports created by other users in the account, irrespective of the sharing permissions. |
Note:
Users with the Manage Reports permission can create, edit and share report folders.
Sending reports via email
Share reports with other members of your organization via email so they can view and analyze them. You can share them immediately or schedule the email to be sent at a specific time and date.
To share reports via email
- Click the down arrow next to the Edit option for the required report in the list of all your reports.
- Click Send Email in the dropdown.
- On the Mail Sending Options pop-up, do the following:
- Choose the email template to use.
- Choose the users' email addresses in the Recipients field.
- If you want to share the report with people outside your organization, enter their email addresses in the Additional Recipients field.
- Choose an export type for the file type.
- Enable Show record ID column if you want to include the primary module's record IDs.
- Select either Send Immediately or Schedule for Later in the Send Options dropdown.
If you choose to schedule the email for later, add a date and time. - Click Send.
Report folders
If you're dealing with a large number of reports, it can quickly become difficult to find and share specific reports. To avoid getting overwhelmed, you can create folders to track and manage your reports. For example, it may be helpful to create a folder containing all reports related to Q1.
There are some predefined folders on the Reports list page, such as All Reports and Favorites.
The custom folders that you create will be listed below these default folders. By default, folders are listed in the order they were created. To change this order, click the Edit Folders
Add reports to existing folders
When saving a report, you can choose the folder to put it in from the Folder dropdown.
To create a new folder
- Create a new report and click Save.
- Choose + Create Folder from the Folder dropdown on the Save Report As pop-up.
In the Create Folder pop-up:
- Enter a name for the folder.
- Select Only me, Everyone, or Selected Users in Share Folder to set the access permissions.
- If you chose Selected Users, choose individual users to share the report with or select groups, roles, or roles and their subordinates to share the report with.
- Click Save.
Performing actions on reports folders
You can change a folder's name, share it within your organization, or hide it from the list. These actions can be selected by clicking the icon next to the folder's name in the Reports list page.
To rename a folder
Click Rename and enter the new name in the Rename Folder pop-up.
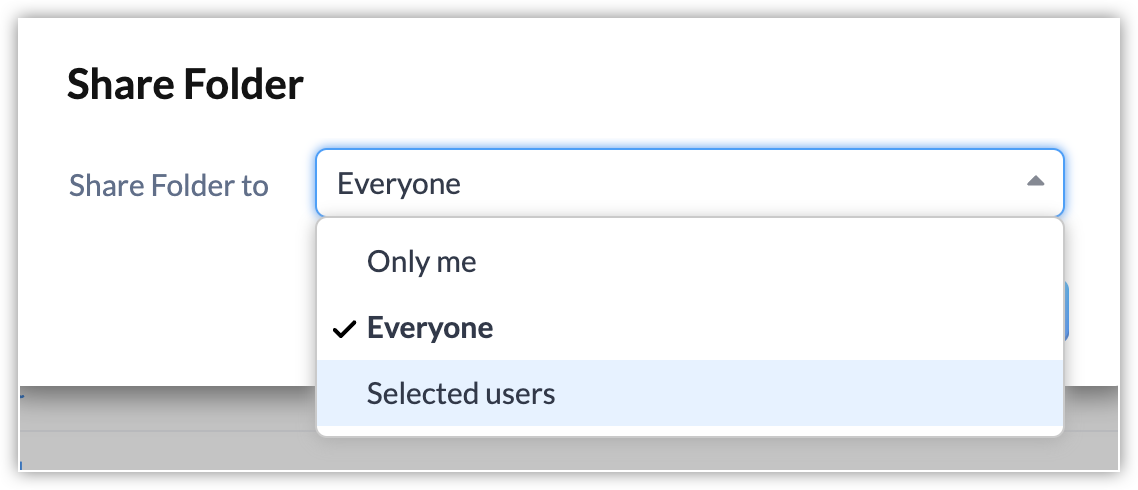
Sharing report folders
Click Share and set the permission to Everyone, Only Me, or Selected Users in the Share Folder pop-up. If you choose Selected Users, select individual users to share the report with or select groups, roles, or roles and their subordinates to share the report with. When you share folders with users, they will automatically appear in the list in their Reports module.
Hiding report folders
Click Hide to hide the folder from the list. The reports in the folder will still be listed under Reports. To display a hidden folder, click the edit icon next to Folders and uncheck the folder in the list.
SEE ALSO