Segment dashboards
A segment dashboard in ABM for Zoho CRM refers to the user interface that provides visual insights and analytics related to specific segments of target accounts. This dashboard displays key performance indicators, engagement metrics, and other relevant data to help users monitor and assess the effectiveness of their marketing efforts within those segmented accounts.
Types of Segments
In this section, you will:
- Understand the different types of segments.
- Familiarize with the Segment detail page.
A user can find a list of groups of accounts having similar traits in segmentation. The segments are summarized in a card view. The card view contains:
- name of the segment,
- number of accounts in a segment
- revenue generated by accounts in the segment
- revenue in pipeline in the accounts in the segment
- nature of the segment
- type of segment
- last updated time
- A card view for a dynamic segment will display the accounts entered and exited.
- Here are the segment limits for each edition at any given time:
- Enterprise, Zoho One (Enterprise): 5 segments
- Ultimate, CrmPlus: 15 segments
Dynamic and Static Segments
Based on the nature of the segment, it is categorized as Dynamic and Static.
Dynamic segment
The entry and exit of the accounts is not restricted. If any account which initially did not fulfill the criteria of the segment and later does, will enter the segment as and when the criteria is fulfilled. Likewise, if any account which initially fulfilled the criteria and later does not, will exit the segment as and when the criteria is not fulfilled. A user can dictate a time frame in which the entry and exit of the account will be allowed. For example, the user can set the time frame as three months, which means the segment will be updated with a revised set of accounts ONLY once in three months.
Static segment
The entry and exit of the accounts is restricted. The accounts will be entering the segment only at the time of segment creation and will not exit the segment at any circumstance. During the creation of segment, the accounts that fulfill the criteria, only those instances will enter the segment and even if the same accounts fail to fulfill the criteria at a later point of time will not exit the segment. Likewise, any accounts which fulfill the criteria of the segment at a later point of time will not be allowed to enter the segment. The population of the segment is always static. Hence, the name.
For example, TruSpace creates a segment for accounts that buys only the cooling system. Accounts that currently have made deals buying cooling systems from TruSpace will enter the segment. After 6 months, an account stops buying the product for good, the segment with not remove the account from the segment and will contimue showing the account in this segment. This is because the segment is static and will not show any real-time change with numbers.
Dependent and Individual Segments
Individual segment is a simple and straightforward segment and does not depend on any other segment. This is also called the Parent segment.
The Child segment, as the name suggests, will always depend on the Parent segment. For example, if the parent segment is “India accounts”, “India cooling systems account” is one of the child segment. The child can never exist without a parent. An account must fulfill the criteria of both Parent and Child to enter the Child segment.
Parent-Child relationship is a 2 tier hierarchy i.e., Parent can never have grand children or a child segment can’t have another child. A child segment itself can act as a segment and portrait all the features of a segment. For example, an ultimate edition user can have 15 segments (inclusive of child and parent).
Segment View
A segment dashboard in ABM is designed specifically for a particular target account that displays information and insights about the specific segment. This page typically includes data on the company's revenue in pipeline, revenue generated, number of accounts, number of accounts entered/exited a segment (for dynamic segments only), and the last refreshed time of the segment.
Actions on the Page
Apart from viewing the details about the segment, you can perform a limited number of actions on the page.
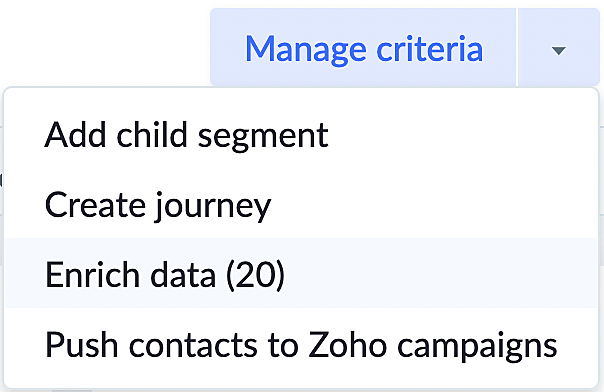
You can do the following actions for the currently displayed segment on page:
- Add child segment - Allows you to navigate to the creating a child segment panel, where you can add a child segment.
- Create journey - Allows you to navigate to the journey builder panel where you can create a journey.
- Push contacts to Zoho campaigns - You can directly choose to create a list of all contacts or specific contacts for a Zoho campaign. This makes the task of sending campaigns to a segment a lot easier and also hitting the right audience at the right time.

- Mailing List Creation:
- Customers can create a mailing list for all contacts within a specific segment.
- This list is established in the Zoho Campaigns service and is usable in both CRM and campaigns.
- Contact Push Criteria:
- Contacts are pushed based on chosen criteria types.
- Criteria types include either pushing all contacts or those matching specified criteria to the list.
- The contact push process is scheduled.
- Limitations During Push Process:
- While an existing push process is ongoing, customers cannot initiate another push by modifying criteria.
- Addition of New Contacts:
- New contacts are pushed to the list in the following cases:
- Contact criteria are changed.
- Segment configuration is edited.
- Global criteria are edited, leading to the addition of contacts from newly added accounts.
- List Deletion and Recreation:
- If the list is deleted in Zoho Campaigns, users can create another list within the segment.
- Contacts can then be pushed to the newly created list.
- Requirements for Creating a Mailing List: You need to have Zoho Campaigns integration and active sync configuration for the contact module in ABM.
- Who Can Create Lists: Initially, only the Zoho Campaigns admin can create a mailing list.
- After the First Time: Non-admin users can create new lists or edit existing ones.
- Limitation for Non-Campaign Users: Users without access to Zoho Campaigns cannot use this feature because they don't have the necessary permissions.
Segment dashboard often provide ABM teams with a comprehensive understanding of their target accounts, allowing them to tailor their marketing strategies and outreach efforts to better resonate with their audience. Additionally, segment view pages may include a range of content, such as the segment journey, the recommendations for the segment, account distribution, and so on.
The four tabs on the Segment View page are:
- Home - You can view the overall associations of the segment within CRM. Also, the performance of the segment and the actions related to the segment are displayed here.
- Accounts - You can view the details of the individual accounts within the segment. You can perform two actions on this page.
- Distribution - You can see the accounts distributed across the segmentation techniques. Viewing accounts distributed across segmentation techniques under the distribution tab helps identify patterns and trends in customer behavior, enabling targeted marketing and personalized strategies to improve overall business performance.
- Voice of Customer - Provides valuable insights into customer feedback and preferences, facilitating informed decision-making and enhancing customer satisfaction.
You can choose to change the settings of the VOC by clicking Configure. You are allowed to change the settings only thrice a day. You can change the settings based on:
- Response Count
- Account Count
- Contact Count
- Time
The table below displays the various components within each tab of the segment view.
| Home | |
| Insights | Displays the total number of accounts that entered ABM, the number of accounts that entered that particular segment, and the number of accounts that exited the segment. |
| Performance |
Displays the number of accounts that got engaged with the segment and the total possible revenue in the business pipeline, and the revenue won till date. On clicking Analytics, you will be directed to the Analytics page where you can view:
|
| Deal Trends |
Displays data over time to identify patterns such as increasing or decreasing sales based on open and closed deals.
|
| Journeys |
View the journey associated with the segment and the current and participated accounts. By clicking a journey, you navigate to the journey builder page, if the associated journey is in "draft" state, else it will navigate to the Journey Insights page. You can navigate to the journey builder page by clicking the journey.
|
| Revenue distribution |
Chart presents insights on the distribution of ABM accounts based on the gross income.
|
| Accounts | |
| Filter by techniques |
Apply filter criteria for more specific analysis based on the configured segmentation techniques.
|
| Filter by fields |
Apply filter criteria for more specific analysis based on the account owner, account name, annual revenue, location, and industry.
|
| Filter by score | Apply filter criteria for more specific analysis based on the configured account score or contact score. |
| Distribution | |
| Distribution based on RFM |
A pie chart presents insights on the distribution of all the accounts present in the segment, which is determined by labels in the RFM segment.
|
| Top 5 locations based on Accounts |
The top 5 locations based on accounts reveal key geographical concentrations within the dataset.
|
| Distribution based on Firmographics |
A bargraph chart presents insights on the distribution of all accounts in the segment, which is determined by labels in the Firmographics segment.
|
|
Distribution based on engagement labels
|
|
|
Account distribution based on revenue ($)
|
|
|
Top 5 industries based on Accounts
|
|
|
Distribution based on VoC labels
|
|
|
Distribution based on Recommendation labels
|
|
| Voice of the customer | |
|
Overall Account count by sentiment
|
In this pie chart, the metric shows the total number of customers that have given you positive, negative, or neutral feedback.
|
|
Overall Account count by intent
|
In this pie chart, the intent analysis goes deeper and identifies whether a piece of text is a complaint, suggestion, or query and so on.
|
|
Competitor overview
|
The pie chart displays the sentiment of customers on our competitors. This information is derived from Zia's competitor alert feature.
|
|
Frequently occurring keywords by sentiment
|
In this keyword cloud chart, important terms or keywords that are frequently used by your customers are identified and the underlying sentiment of those terms is highlighted.
|
|
All keywords tabular view
|
The tabular chart displays all the keywords from all channels, their sentiment and the customer count for each keyword. The chart displays a maximum of 10 keywords for each sentiment, resulting in a total of 30 keywords.
|
|
Deal lost after receiving negative sentiment
|
In the bubble quadrant chart, you have information on how many deals lost after receiving negative sentiment across four different quadrants sorted based on revenue and subscription period. Your most important customers are in Quadrant 1, and so on. This is an important inference which calls for swift action, perhaps with better onboarding and support.
|
|
All keywords while mentioning competitor tabular view
|
The tabular chart displays all keywords spoken by customers about the competitors across channels. Here, you can filter the records by sentiment and competitor.
Note:
|
|
Keyword-wise Deal lost cohort
|
This cohort chart displays the number of deals lost when certain keywords were spoken by contacts over a period of time.
|
Once you are done with segmenting your account, you will be able to view customer data per the options that you set in your initial configuration for ABM. In addition to the three mandatory steps in the configuration, ABM offers three more additional options to enhance your segmentation to better engage with your customers:
- Integrations
- Data Enrichment
- Export
Suggested segments:
In addition to manually creating segments, ABM for Zoho CRM also comes with suggested segments. These suggested segments are standard suggestions with focus on increasing revenue, increasing engaement, and reducing churn. It makes use of the labels and scores you have configured in your segmentation techniques to come up with a combination of criteria that could qualify your accounts to fit into these plausible standard segments.
Following are the segments that will be suggested based on your accounts' qualification:
Each of these suggestions will provide you with insights on the number of accounts that match these criteria and the revenue these accounts could bring in. Thus, even if you don't have these criteria combination already planned for your business, these standard suggestions could show prospective benefits. If it is appropriate to your business goals, all you have to do is to Add as Segment, and they will be removed from the suggested segments dashboard and added as segments itself.
Upon adding, you can tweak the segments, add more criteria, expose them to Zoho CRM, push accounts in these segments to Campaigns as mailing lists, create journeys, and more.