Zia Presentation
"We rely on data to tell us what has happened, and stories to tell us what it means."
The world is gravitating towards data storytelling.
A compelling narrative, built on contextual data analysis, portrays your business performance like nothing else.
However, to come up with such personalized analyses, you would often have to rummage through your dense CRM database, run multiple reports and dashboards, and compile them as informative slide decks. It amounts to a lot of manual work amid your already-busy daily business chores.
- Tom, tomthedesigner.com
But what if we say Zia could cover the data compilation part for you so that you can take the lead for your narrative?
Zia Presentation - Overview
From boardroom meetings to chats over coffee, business analysis and business decisions have always relied upon well-structured and classified presentations . It's a great medium through to tell the world your business story using charts and graphs.
Zia, with its generative intelligence and understanding your data preferences, will compute your users' data sets and compile usage-based personal and business insights as engaging, meaningful, and easy to understand presentation slides. As an admin, all you had to do is to educate Zia about your data preferences and how you'd like to publish them.
Imagine the monthly sales performance meeting, for instance, where your organization collectively discusses projections like the number of leads generated, qualified, and converted, the number of deals won, lost, or stalled, the highest performing products, and the lowest performing territories. Zia Presentations is handy for recurring reviews like this, which normally require you to collate cumulative data each time, as it saves you a substantial amount of time and effort.

Availability
Permission required
- Zia Presentation is available only for organizations with 10+ user licenses in the Professional and above editions of Zoho CRM.
- Organizations registered in the US, IN, CN, AU, EU, and JP can access this feature.
- Only administrators can configure and distribute presentations.
Zia's insights
Zia studies your CRM organization methodically and displays module-level insights in each slide. It showcases performance-related KPIs and behavioral analytics to give you a holistic view of your CRM.
Below are the insights and KPIs displayed each month, based on the data available in your CRM organization.
Lead information
The following lead KPIs are displayed in this slide:
- Number of leads created
- Number of junk leads
- Number of untouched leads
- This Week leads

Notes :
- Records without any activity after creation are classified as untouched records.
- While all the KPIs are based on a monthly analysis, the This Week Leads KPI details the number of leads created in the last week of the given month.
Deal information
This section will display the following KPIs for your Deals module:
- Number of open deals
- Number of deals created
- Number of deals won
- Number of deals lost
- Average sales cycle
- Sum of revenue
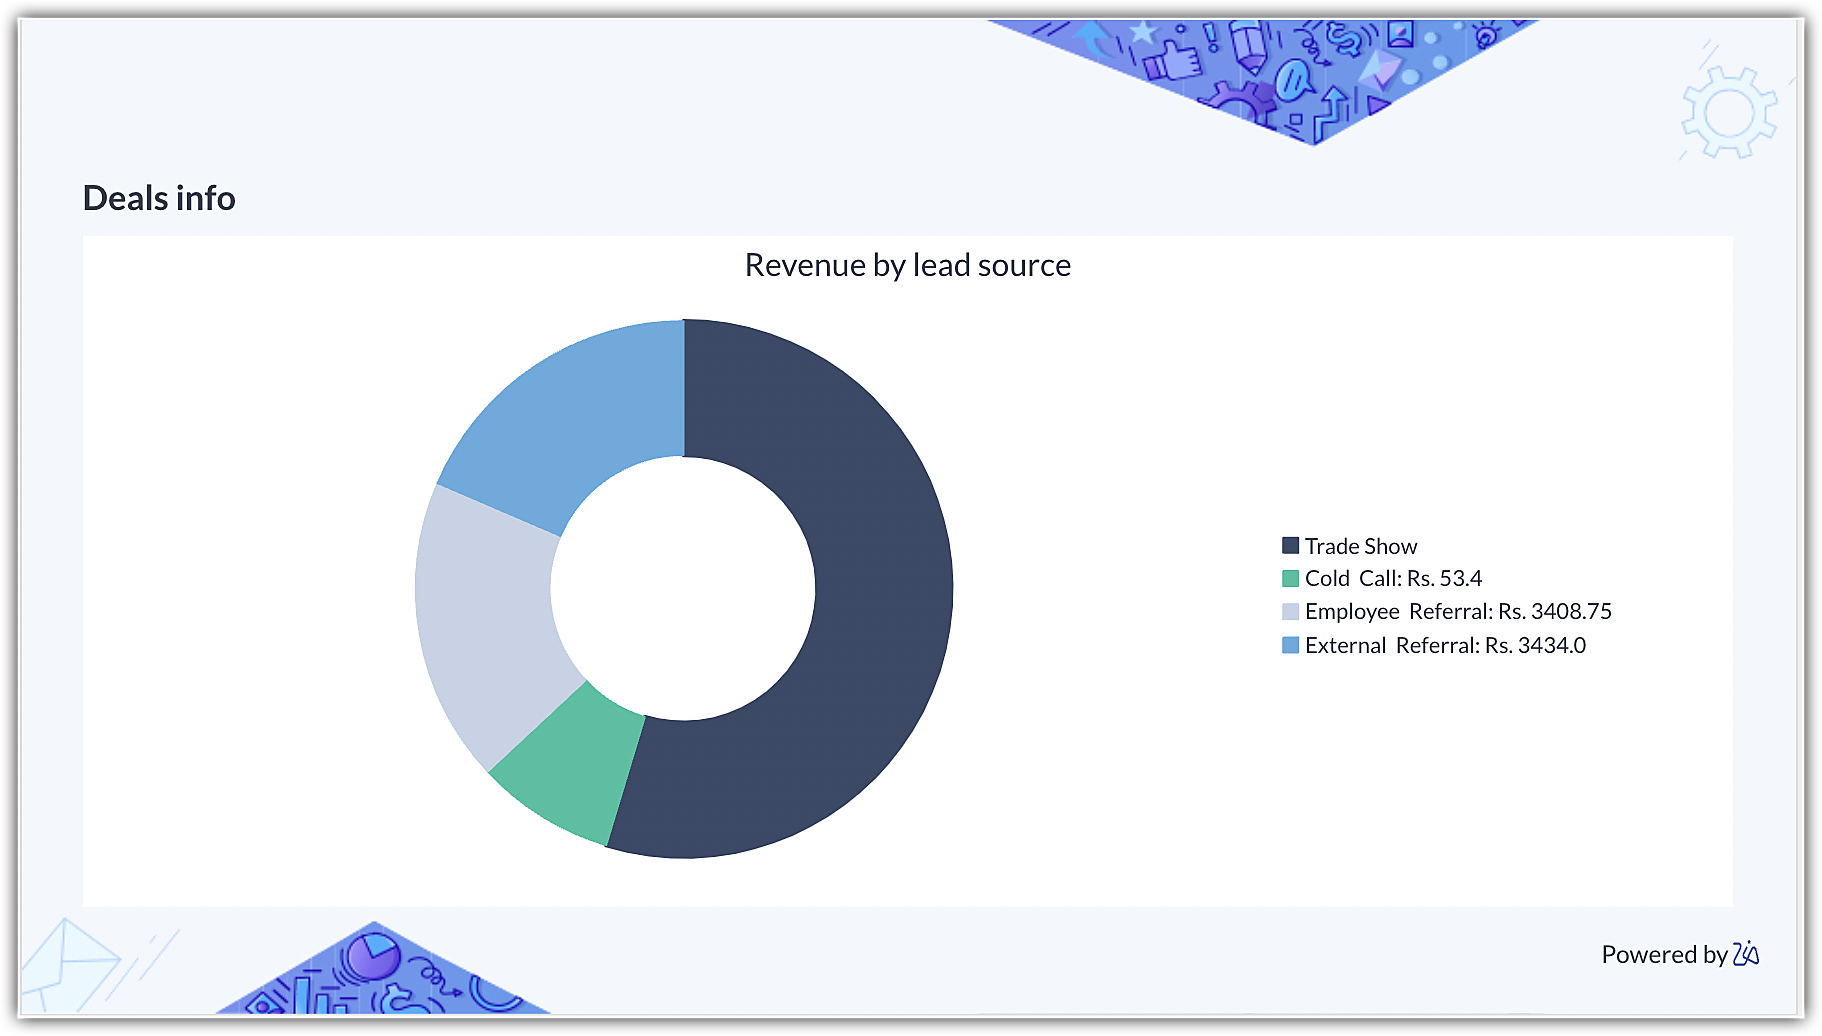
In addition to the above slide, Zia also displays revenue contributions based on your CRM fields as pie and doughnut charts.
Amount by account
Revenue by lead source
Activity information
The number of activities logged in your organization is displayed in this slide.
The activity KPIs displayed are as follows:
- Open tasks
- Completed tasks
- Meetings
- Calls
- Overdue tasks
Behavioral analytics in Zia Presentation
In addition to the above static insights, Zia automatically generates comprehensive cohort and quadrant behavioral analyses. These findings are dynamic in nature, assessed according to the behavior of your records.
Cohort analysis
A cohort chart is a useful tool to understand a behavior or trend in your CRM organization. It shows how a particular data point is performing over time.
For example, you can analyze how each of your accounts are contributing to your revenue each month. You can spot the surge or dip in the sequence, compare contributions between accounts, identify similarities and anomalies, and devise problem-solving strategies as required. To learn more about cohort analysis, click here .
Quadrant analysis
A quadrant analysis is a study of multiple entities whose behavior is plotted across quadrants in order to facilitate strategic decision-making. The format enables viewers to analyze huge volumes of data at once. To learn more about quadrant analysis, click here .
Below is an example of a quadrant analysis:
Notes:
- The number of insights or KPI displayed is subject to the type of data available in your CRM.
- With regards to the behavioral analytics, Zia selects the module based on your usage. In other words, if the activity is mostly around the Deals module, then Zia will display a behavioral study of the Deals module.
Advanced analytics in Zia Presentation
Apart from the insights and behavioural analytics charts, Zia also incorporates advanced analytics into the presentation, such as the Best Time Analytics and VoC Forecast charts. These features provide more in-depth understanding of customer interactions and future patterns, enhancing your presentations with valuable data that reinforces your storyline.
Best time to contact analytics
Zia presents significant charts for Best Time Analytics, such as optimal contact times and customer interaction trends. These charts are generated either from specific user data or from the entire organization's data if Zia is configured to make the decision. When a manager adds team members, the Best Time Analytics will automatically include the data of these team members without any additional setup required.
VoC Forecast charts
Zia decides which graphs to display and organizes them in a logical manner in Story Mode. For example, if Zia recommends graphs from the Deals module and discovers a relevant forecast, it seamlessly incorporates this forecast to maintain a smooth flow in the story. In cases where Zia believes you do not frequently utilize the Deals module and does not suggest any graphs from it, the forecast is instead added at the end.
The charts that you'll see for VoC forecast:
- Open deals categorized by the intent in the form of a pie or donut chart.
- Table for the deals lost based on the intent.
- Tabular representation of the main keywords for analyzing a forecast.
Using Zia Presentation
The slide deck Zia prepares is pushed as a notification in the Zia Notifications panel based on the frequency configured. In addition, if you have integrated Zoho Cliq with your CRM organization, the same will be sent to the selected user as a message.
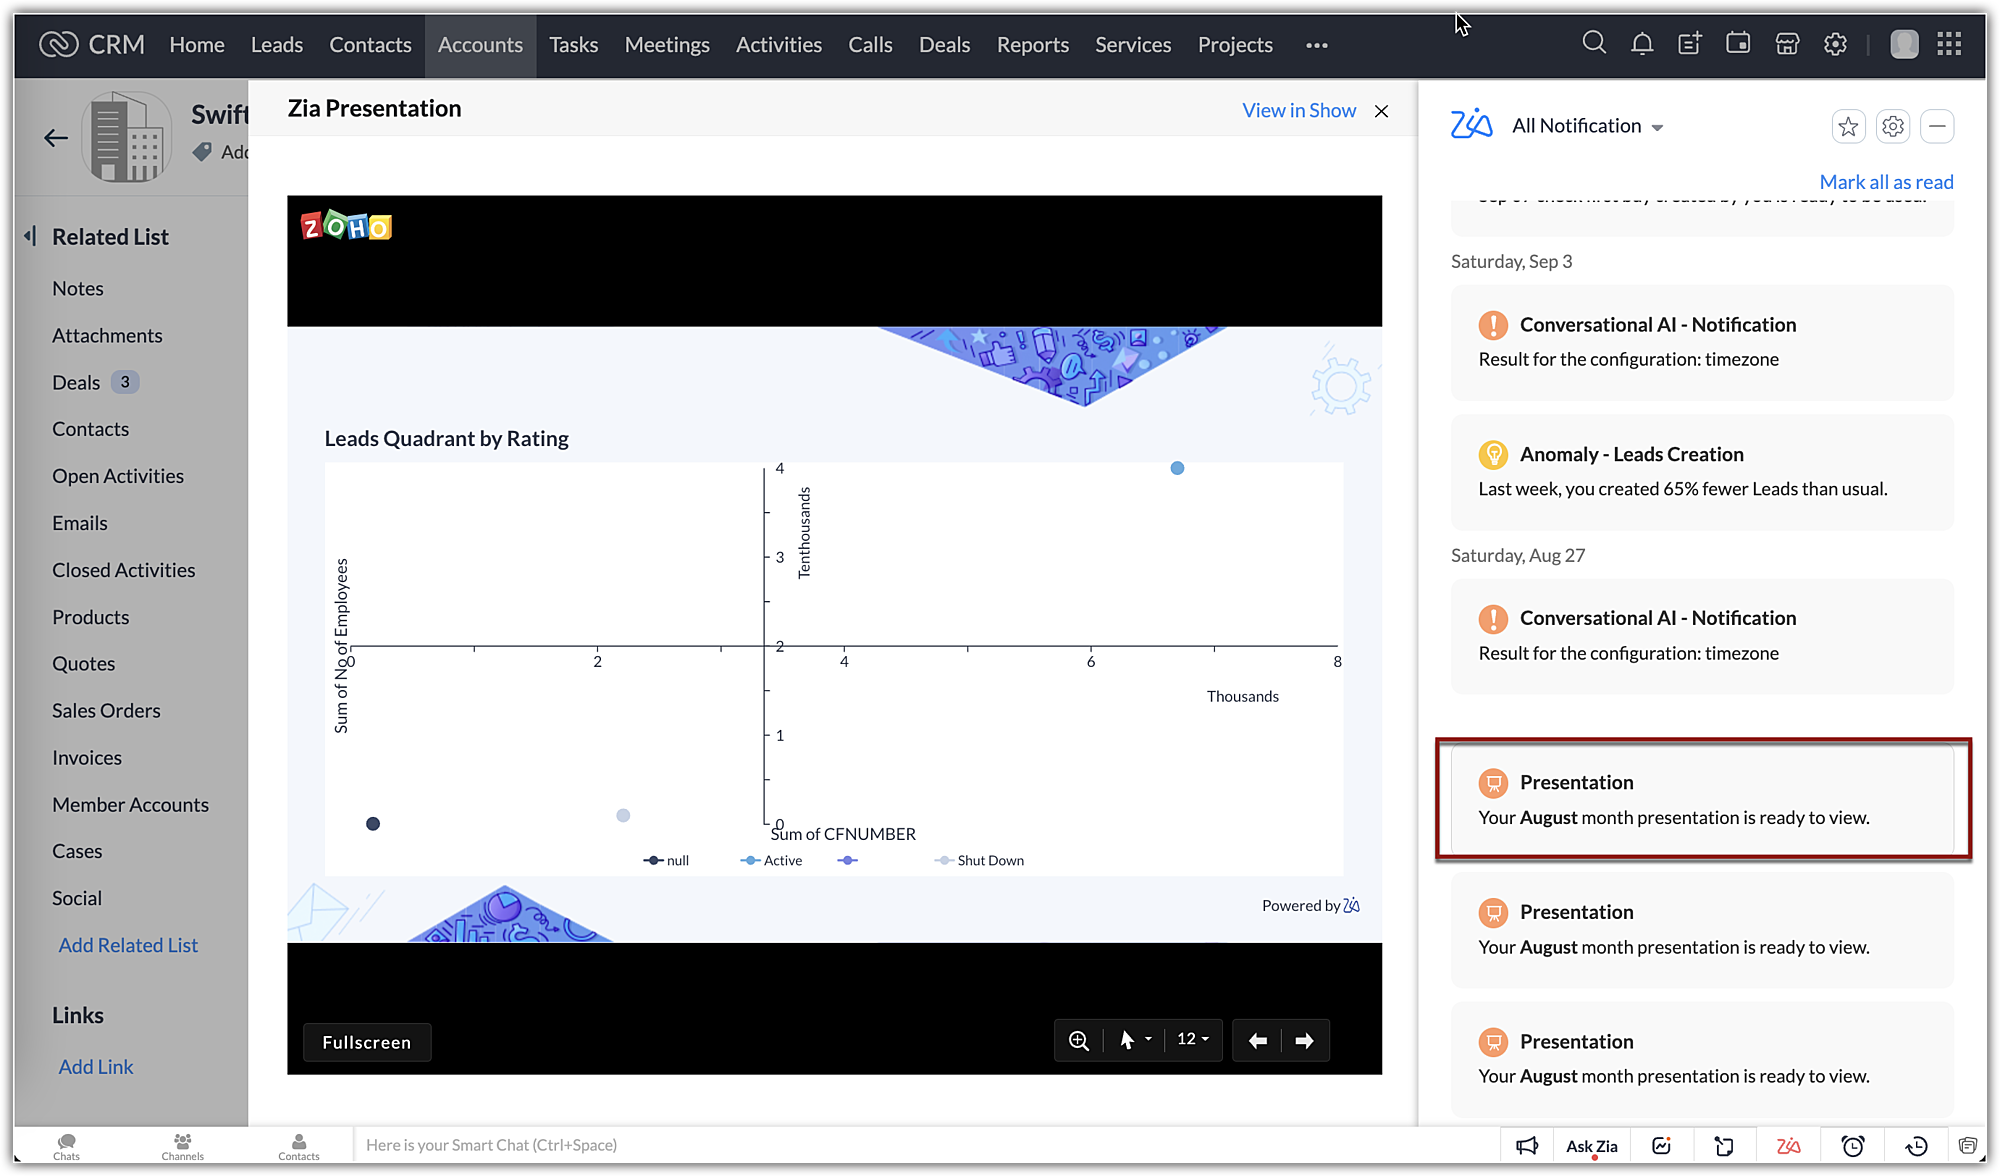
Upon clicking on the notification, the presentation will be displayed as a preview, where you can do the following:
- Expand the slide to full screen
- Zoom in and out
- Navigate between slides
- Point and present using an arrow and laser light pointer
- Annotate as you present, using a pen and highlighter
- Erase markup
Notes:
The markup or edits made to the slides while presenting the deck will not be saved or carried over to Zoho Show. Any edits made here are momentary annotations to emphasize data points as you narrate.
Customize your presentations
Zia's slides can be exported and viewed in Zoho Show, where you can add a logo, change the theme, edit data representation, and so on. Changes made to the slides in Zoho Show will be synchronized with the presentation in Zoho CRM.
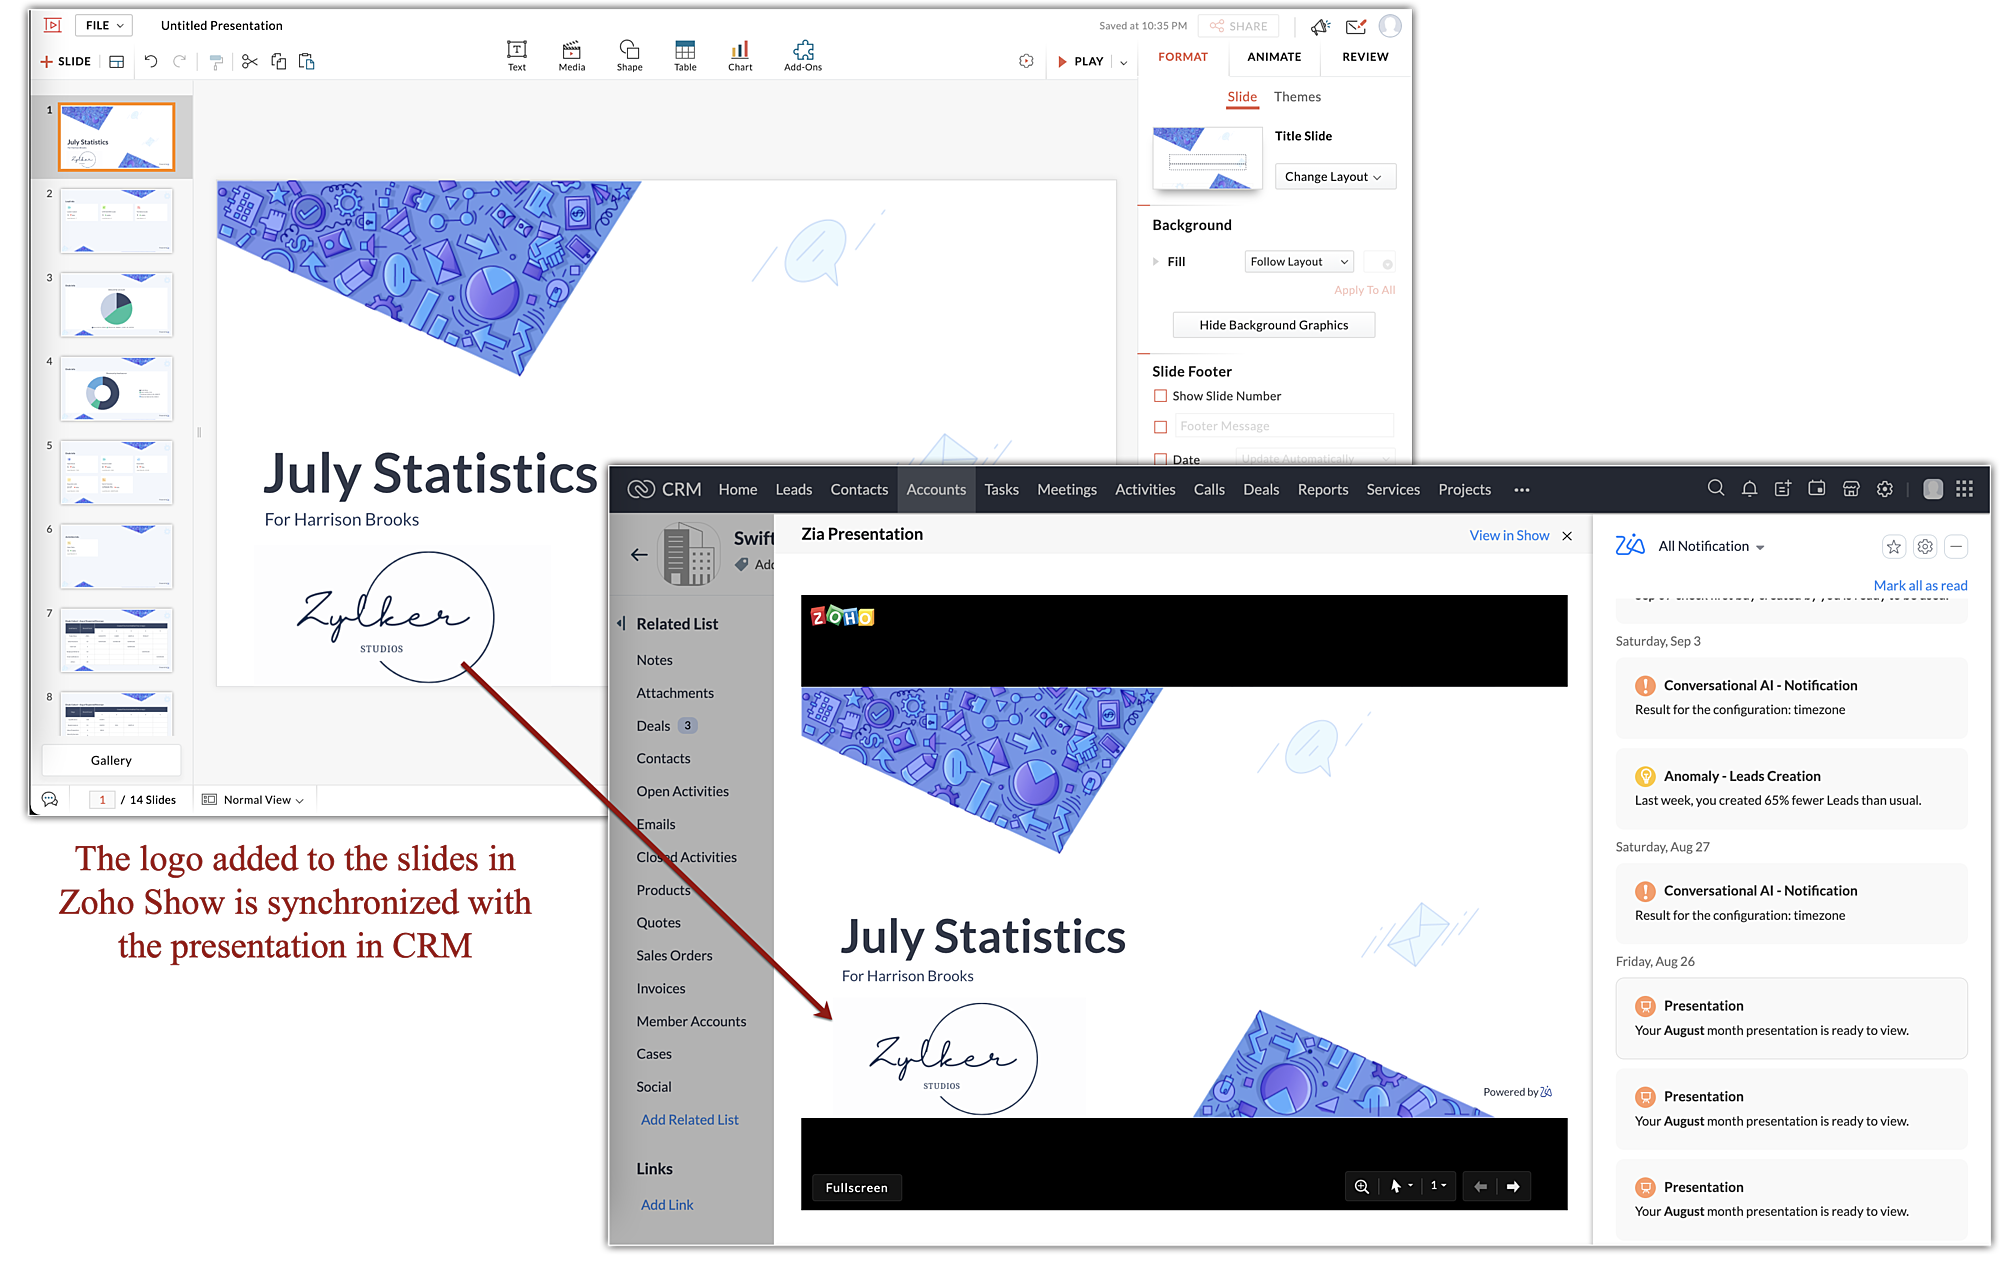
Notes:
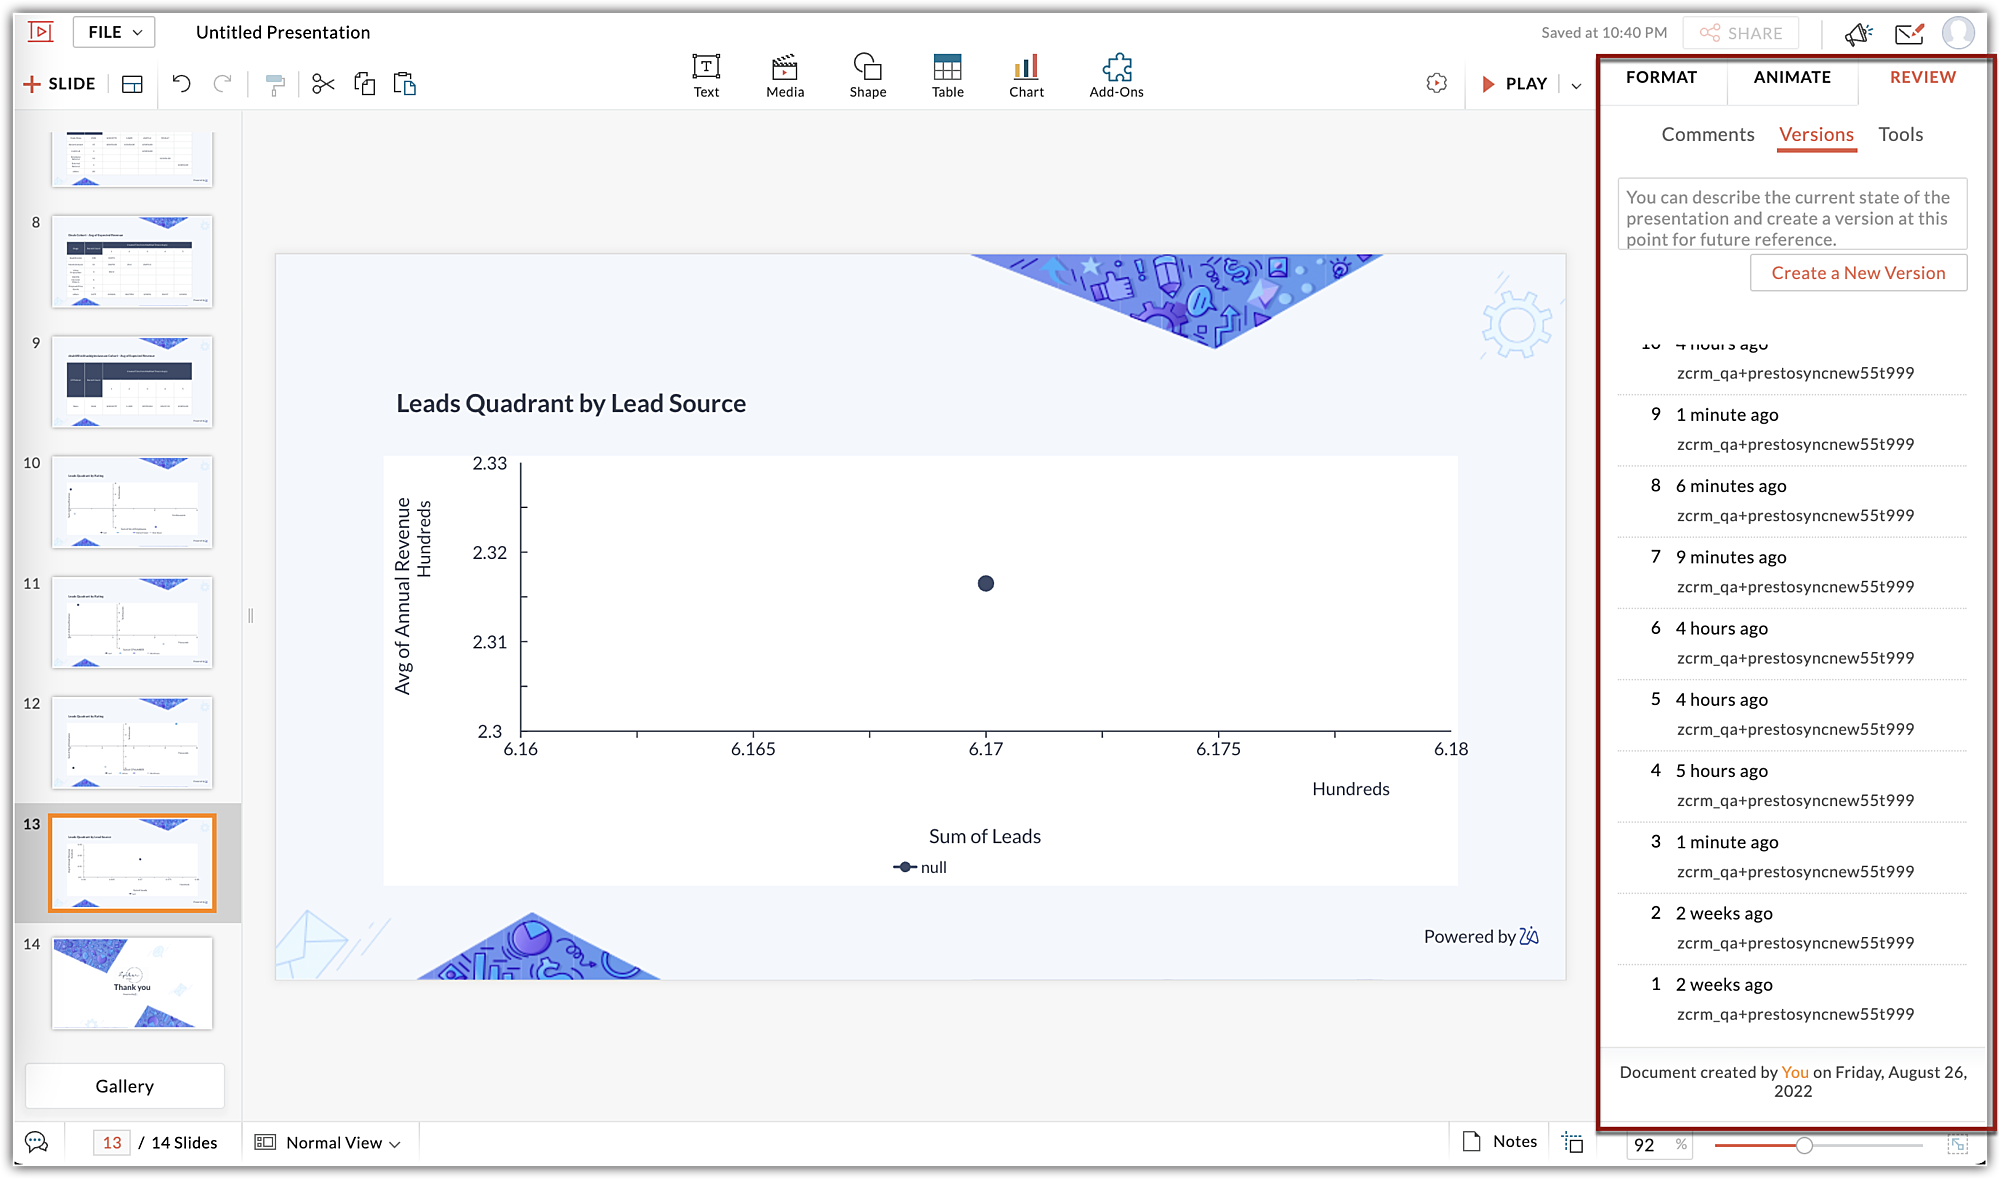
The data featured in presentations is real-time data from your Zoho CRM account. Any changes made to the slides after the export to Zoho Show will be synchronized with the slides in Zoho CRM. You can, however, manage or review versions by accessing Versions under the Review tab of the presentation. Click here to learn more.
Configure Zia's Presentation
Administrators can create upto ten number of presentation configurations. For each configuration, Zia will perform individual data computation based on the preferences and will distribute it to the specified users.
Say for example, you are a sales manager and you'd like to assess your teams performance and productivity based on their job function. You can create individual presentation configuration for field sales and add users that does that, one for presales, one for sales intern, and so on.
Personalize your data
Based on your preferences, you can personalize your presentation. Here's how you can go about it.
Step 1: Name the presentation.
Step 2: Choose the users for whom you are intending this presentation for. You can select all users or selected users. Remember, Zia will monitor and compute data of these users alone for this particular presentation. Also, the insights will be sent to them alone. Let us say you want this presentation to be made for Harry, Josh, Sarah, and Sophie. To give Josh his deck, Zia will refer to the modules as prescribed, evaluate his usage, contribution, and performance to compile Josh's deck as a personalized presentation and send the same to him. Likewise, personalized presentations are generated by Zia for each selected user and sent to each of them one-on-one.
Step 3: Choose the data source: Individual user data alone or of their subordinates as well. If you choose to include the users' subordinates, then their data will also be considered for computation and be a part of the deck.
Step 4: Select the data. You can select the essential modules based on which you want the deck or let Zia choose, or opt for both.
Step 5: Choose another user for distribution. In addition to the users mentioned above, If you'd like to share this deck with other users in the organization, then they can be added here and a copy of the decks prepared for each users will be sent to them as and when a presentation is published
Step 6: Choose the notification medium. By default, you will receive presentations as notification in the Zia's notification panel. If you'd like, you can also opt to receive via Zoho Cliq as a Bot message from the Zoho CRM bot.
Step 7: Choose the frequency of the presentation publishing. You can choose from weekly, monthly, and quarterly options. Furthermore, you can decide when in the week, month, or quarter, you'd like to receive.
To configure Zia Presentation, take the following steps:
- Go to Setup > Zia > Zia Presentation.
- In the Zia Presentation page, click on the New Presentation button.
- In the create new presentation page, populate the following information:
- In the Presentation name field, name the presentation. This is the name with which this presentation will be delivered.
- In the create presentation for field, choose between all users or selected users option.
- If you chose selected users option, add the users you'd like to generate the presentation for.
- In the create presentation based on field,
- Choose individuals' data if you want to compute only the selected users' metrics.
- Choose individuals' and their subordinates data if you want to compute the data of the selected indivuduals and their subordinates in the hierarchy.
- In the Essential module field,
- Select the Let Zia choose option if you want Zia to evaluate the usage and bring in computations automatically
- Select Manual choice option, if you want to consider data only from selected modules.
- Select Both, if you want both methods of data selection.
- In the Also share the presentation with field, choose all the users with whom you'd like to share this presentation with (like a carbon copy).
- Under the Notify section, Zia Notification panel will be checked by default. If you have integrated Zoho Cliq, then that will be listed in this section. Check that option to receive bot notifications in you Cliq messenger.
- Under the choose frequency section,
- Select the recurrence of the presentation from weekly, monthly, and quarterly.
- If Weekly is selected, determine when in the week you'd like to receive the presentation notification.
- Likewise, If Monthly or Quarterly is selected, determine when in the month or the quarter, you'd like to receive the presentation.
- Click Save.
View Zia Presentation
To view Zia Presentation. take the following steps:
- Click on the Zia Notification Panel from the bottom of your CRM application.
- Click on the presentation notification to preview the slides.
- Toggle the presentation options (Full screen, zoom, pointer, page navigator) from the bottom of your slide to present your slides from Zoho CRM.
- Click View in Show to export the slides to Zoho Show for further customization.
To create a presentation from the analytics' dashboard
 Availability
This feature is available for orgs using Enterprise edition and above in US, AU, EU, IN, JP, and CN DCs.
You can quickly convert a dashboard into a presentation and use it in your team meetings, strategy sessions, performance reviews, and so on. You can start presenting the new slide deck right from your CRM. If you want to make some changes, you can easily open the slide deck in Zoho Show. The changes made there will be synced back to the slide deck in your CRM.
To do this:
- Click the Analytics module.
- Select the required dashboard in the left pane.
- Click the more (...) icon at the top right corner of the dashboard and select Create as Presentation.
Note: When a presentation is being created, you will not be able to create another one. Each user can create a maximum of 10 presentations per month. The slide deck will be erased one month from the time of creation. - You will get a notification once the presentation is created. Click View in Zia Notification.
- The notification will be selected by default, and the presentation will be shown in the Dashboard Presentation pane.
- If you want to start presenting from within the CRM, use the presentation options available at the bottom of the slide deck. You can:
- View the slide deck in full-screen mode.
- Zoom to a particular section.
- Use a pointer or marker, along with the options to hide and erase markup.
- Navigate to the next or previous slide, or pick a particular slide
- f you want to present the slide deck from Zoho Show or want to make changes to it, click View in Show.
Note
- Each user can create a maximum of 10 dashboard presentations per month. You can see how many you've already created by hovering over the Create as Presentation option.
- When a presentation is being created, you will not be able to create another one.
- You can access your slide deck by clicking on the Zia Notification Panel from the bottom of your CRM application. The slide deck will be erased one month from the time of creation.
- If you open the slide deck in Zoho Show and make changes to it, the changes will be synced back to the deck in the CRM. Markup will not be saved.
See also:
Zoho CRM: Zia Notifications
Zoho Show: Format Slide and its Objects