Response-based sentiment analysis
Zoho CRM makes a sentiment analysis on your customers' conversations on different communication channels such as email, surveys, calls, and customer support tickets. This analysis is presented in the form of various types of charts and graphs for you to easily interpret key insights and take further actions as required.
What is Sentiment Analysis
Sentiment analysis is a popular AI-based approach in which machine learning techniques are used to instantly scan and extract subjective information from lines of text. This is also known as opinion mining or text mining. In business, sentiment analysis is beneficial to learn a great deal about your customers' thoughts and perspectives from multiple sources including email, calls, social media, surveys, help desk systems.
Typically in sentiment analysis, the insights are presented in the form of a set of keywords mentioned by customers and an indication of whether it is in favourable or negative light for your business. For example, from a hundred emails to you, if the words Cancel and Payment are repeated, it may be highlighted as a Negative sentiment by the AI system, thereby calling for your attention.
Similarly, in Zia's VoC, the category "Response based sentiment analysis" consists of several charts and graphs designed with the intention of offering you in-depth, accurate insights relating to the pulse of your audience.
These charts and graphs also offer you knowledge of your customers' sentiments at multiple levels.
For instance, consider this. If you are presented with data that says Cancel and Payment were the top keywords spoken by customers, it may give you an impression that your business in general is doing badly. But if you dig a bit deeper and find that most of these customers who have mentioned cancellation are those who signed up in the last six months only, then that really changes your perspective. It tells you something went wrong only in the last six months, and this knowledge enables you to take more appropriate and focused action. This way, Zia presents insights on various levels for you to make the right observations and decisions.
Data such as the exact keywords, their sentiment, the customers who mentioned them and at what point in their customer lifecycle, on which communication channel— these are various pieces of the puzzle offered by Zia, which when put together, gives you a clear, relevant picture of your business.
On those lines, the Response based sentiment analysis presents the following charts and graphs:
1. Frequently occurring keywords and their sentiments:
Description: Important terms or keywords that are frequently used by your customers are identified and the underlying sentiment of those terms is highlighted. For example, if customers show negative sentiment towards keywords like service, quality, payment, or delivery you can take necessary actions to improve their experience in those areas. The top 10 keywords that appear across the three platforms (emails, surveys, and support tickets) will be captured and the size of the terms is based on their frequency, so the most frequently used terms will appear the largest.
2. Overall customer or response count by sentiment
This metric shows the total number of customers that gave positive, negative, or neutral feedback. Zia will identify the sentiment of feedback and responses received via email, surveys, or tickets and display the total number of customers that showed certain sentiment.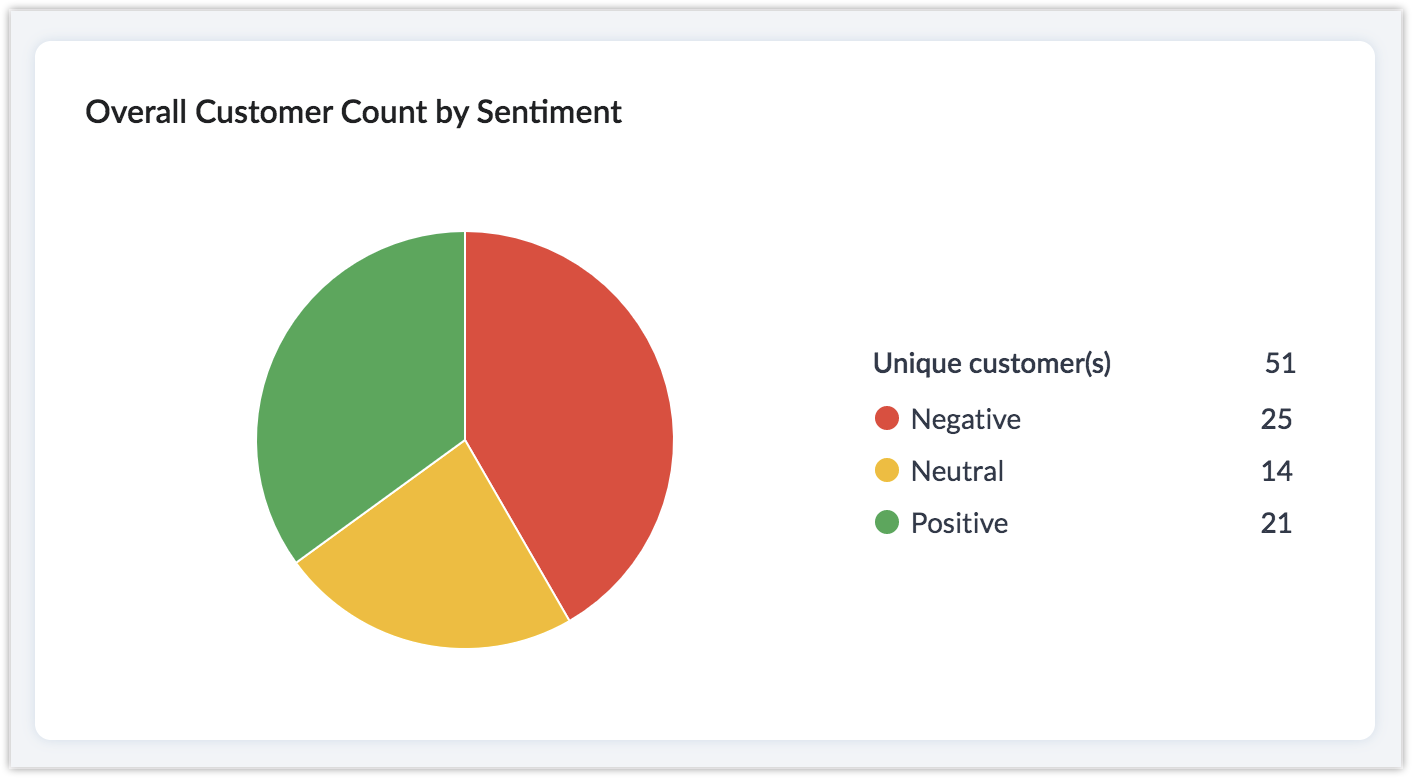
3. Overall customer count by intent
Intent analysis goes deeper and identifies whether a piece of test is a complaint, suggestion, or query. A graph showing a high number of complaints will indicate that you need to resolve some crucial issues.
4. Sentiment versus medium
This single-column bar graph will display the sentiment of the feedback received via different mediums. You can identify the number of customers that show a positive, negative, or neutral sentiment over email, surveys, and tickets. This makes it easier to identify the source, for example too many negative sentiments shared in support tickets may indicate issues with how quickly support tickets are handled, the solutions provided by support agents, or with the product itself, depending on the type of complaint. You may decide to prepare troubleshooting tips to help the support team handle tickets more efficiently.
5. Overall sentiment buzz
This line graph will show the overall increase or decrease in sentiment over a set time period. You can view weekly, monthly, and yearly sentiment patterns.
The top 5 keywords will be displayed based on the number of times customers used them. The line graph will show the number of customers that mentioned the keyword over time, creating the buzz.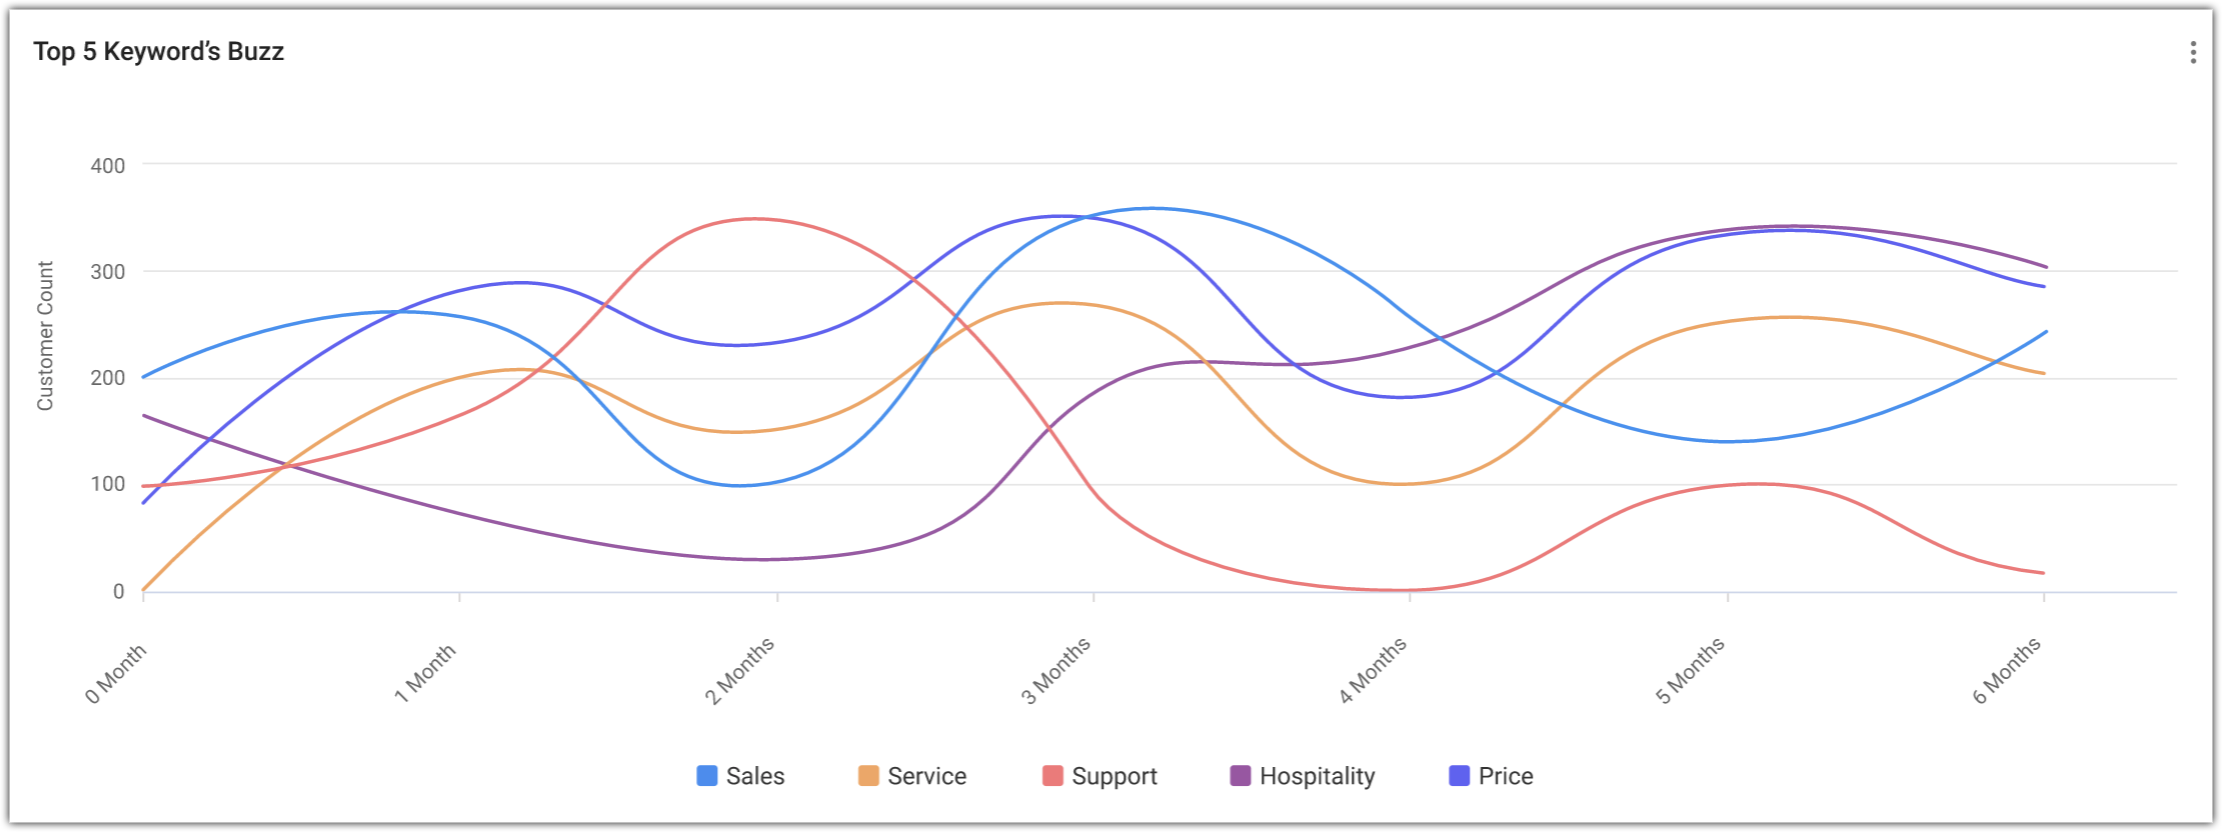
7. Top 5 keywords by sentiment
This stacked column bar graph will display top 5 keywords and their sentiment. The graph shows the number of customers that used the keywords and the sentiments behind their messages.
8. Keyword distribution on quadrant
The keywords are distributed in quadrants, plotted by the number of customers who used them and the revenue generated from those customers. The customers are evaluated based on the total time they spent with the organization and the revenue generated during that time. The keywords in the upper quadrants have been used by customers who have worked with the organization for a significant amount of time and contributed more to the organization's revenue. This means it is very important to address any negative sentiment keywords that appear in the upper quadrants. A table will show the number of customers in each quadrant and the sentiment for each keyword they used.
9. Sentiment based on quadrant
In this chart, the sentiment is plotted in quadrants by the amount of time customers have worked with the organization and the revenue generated from those customers.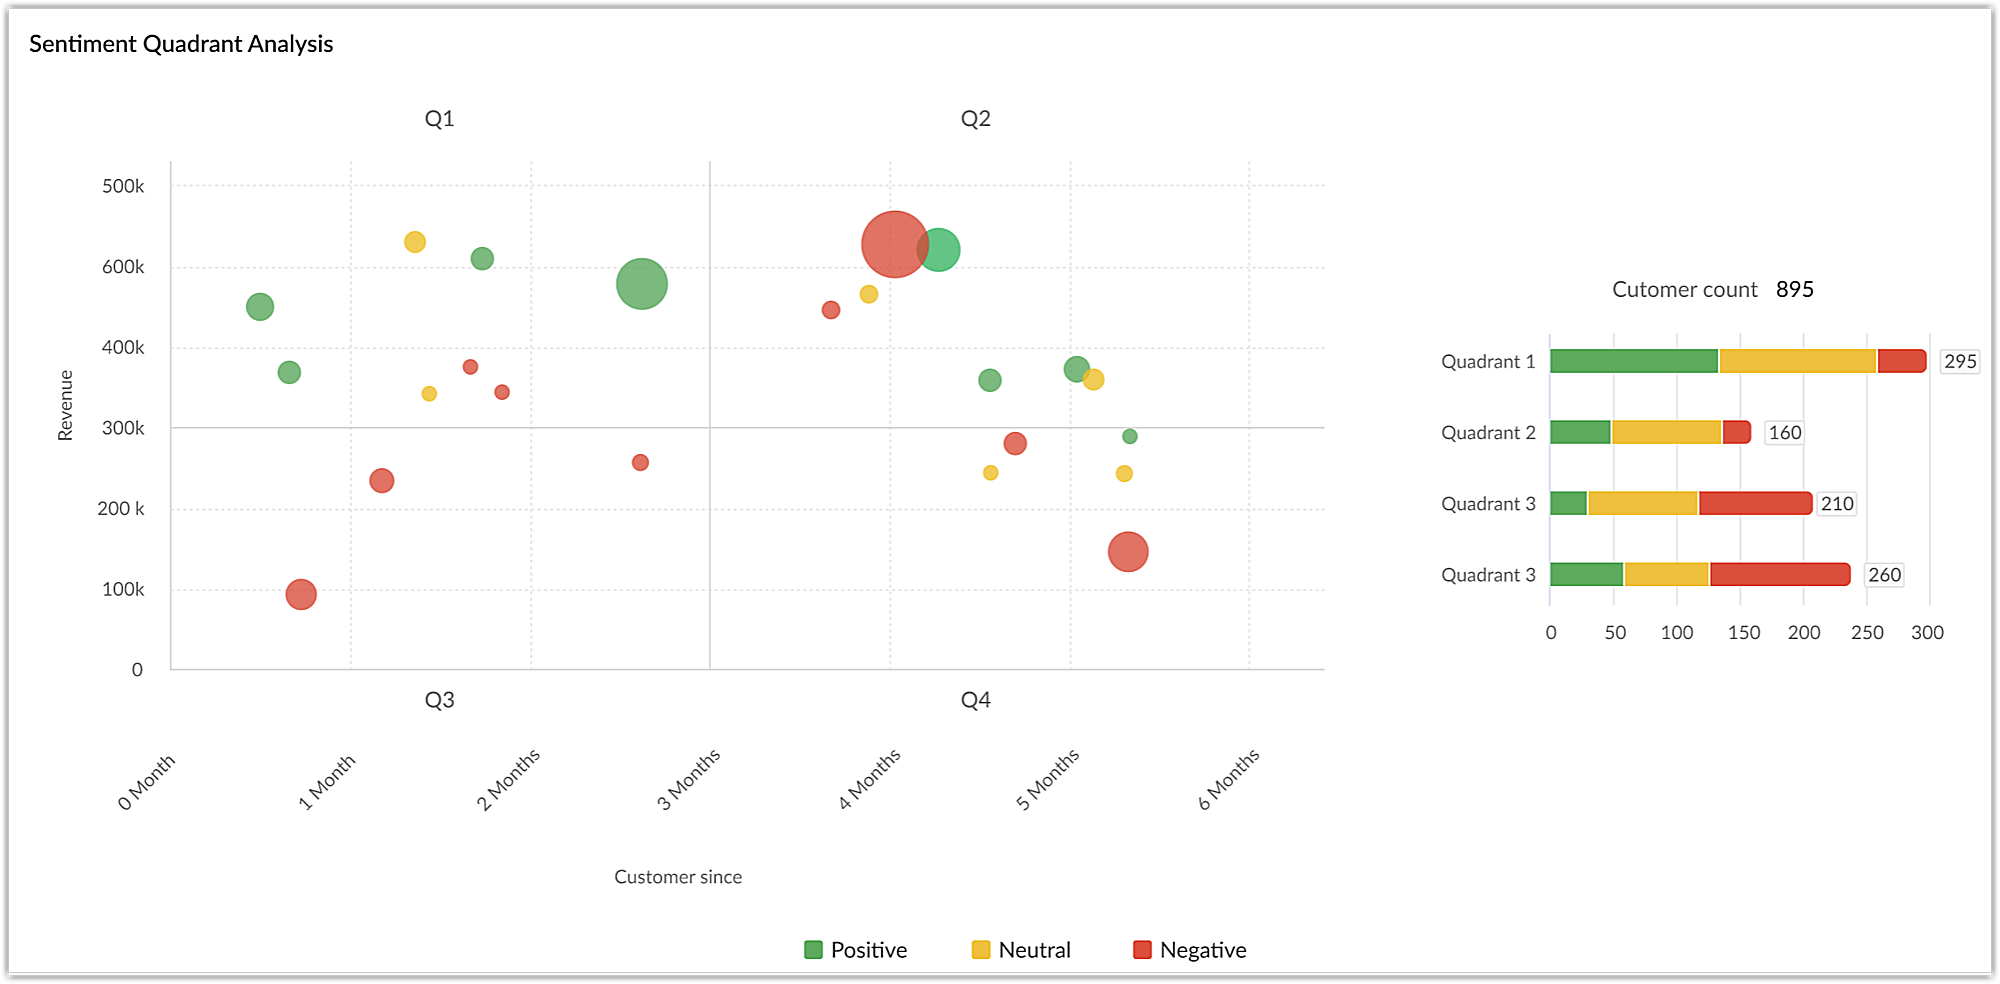
Sentiment-based cohort: This cohort chart displays the number of customers who showed positive, negative, or neutral sentiment over certain time. The duration is calculated from the time the customer first did business with the organization to the last response received from them.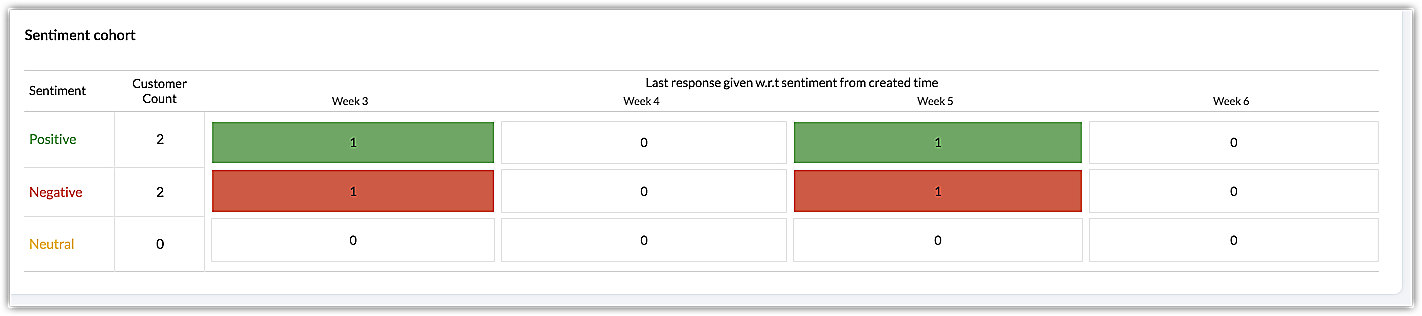
Top 3 keywords by sentiment-based cohort analysis: Zoho CRM selects 3 of the top 90 keywords and plots a cohort to display how many customers showed positive, negative, or neutral sentiments towards your organization over a certain time period.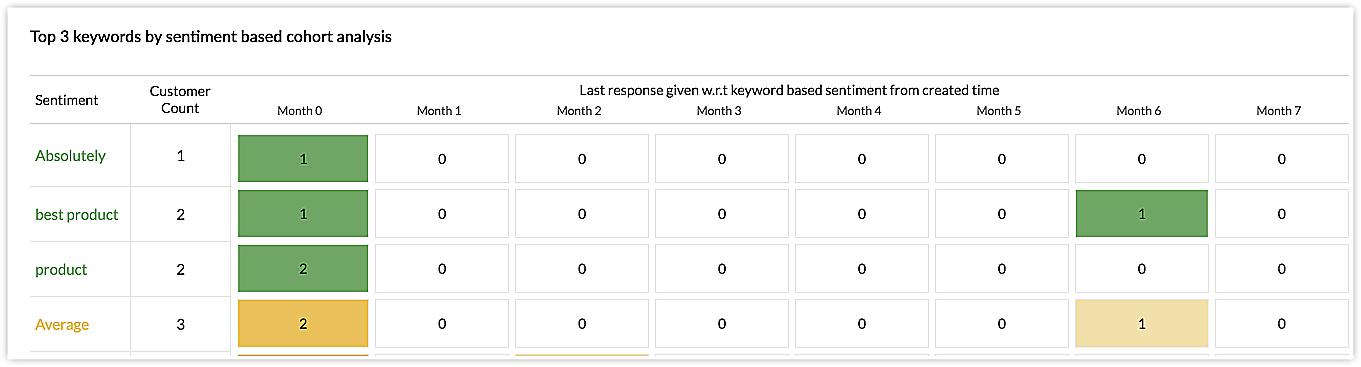
Top 10 keyword by time frame cohort: This is the same as the top 3 cohort chart, but the top 10 keywords and their sentiment over certain time are displayed in the cohort chart.
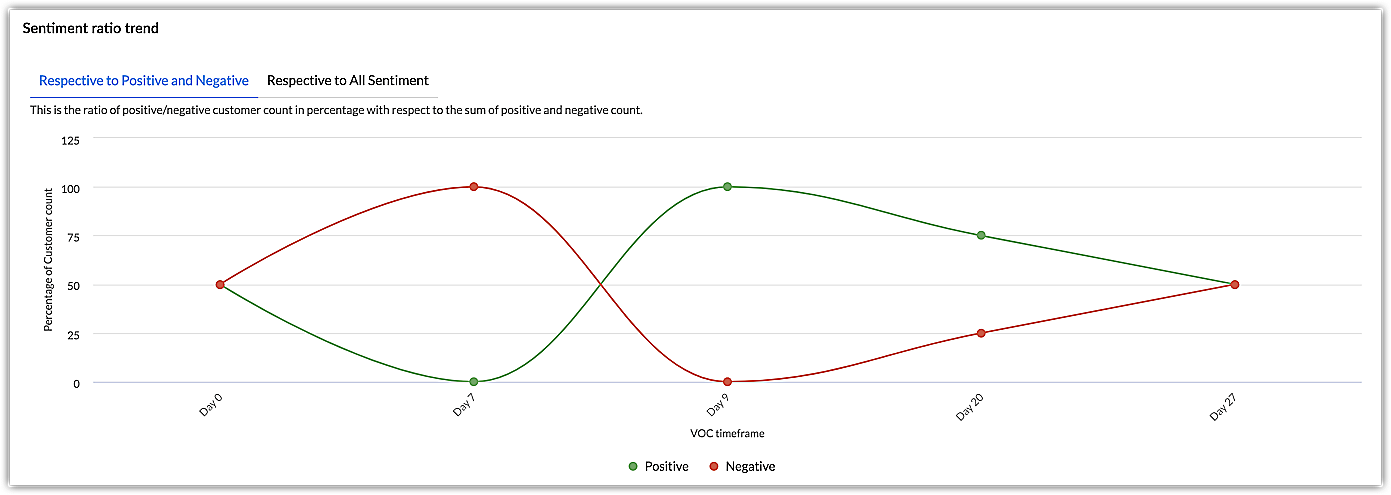
Customer trend based on sentiment: The trend is shown in two ways:
Respective to positive and negative sentiment: A line graph will show the number of customers who showed positive or negative sentiment vs. the total number of customers who showed both positive and negative sentiment.
Green line = number of positive customers/total number of positive + negative customers
Red line = number of negative customer/total number of positive + negative customers
Respective to all sentiments: A line graph will show the number of positive, negative, and neutral customers vs. total number of customers for all sentiments.
Note: For all quadrant and cohort-based analysis, the duration will be calculated by considering the time since the customer was first associated with the organization against the sentiment captured in their latest response.
10. Sentiment Dial Analysis
12. Sentiment Ratio Trend
13. Overall Sentiment Trend
14. Top 5 Words by Sentiment
The keywords are distributed in quadrants, plotted by the number of customers who used them and the revenue generated from those customers. The customers are evaluated based on the total time they spent with the organization and the revenue generated during that time. The keywords in the upper quadrants have been used by customers who have worked with the organization for a significant amount of time and contributed more to the organization's revenue. This means it is very important to address any negative sentiment keywords that appear in the upper quadrants. A table will show the number of customers in each quadrant and the sentiment for each keyword they used.
This cohort chart displays the number of customers who showed positive, negative, or neutral sentiment over certain time. The duration is calculated from the time the customer first did business with the organization to the last response received from them.
18. Top 10 Keywords by Time Frame
This is the same as the top 3 cohort chart, but the top 10 keywords and their sentiment over certain time are displayed in the cohort chart.
In this chart, the sentiment is plotted in quadrants by the amount of time customers have worked with the organization and the revenue generated from those customers.
20. Top 3 Keywords by Sentiment-Based Cohort Analysis
Zoho CRM selects 3 of the top 90 keywords and plots a cohort to display how many customers showed positive, negative, or neutral sentiments towards your organization over a certain time period.
 7. Top 5 keywords by sentiment