Survey Comparison
You will also have detailed insights on the keywords that may have contributed to a high
or low score on your NPS surveys and the underlying sentiments of those keywords so
you have a quick picture of what predominantly let you down or made you win — high
cost, great service, hospitality, good UI and so on and so forth.
1. Frequently Used Keywords in Surveys
 2. Overall Top Keywords

 3. Top Positive Keywords

 4. Top Negative Keywords

 5. Top Common Keyword Buzz

 6. Sentiment in Surveys

 7. Intent in Surveys

 8. Competitor Mentions Analysis in Surveys

 9. Survey-wise Keyword Responsible For Lead Conversation

 10. Customer Trends in Surveys

 11. Survey Keywords Quadrant

 12. Survey Sentiment Quadrant

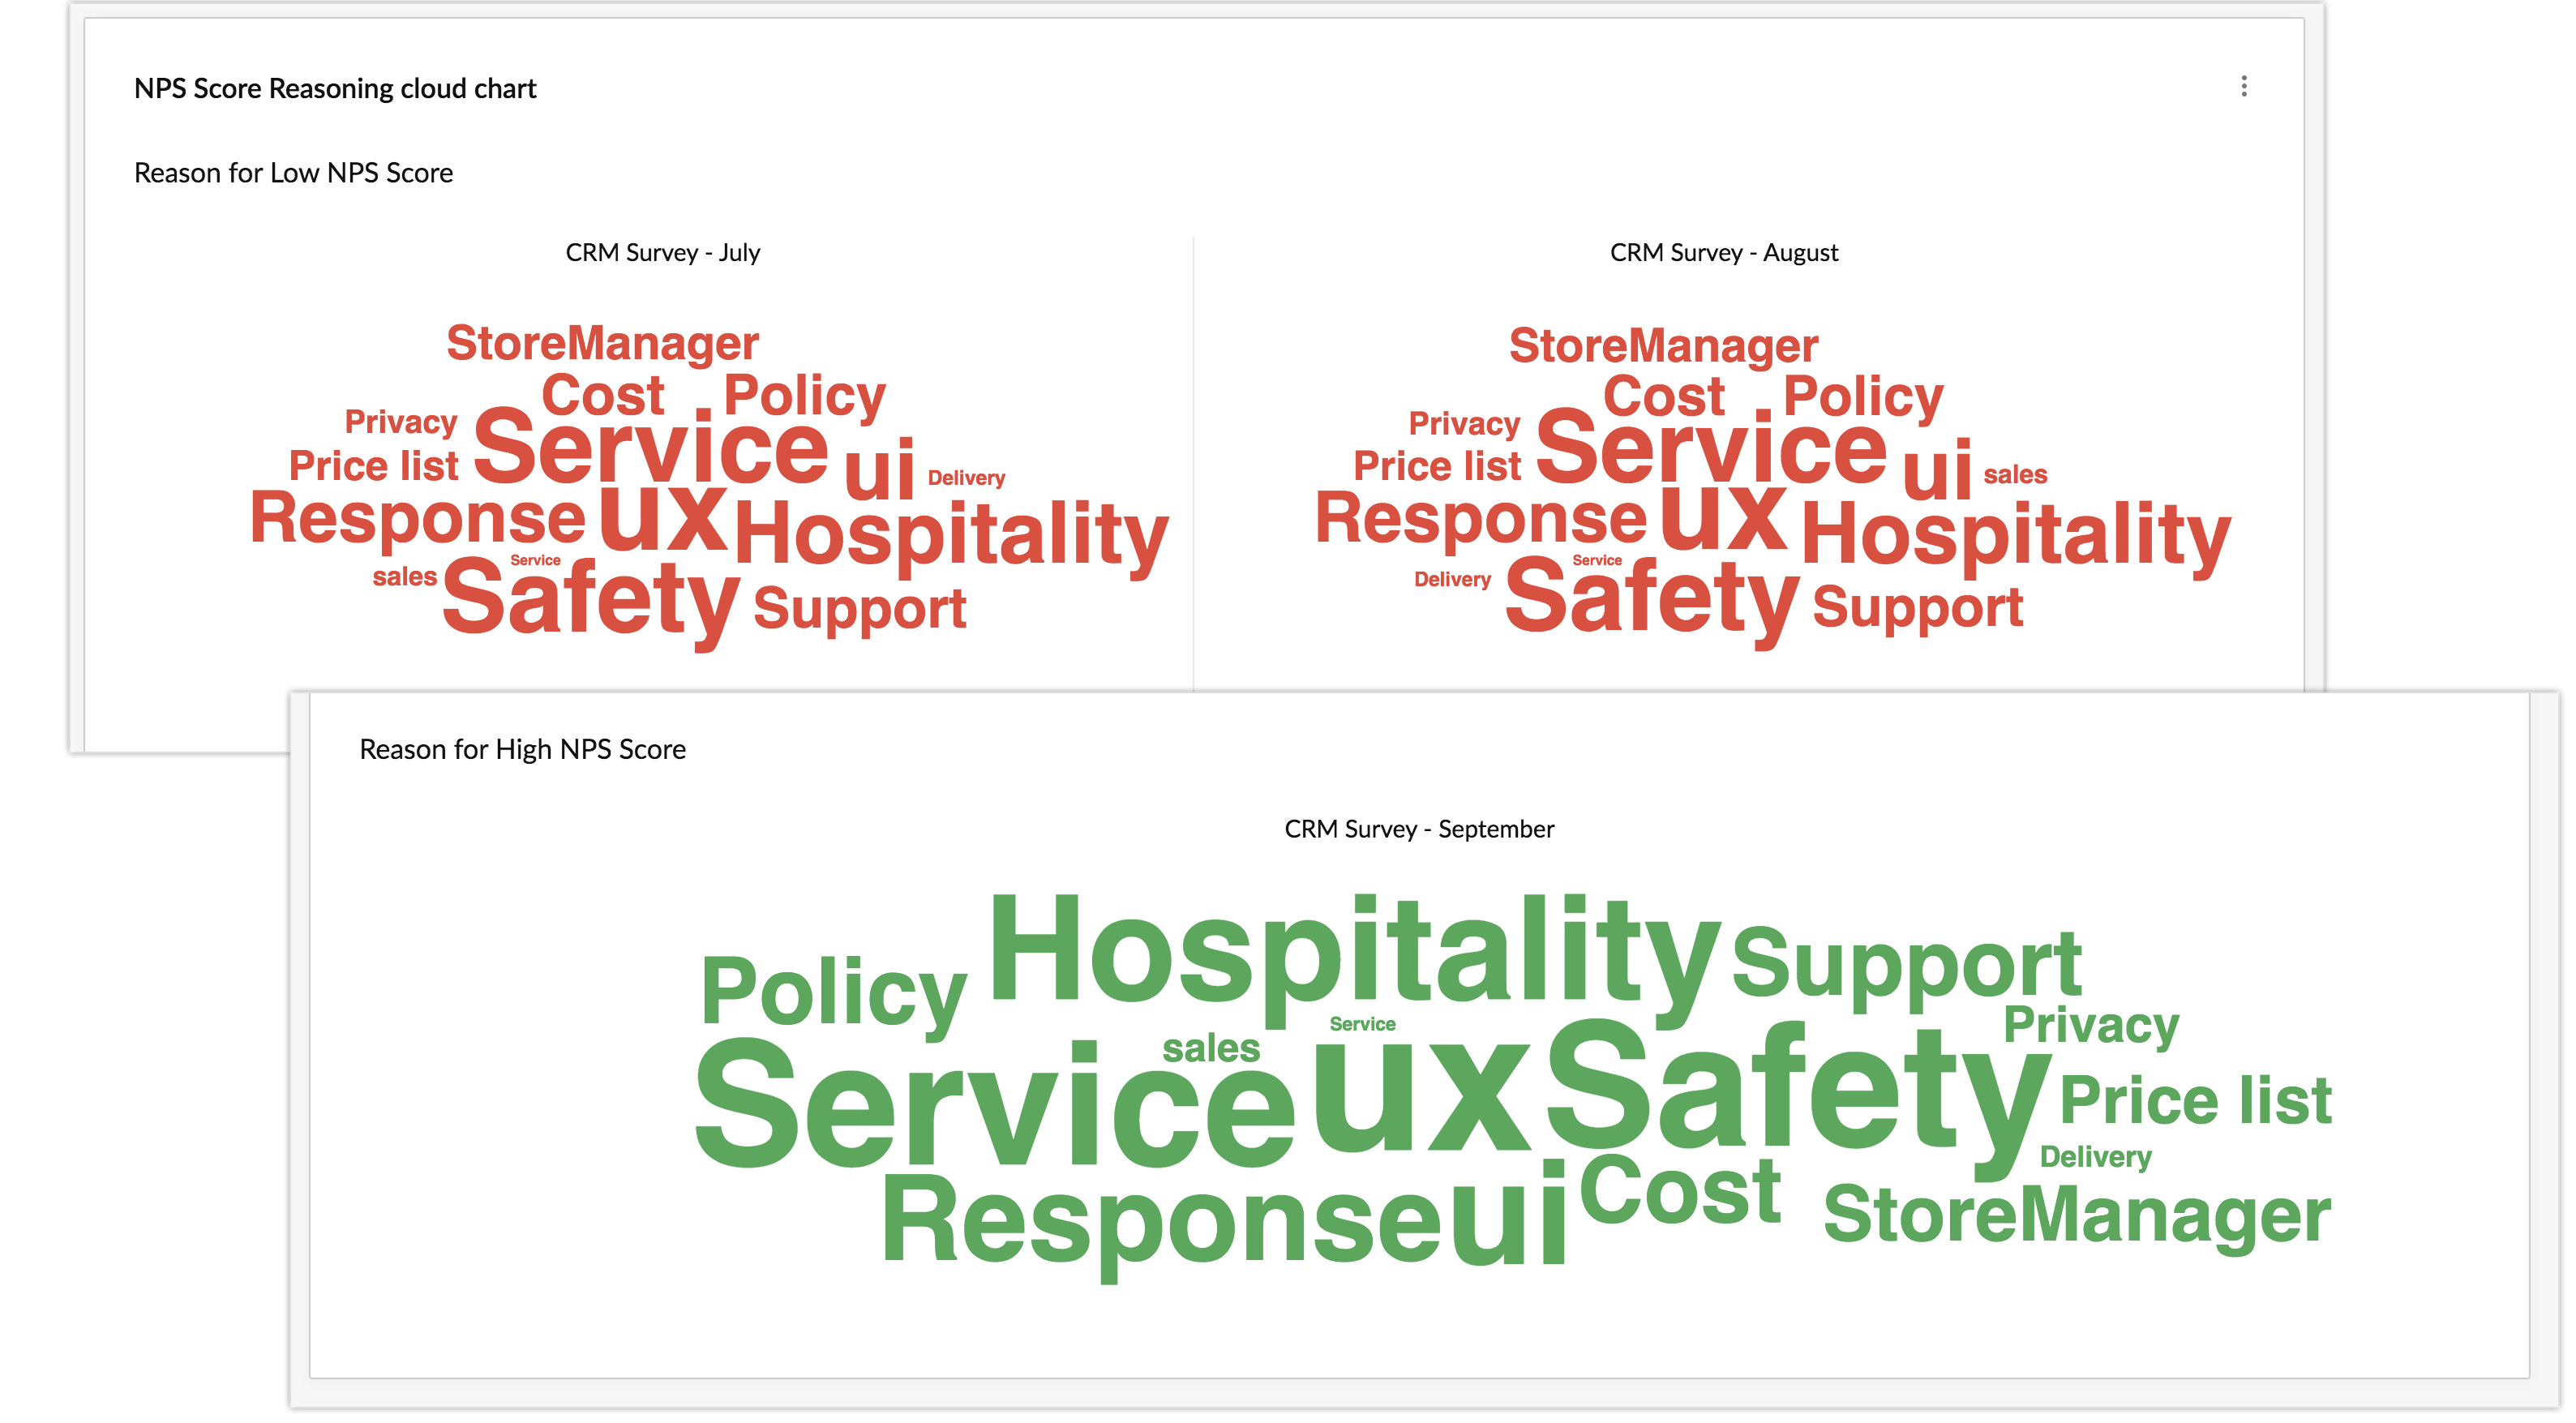
 13. NPS Score Reasoning Cloud Chart


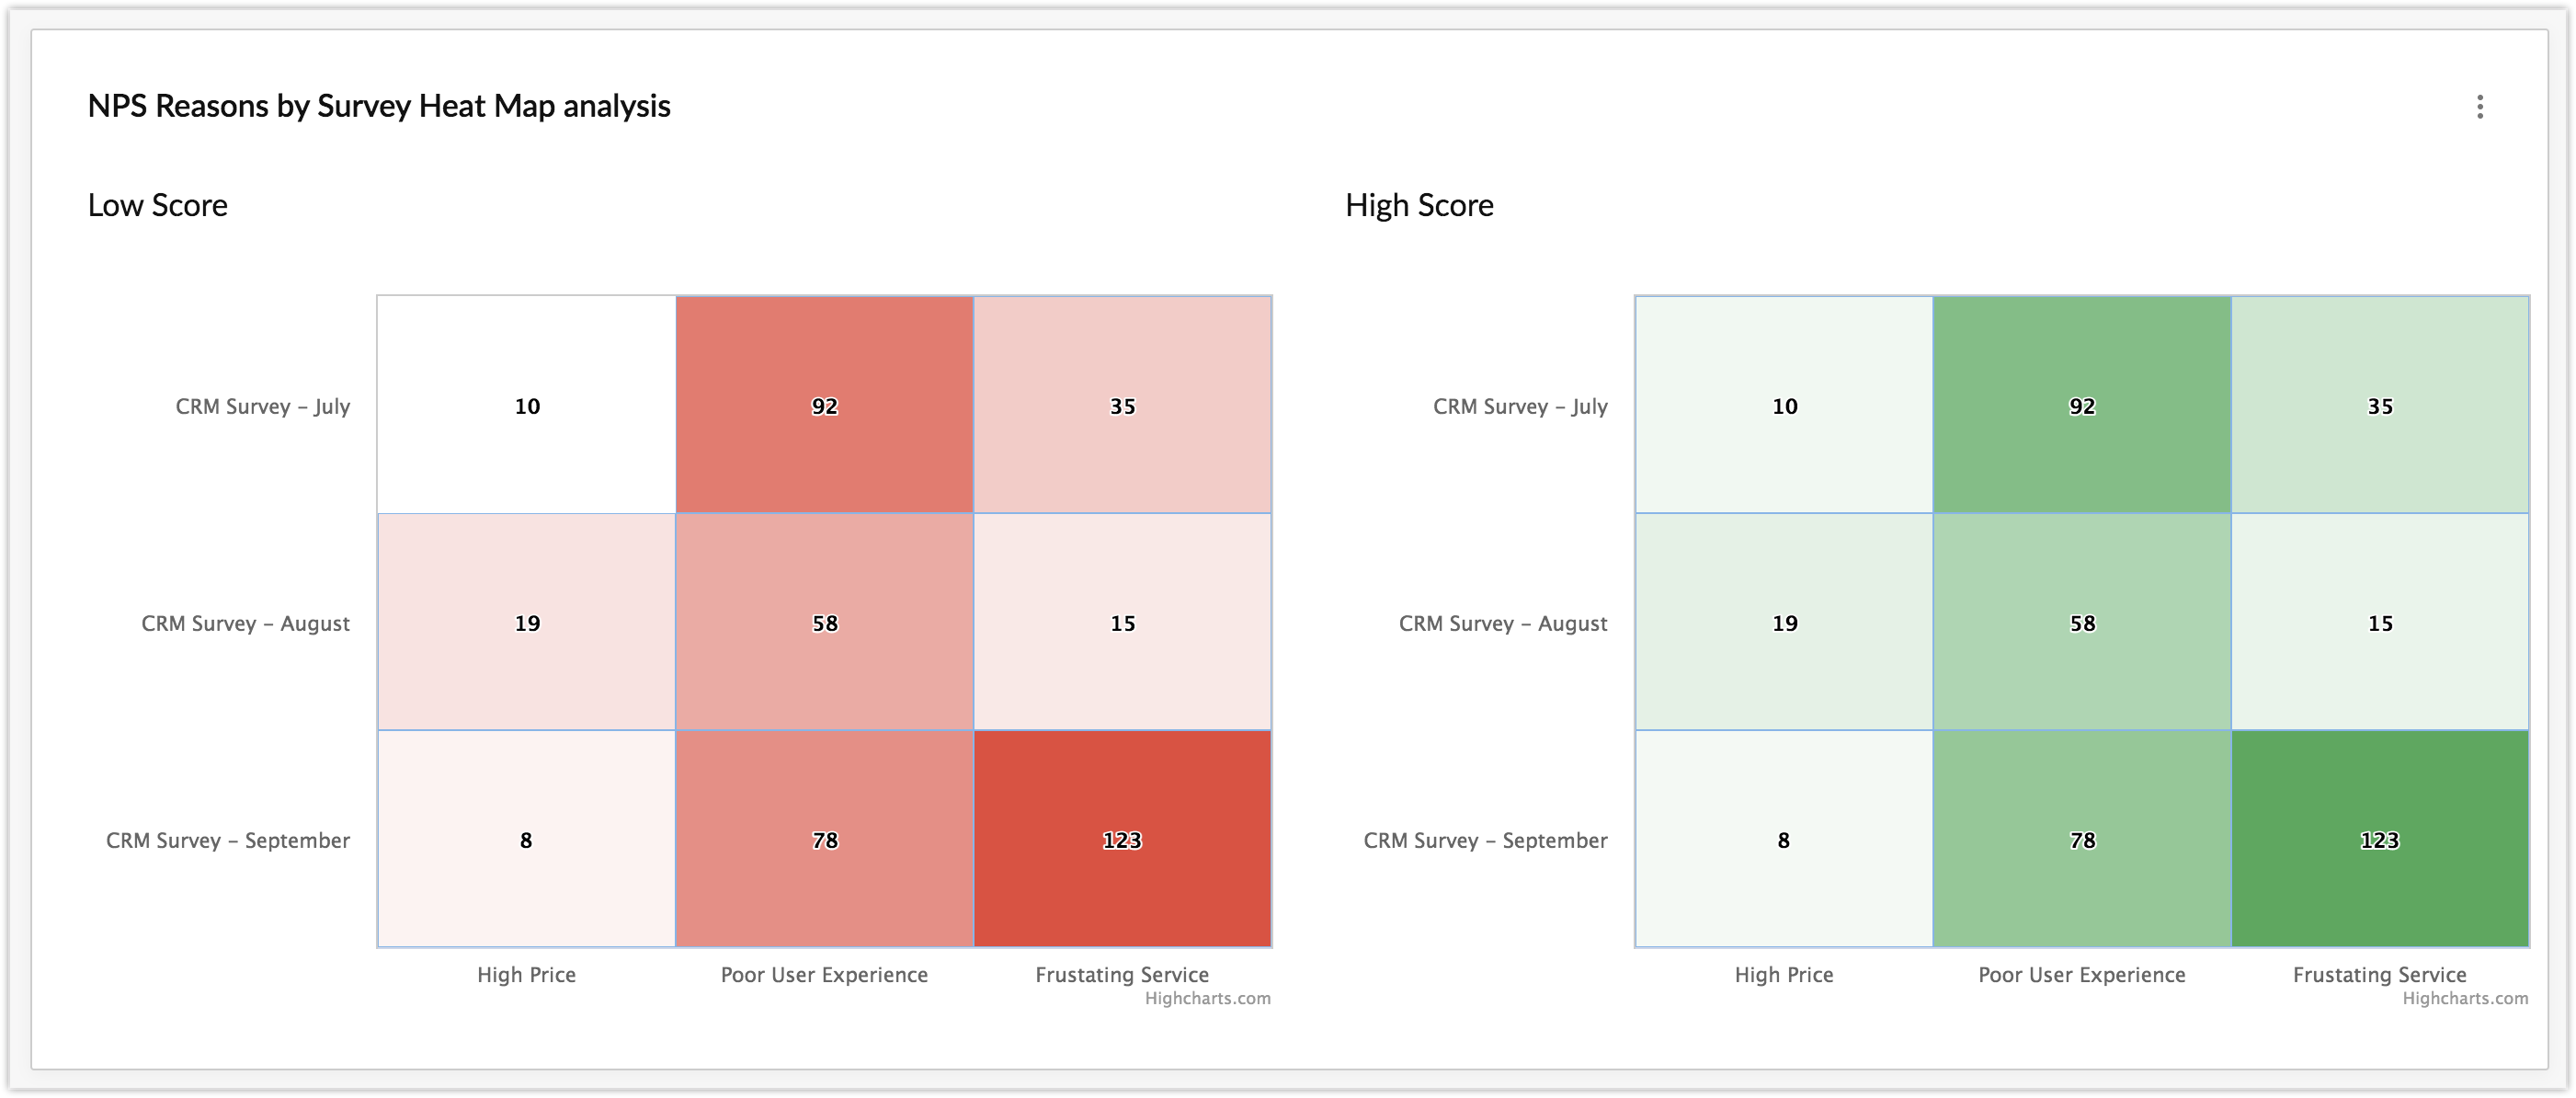
 14. NPS Reasons by Survey Heat Map analysis


 15. Question Related Insights

Zoho CRM Training Programs
Learn how to use the best tools for sales force automation and better customer engagement from Zoho's implementation specialists.
Zoho DataPrep Personalized Demo
If you'd like a personalized walk-through of our data preparation tool, please request a demo and we'll be happy to show you how to get the best out of Zoho DataPrep.
You are currently viewing the help pages of Qntrl’s earlier version. Click here to view our latest version—Qntrl 3.0's help articles.
Zoho Sheet Resources
Zoho Forms Resources
Zoho Sign Resources
Zoho TeamInbox Resources
Related Articles
Survey integration in Sandbox
Businesses look to develop a deep understanding of customer needs, stay aware of their preferences, and keep track of customer satisfaction. From finding the target market to monitoring post-purchase sentiment, surveys serve as structured and ...Process management capabilities in Zoho CRM — Comparison
Process management solutions in Zoho CRM are primarily categorized under business process management and customer experience management. While business process management typically deals with streamlining internal process flows for operations and ...Qualtrics for Zoho CRM
Qualtrics is experience management software that provides resources for managing, strategizing, measuring, and improving all aspects of the customer experience. It helps businesses conduct market research, analyze sales team interactions, and ...Working with Zoho surveys in CRM Android app
Your business often needs feedback from your customers to understand their experience, improve your services and to build stronger relationship. By integrating Zoho Surveys with CRM, you can send surveys directly to your customers as emails and also ...Working with Zoho surveys in CRM iOS app
Your business often needs feedback from your customers to understand their experience, improve your services and to build stronger relationship. By integrating Zoho Surveys with CRM, you can send surveys directly to your customers as emails and also ...


