Headquarters Dashboard: Real-Time Customer Support Management
The Headquarters dashboard is designed to provide live and actionable insights into the organization's activities. The dashboard consolidates real-time data, allowing managers to track their team's performance and ensure that the required metrics are met.
There are eight components in the headquarters dashboard that help managers make informed decisions and operate more efficiently by optimizing agent allocation during increased traffic.
The components in the HQ dashboard are:
- Incoming and Outgoing Bandwidth
- Live Traffic
- Unassigned
- Online Agents
- Offline Agents
- Most threaded tickets
- Customer Happiness
- Negative Ratings
Incoming and outgoing bandwidth
The bandwidth chart displays the number of incoming and outgoing responses in the form of a line graph for quick and easy analysis.
For example, if a retail company offers a limited-time discount and wants to track customer engagement during that period, the team can filter the component by duration and identify the number of incoming queries and the response sent to them by the agents.
This allows the company to assess the immediate impact of the promotion, identify any spikes in customer queries, and quickly allocate agents to handle the queries, ensuring timely responses and optimal customer service.
By default, the responses sent and received in the last 24 hours are displayed.
The data can be filtered for Today, Last 7 days, Last 30 days, Current Week, Current Month, and Custom to view the frequency of incoming and outgoing responses.
The data can be filtered for Today, Last 7 days, Last 30 days, Current Week, Current Month, and Custom to view the frequency of incoming and outgoing responses.
You can also filter based on the responses received in different channels such as email, chat, and phone.
Live incoming and outgoing traffic
The live traffic gives a quick glimpse of the current incoming and outgoing responses. It shows the traffic in the last one hour.
For example, a feature is released as early access to the customers on request, and the product management team has made a detailed announcement post on the same. Once the customers understand what the feature offers, there may be a spike in the number of incoming queries when they want to try it out. The team can monitor the volume of tickets in real-time and analyze the time taken to resolve the tickets.
By filtering this data, the team will be able to understand the time the queries came in. the manager or team lead will be able to assess if the incoming ticket spike is immediately after the announcement, at a specific time of day, or across specific days of the week.
This way, they will be able to allocate more agents from the team to handle the tickets efficiently. The responses sent by the agents are calculated as the outgoing response, and it will help the managers identify if there is any in the response, and if SLA is adhered.
Unassigned tickets
If the incoming ticket count is high, the backlog count will increase, and there will be an increase in the number of unassigned tickets.
To prevent delays and ensure timely resolution, the support managers can filter the tickets that are overdue and assign them on priority.
Regular monitoring can help them optimize ticket assignment and create workflows to resolve L1 issues by sending automatic responses.
This component displays the total number of unassigned tickets that are:
- On hold - If a customer raises a request for service approval, but their contract is nearing expiration, the finance team will not process the request. The ticket will be put on hold, and it will not be assigned to any agent.
- Open - Unassigned tickets that are open.
- Due in one hour - Unassigned tickets that are due in an hour.
- Overdue - Unassigned tickets that were not closed within the SLA and are already overdue.
The managers can find ways to expedite resolution by assigning these tickets to agents on priority.
Agent status: Online and offline
The component gives a glimpse into the agent's status in different channels. Managers can filter and find out in which channel - email, chat, or phone- the agents are online or offline. The component also displays their overdue tickets, tickets due in one hour, and pending tickets in each channel.
A ticket that is due in an hour or overdue can be immediately assigned to an agent who is online or available in a particular channel. Tickets can be reassigned or transferred to agents who are active in other channels like chat or phone for a quick resolution.
In both the components, the agents with the most overdue tickets are listed at the top, allowing the manager to quickly identify the agents who have the highest number of overdue tickets. Further scrutiny can help analyze the reason and take preventive measures. Agents can also be offered insights on how to adhere to SLA.
Most threaded tickets
When the support team sends multiple follow-ups or resolutions or the customer sends multiple messages to a ticket, the number of conversations (threads) in a ticket will increase. This could occur for several reasons, including the complexity of the issue, an extended resolution time, or the need for more ongoing communication with the customer.
The most threaded tickets component highlights the top 25 tickets with the highest levels of discussion and engagement over the past 30 days.
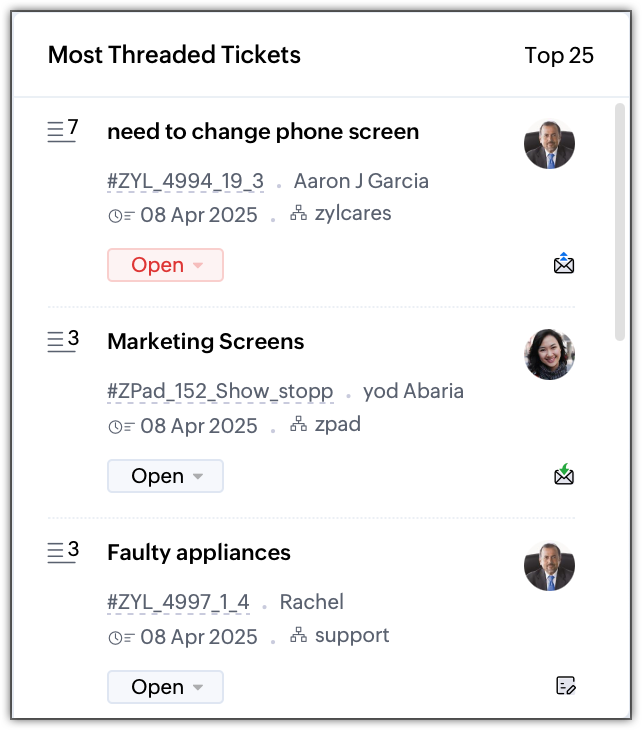
This component helps the manager identify the underlying reason for multiple conversations. By pinpointing these issues, the manager can also train agents on how to handle similar interactions more effectively in the future.
Another way to reduce back-and-forth communication in a ticket is by scheduling a call to provide a direct resolution.
Customer happiness
The customer happiness component displays the overall customer satisfaction score from the past 25 days.
A positive rating provides valuable insight into what the team is doing well and highlights areas where customer expectations are being met or exceeded.
When a customer contacts support for a query, the support agent provides a resolution. Once the resolution is provided, a survey is sent to the customer to rate the overall experience. A lower rating indicates that the customer is not satisfied with the experience. It could be due to the time taken to provide resolution, the effectiveness of the fix suggested, or the agent's knowledge of the query.
A higher rating indicates that the customer is happy with the efficiency and clarity of the support provided.
By analyzing these positive feedback patterns, the team can replicate successful strategies and continue delivering exceptional service.
This will help them maintain a high customer satisfaction score and improve overall service quality.
Negative ratings
The negative ratings component displays the negative ratings provided by the customers in the last 25 days.
When a customer provides a lower rating, it is important to analyze the area of improvement. For example, the lead or managers should assess why the score is low and provide feedback/guidance to the team on how to improve customer satisfaction.
It could be in better communication, response time, adhering to SLA, and issue resolution quality.
If the customer provided a negative rating for a feature or requirement, they can also reach out to the customer to understand their requirement and address the issues accordingly.
By tracking and responding to low ratings promptly, teams can improve customer satisfaction.