Knowledge Base Dashboard
The knowledge base dashboard provides a visual representation of essential insights about published articles. This allows writers or content creators to track the article's performance and popularity over time. Metrics such as article count, number of likes and dislikes, feedback, and comments can help identify gaps and areas for improvement.
By having this consolidated data in one place, the teams can make data-driven decisions to enhance both internal processes and customer experience. They can identify the content that needs an update based on the article usage, using which the content update can be prioritized, missing information can be included, and customer feedback can be addressed in the article.
For example, upon publishing the revamped article, the agent can reset the article metrics, such as Views, Likes, and Dislikes to record fresh data. If the manager wants to know how many revamped articles have been published in the last 30 days and assess the insights for those, then they can navigate to the KB dashboard and check metrics such as article count, usage metrics, and most referenced articles, views.
Accessing the knowledge base dashboard
The KB dashboard can be accessed from the KB detail page.
Summary of article insights
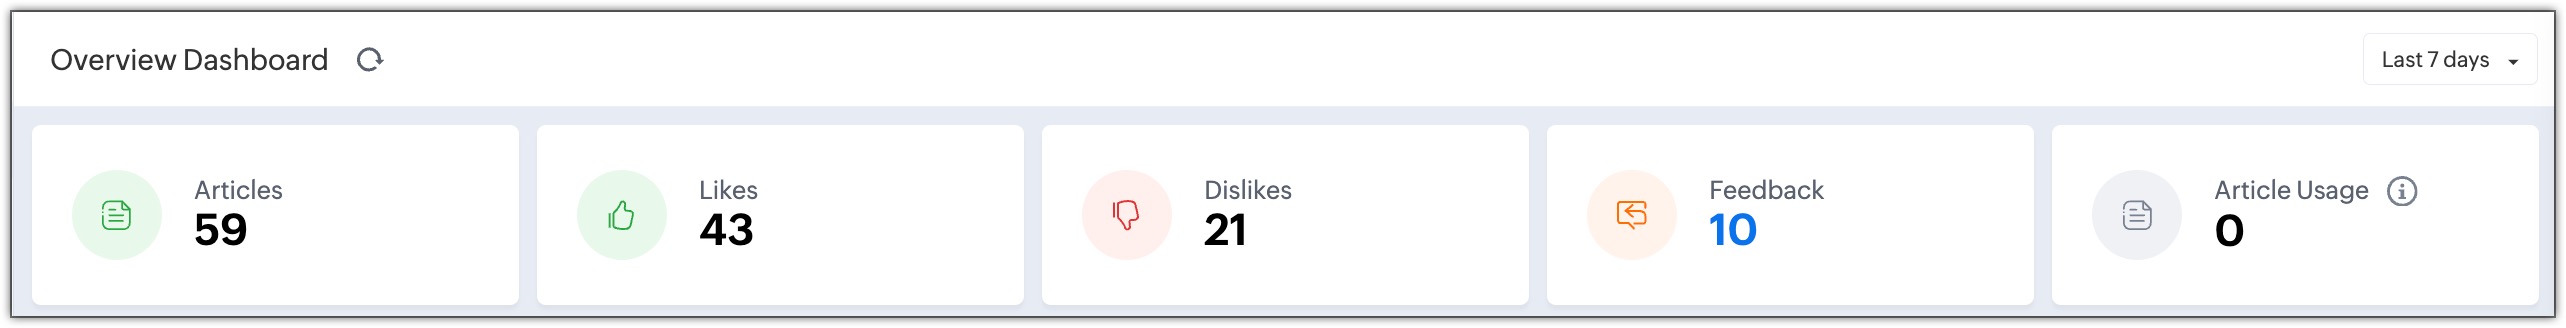
The summary of the article views, likes, dislikes, feedback, and article usage for a specific time are displayed on the top.
For example, the number of feedback received in the last 7 days, article usage in the last 30 days, and so on.
- Hovering on the article count will provide a breakup of the new and updated articles.
- Clicking on the feedback count will display the number of feedback received bythe customer for a specific period.
The feedback also shows the article name, details of the customer, and along with the timestamp. - The data displayed in the dashboard is as per the duration selected from the drop-down.
- The data can be filtered for Last 24 hours, Last 7 days, Last 30 days, Last 365 days, and Custom.
- The article usage metrics display the overall count of articles being referred in tickets.
Keyword search stats
The Keyword search stats displays the keywords used by customers in their searches. These keywords are categorized into two: Popular and Failed.
The popular or trending keywords are the ones that the customers use frequently to find articles, and the failed keywords are the ones using which an article is not fetched.
By identifying trending keywords, the team can understand what customers are most interested in. Additionally, if certain relevant keywords fall into the failed category, the team can update articles with the necessary information and optimize the content by adding those keywords to the SEO and meta tags.
Article views
Total number of views received on a published article for a duration. For example, you can find out the number of views the articles received in the last year to understand their contextual usage, popularity, and user preference.
It also provides a breakdown of views by user type: All Users, Registered Users, and Anonymous Users. Hovering on the graph will show the exact count based on the user type.
This will help the team analyze how many users are accessing the articles on a daily, monthly, or yearly basis.
If specific articles get a maximum number of views in a day, it could indicate that a particular app or tool is experiencing issues, generating increased user interest, or that there is a sudden spike in customer queries related to that topic. This insight helps the team to identify trends, address potential problems immediately, and update content accordingly to meet user needs.
By default, the line graph shows the number of views received across the help center, ASAP web widgets, and ASAP Mobile SDKs. You can filter and see the number of views in each channel to compare which channel got the most interaction and enhance engagement in that channel.
The legends in the graph, All users, Registered Users, and Anonymous users, can be selected individually or together from the bottom to see user specific views.
Likes and dislikes
The customers have an option to like or dislike an article from the help center. The number of likes and dislikes received by the registered users and anonymous users over time may provide information on the content's popularity, relevance, and utility.
A larger number of dislikes can indicate that the article needs an update as the information is either obsolete or incorrect.
The legends, Likes and Dislikes, can be selected individually or together to filter specific data.
Article usage metrics and most referenced articles
This component shows how often the articles are referenced in the tickets by the agents.
By tracking this metric, content development teams can prioritize updates to the articles that are commonly referred by the agents and also sent to the customers for reading. It also helps identify the frequently used articles, allowing the team to focus on improving high-priority content for better customer support. For example, pricing, troubleshooting tips, onboarding guidelines, and so on are commonly referred to articles both internally and externally and hence must be kept updated always.
Clicking on the article name will redirect the users to the respective articles.
Trending articles
The list of articles that receive the maximum views from the users are considered trending. With the list of trending articles, the team will be able to identify the topics of interest.
The team can also access the number of articles that have the maximum likes and dislikes. This will help the team assess what went well in the articles that are liked the most and what didn't go well in the articles that are disliked the most, and proactively work on improving them.
View All displays all the trending articles.
Article effectiveness
The list of articles that are used the most by the users. The metrics, such as article views, feedbacks, ratings (likes and dislikes), are used to determine the article that has the maximum number of interactions.
The article name along with the number of article views, percentage of feedback, likes, and dislikes are displayed.
Article effectiveness can be important to identify the type of content referred by the customers and perhaps implement a similar structure in other articles to enhance self-service experience.