The Zoho Flow dashboard provides actionable insights about your flows, without needing to sift through large volumes of data to assess performance. You can view how successful the flows in your organization are at a glance, and make informed decisions about productivity.
If you've built flows for all the important workflows in your organization, the dashboard can even give you key performance indicators about your team or your organization as well. For example, say you have a flow that triggers when a subscription is renewed for your product. If this flow is on your list of top five flows and has thousands of executions, it means that your customers are happy with your product.
The top section of the dashboard shows the total number of flows in your organization, how many are live, paused, and in draft. It also shows the tasks consumed by your flows for the month along with the date it'll reset


Live: The flows that are switched on
Paused: The flows that were live but are now switched off
Draft: The flows that are work in progress and have never been switched on
Flow Execution
This section shows various numerical and visual representations of the success and failure rates of your flows over a particular period of time. Choose a time frame from the dropdown to view executions for that period. By default, Last 7 Days is selected, and the corresponding metrics are displayed.
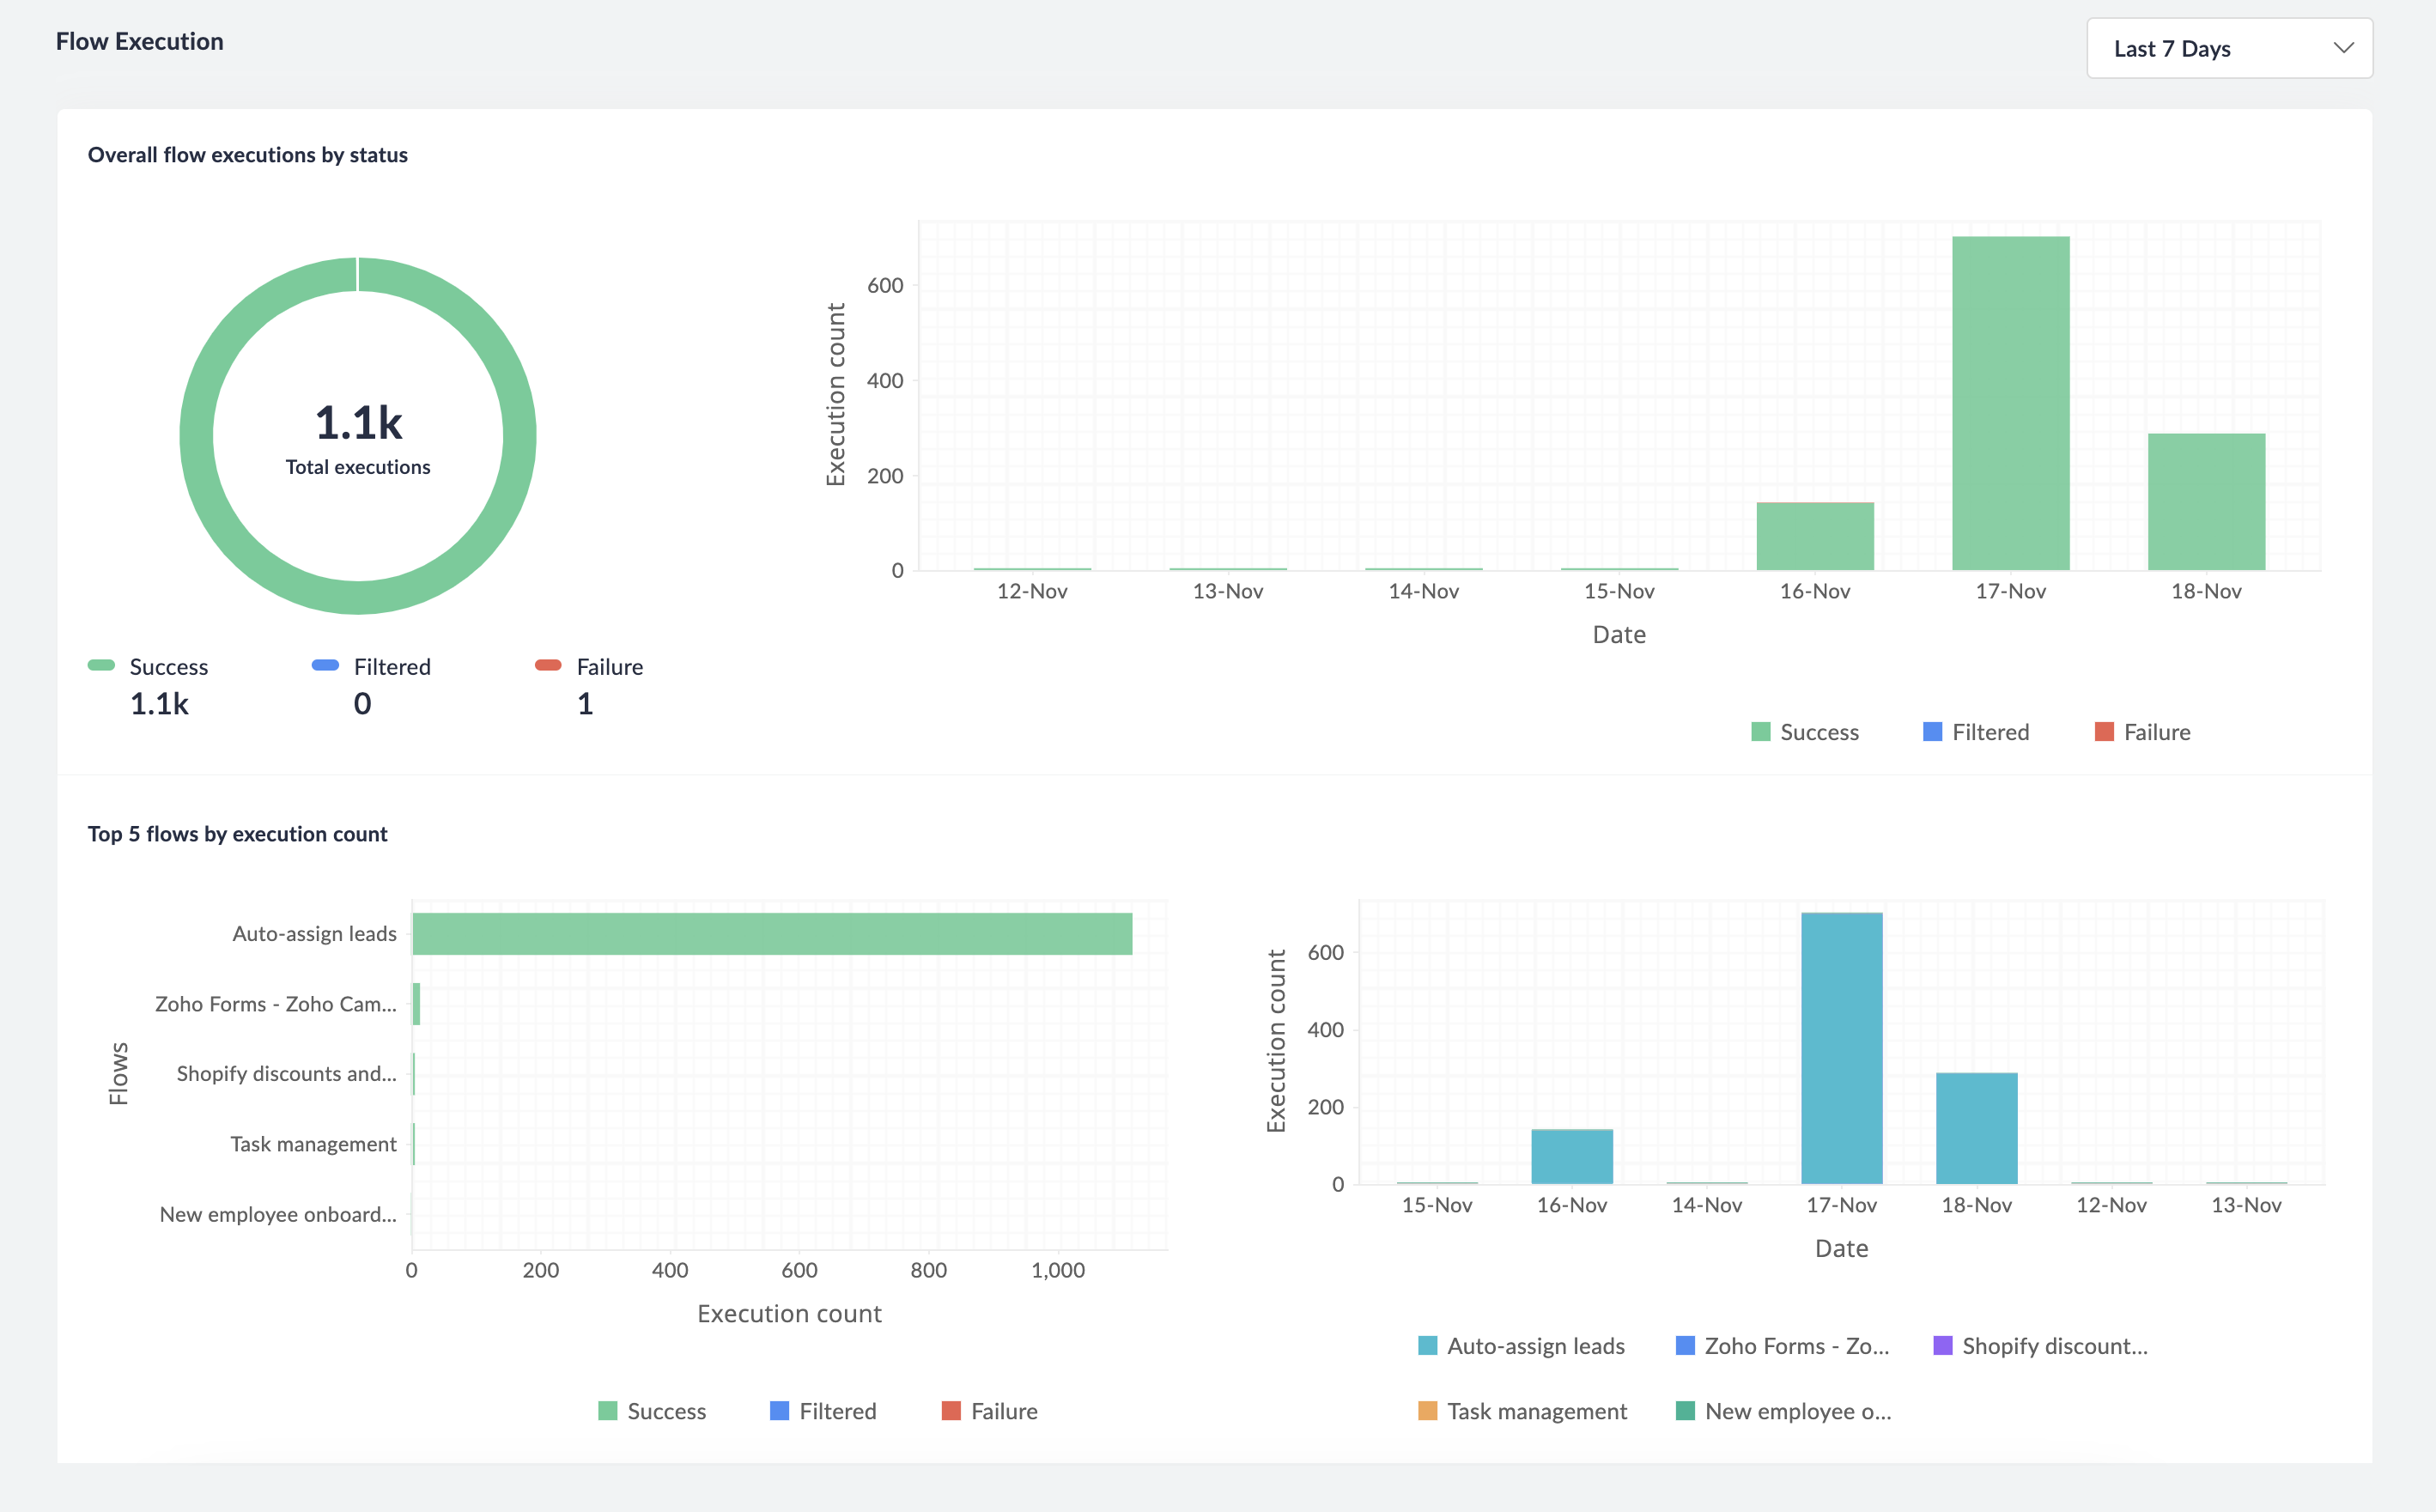
Overall flow execution by status
The total number of executions during the selected period, split in to successful, failed, and filtered executions.
Top 5 flows by execution count
The top five flows in your organization are the ones with highest numbers of executions. You can see how many of a flow's executions are successful, filtered, and failed. You can also see the spread of executions across days, weeks, or months based on the duration you've selected.
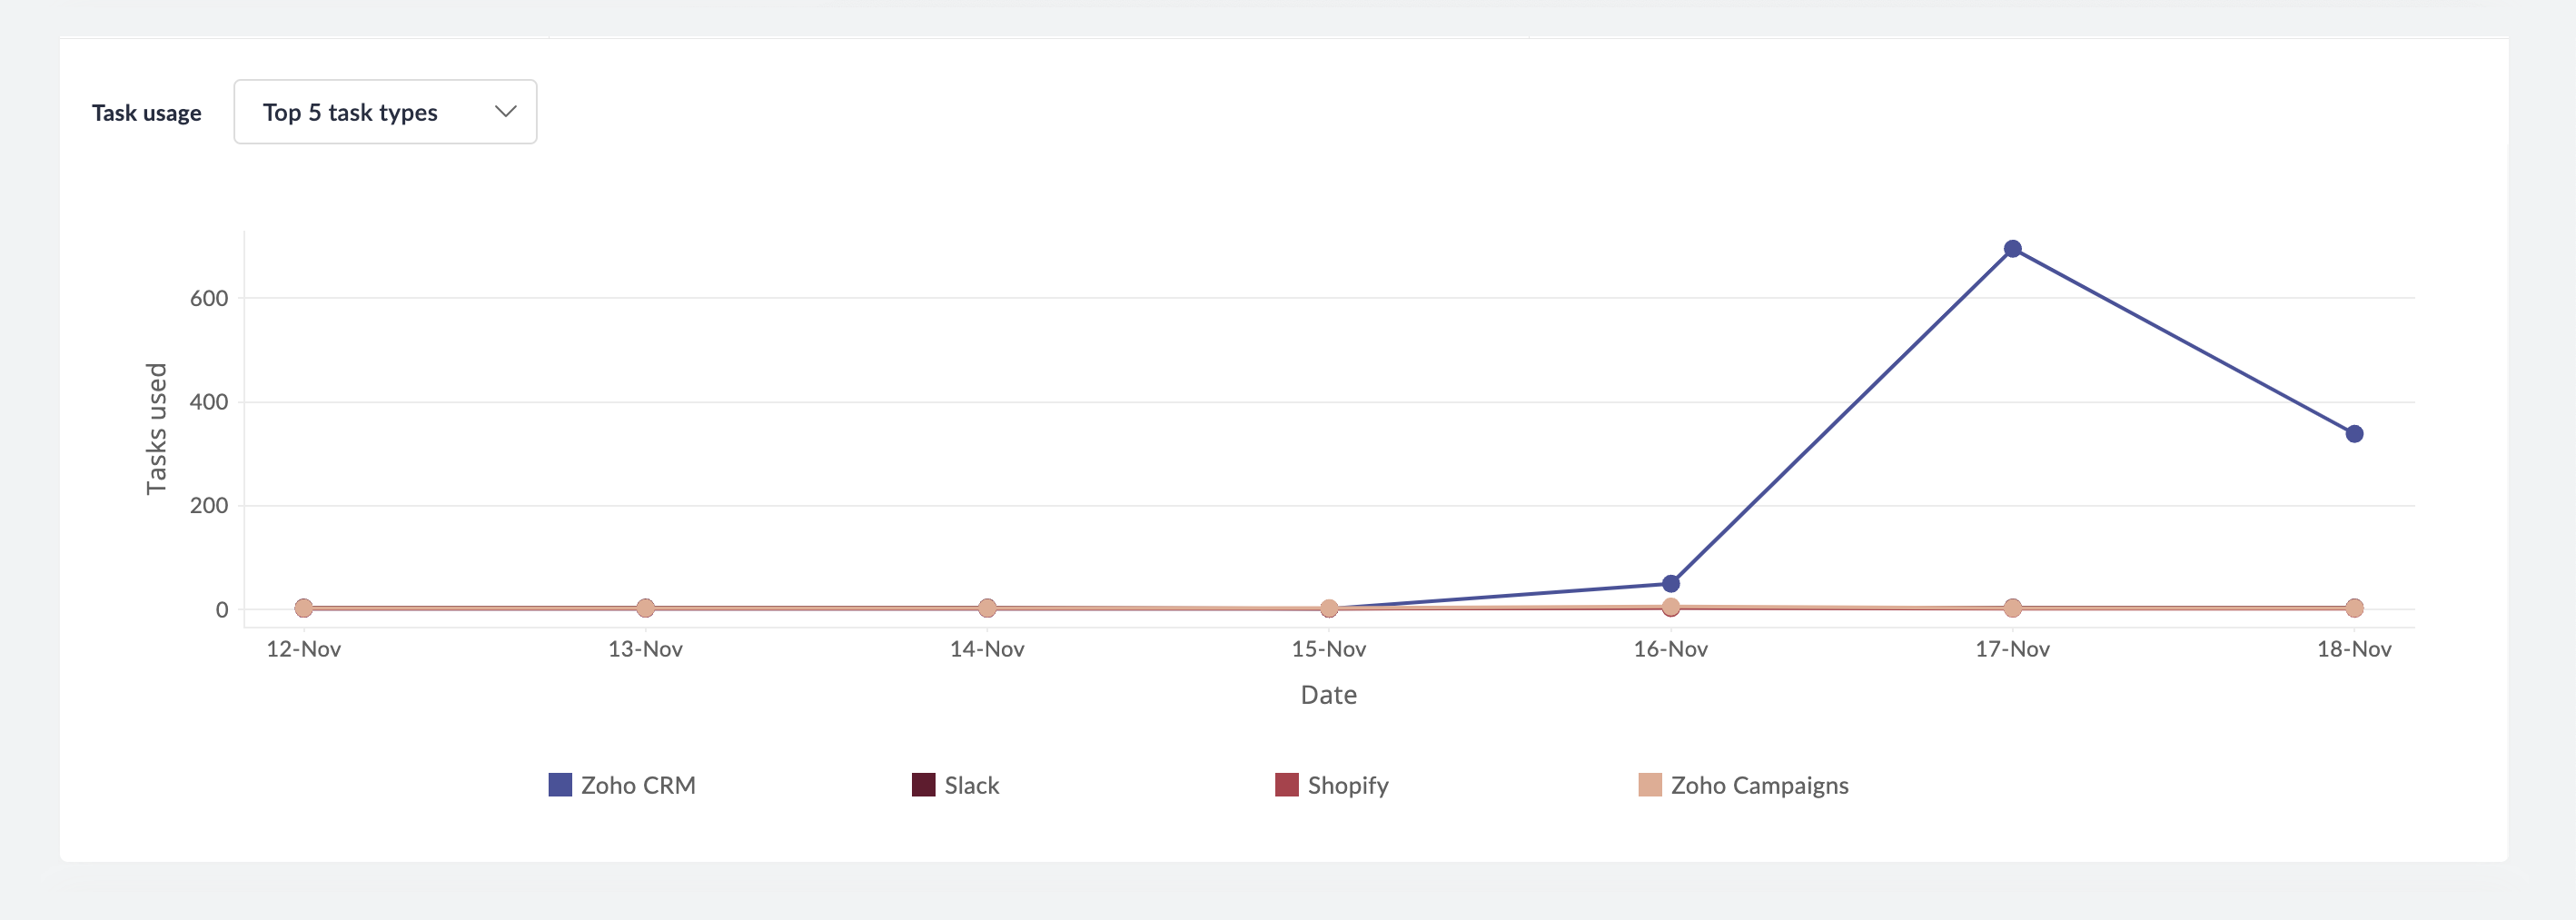
Task Usage
This section shows various insights into how your Zoho Flow tasks are being consumed by your flows.
Overall task usage
The total number of tasks consumed during the selected time period.
Task usage by flow
The task usage of different flows that have executed during the selected time period.
Task usage by task type
The task usage of different task types (app actions, custom functions, etc.) that have executed during the selected time period.
Task usage for top 5 flows and task types
In this section, you can see the task usage of the top five flows or the top five task types in a graphical format over the selected time period.
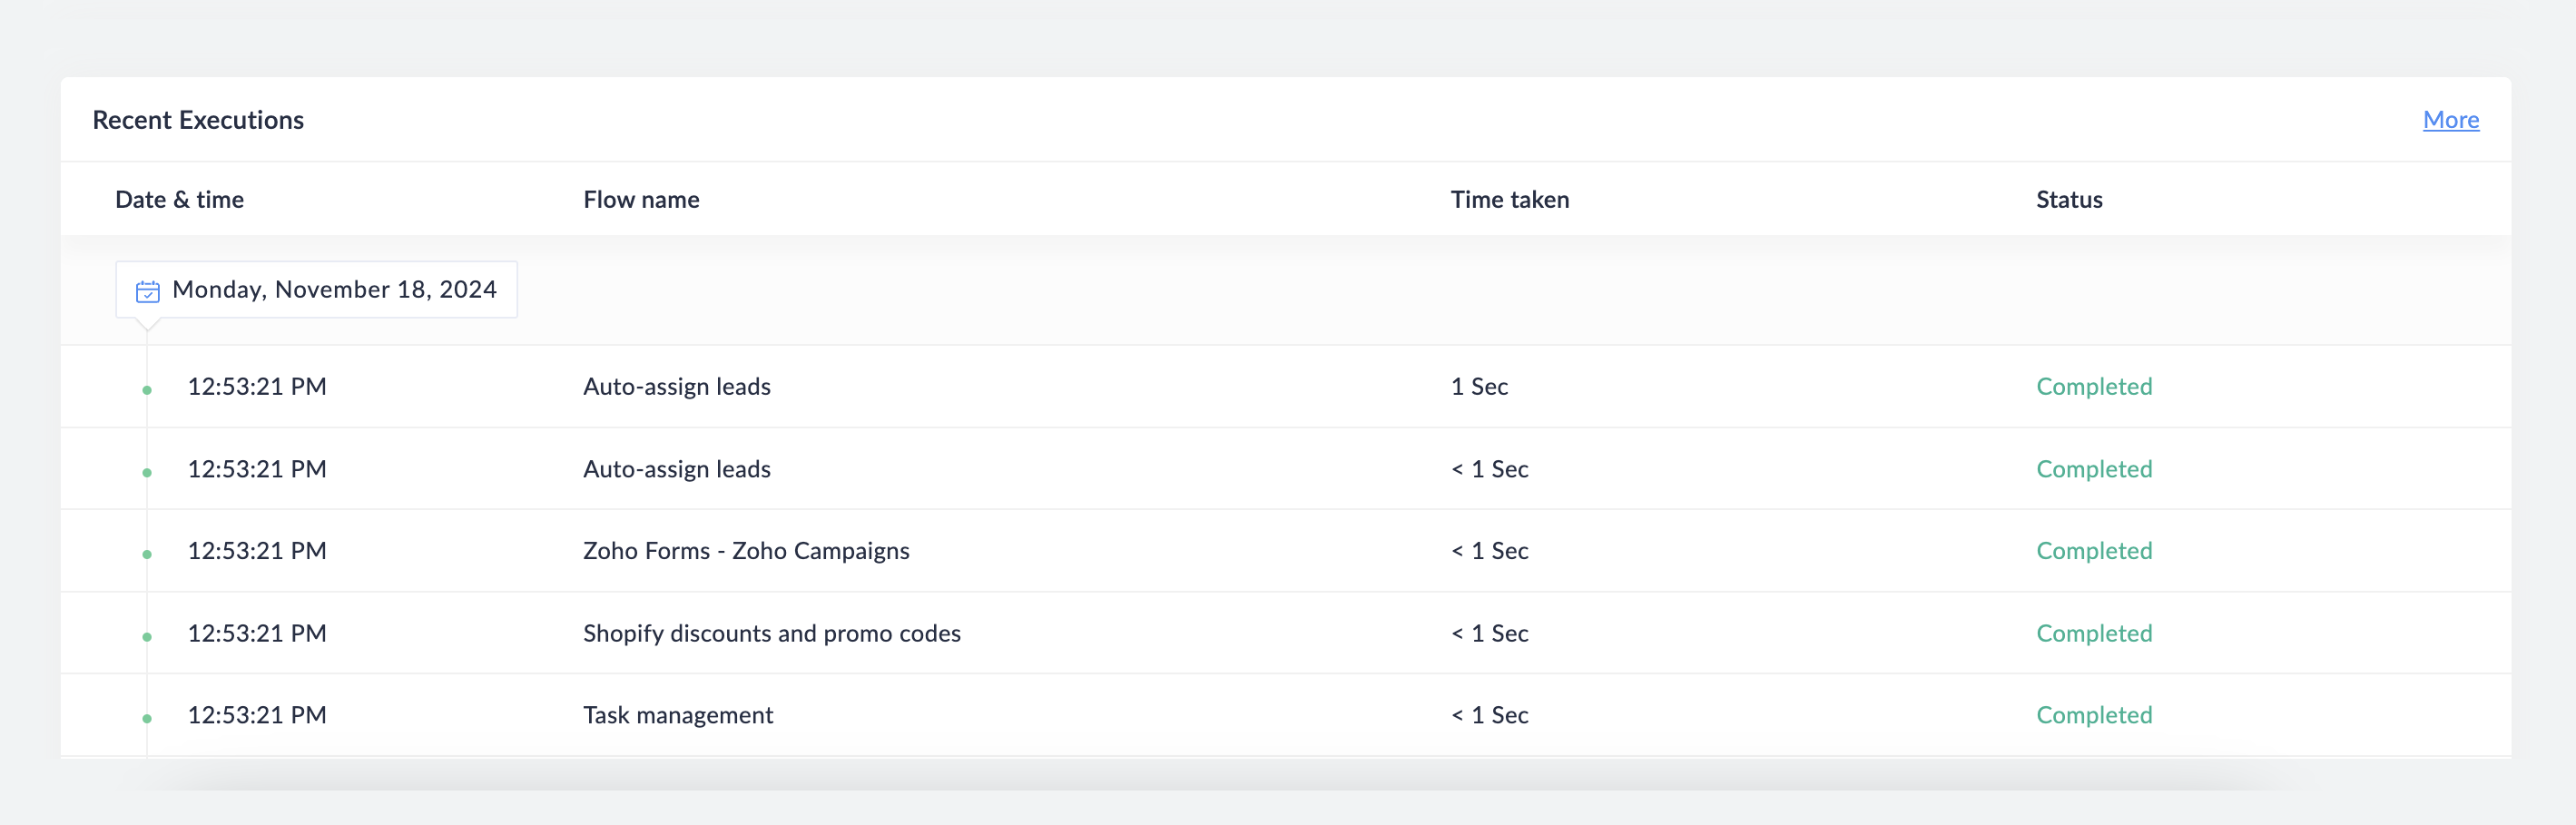
Recent Executions
This displays the most recent executions in your organization. Clicking on a flow will take you to its summary tab, where you can view further details about the flow.
If there are no recent executions, check whether your flows are switched on and executing.