Understanding Dashboards
A dashboard is the primary user interface in the Zoho IoT application, displaying vital monitored metrics of devices and assets within the IoT network. A well-designed dashboard serves as a health monitor for the network, showcasing both real-time and historical data.
Dashboards are constructed using widgets, such as charts, dials, maps, and tables, and so on, to display complex and essential information in easy-to-understand formats. These dashboards can be viewed by selecting the Dashboard option from the end application's navigation menu in the left pane.
The Global Dashboard can be viewed by selecting the Dashboard option from the End Application's navigation menu in the left pane.
Image: Sample dashboard with card and dial widgets.
Sample Dashboards
Screenshots of a few dashboards created using different types of widgets are provided below:
Sample 1: Smart Building solution dashboard
The Smart Building dashboard displays occupancy details, energy usage, water usage, etc.
Image: Dashboard with dial and card widgets
Sample 2: Energy Monitoring solution dashboard
The Energy Monitoring solutions dashboard displays energy consumption details in card, chart, and calendar widgets.
Image: Energy Dashboard using the graph, card, and calendar widgets
Image: Energy Dashboard using the stacked chart widget
Image: Energy Consumption dashboard using the heatmap widget
Sample 3: Water Consumption solution dashboard
The Water Consumption solution dashboard displays water consumption details in card, dial, and chart widgets.
Image: Water Consumption in multiple widgets
Dashboard Types
There are two main categories of dashboards that you can create in an IoT application: the General Dashboard and the Model Specific dashboard.
General Dashboard
In General Dashboard you can create a dashboard, and then create widgets by selecting a model or module and the values that need to be displayed in the widget. This dashboard can combine data from different models of assets, devices, locations, or any other custom modules. And any changes to the conditions applied to a widget in the general dashboard must be done to the individual widget.
Model Specific Dashboard
In the case of Model Specific dashboards, you can create the dashboard specifying a particular model or related module of asset, device, location, or a specific custom module. Any widget created in this dashboard will be for that model or a related module. This dashboard provides the option to apply data filter on the model's properties in all the widgets at the same time.
Note: Refer to the Working with Dashboards document for more details.
Dashboard Terms
A few dashboard-related terms are provided below for easy understanding of the feature and the available options.
Default Landing Dashboard
Generally, the dashboard that displays the vital metrics of the application is configured as the default dashboard. You can configure the default dashboard by choosing the Set As Default option next to the dashboard's name from the dashboard's drop-down list.
Favorite Dashboards
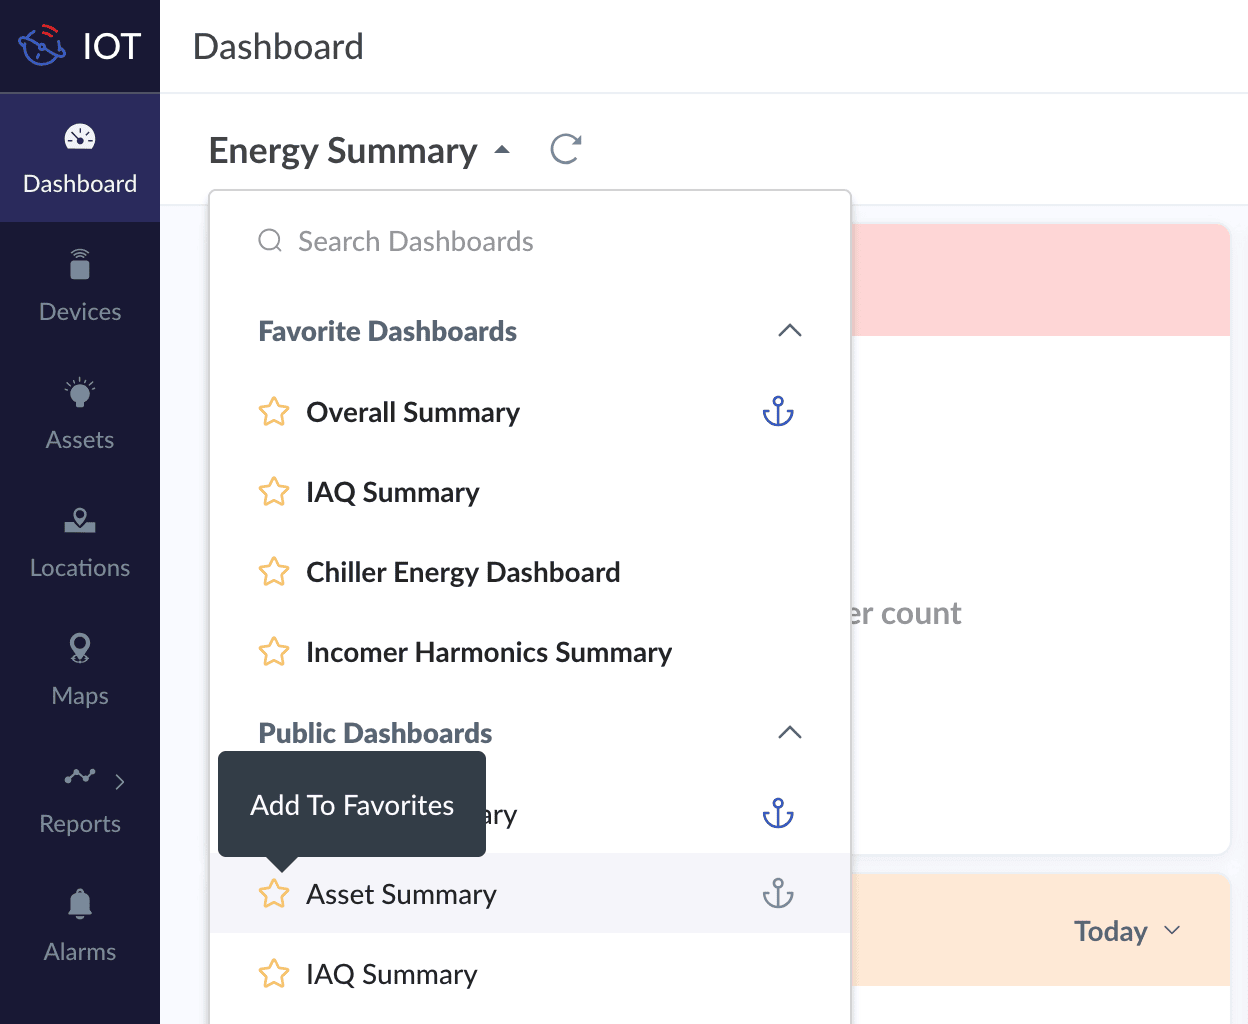
Frequently visited dashboards can be marked as favorites for easy access by clicking on the Add To Favorites icon in the dashboard's drop-down list.
Dashboard Groups
Dashboards can be grouped to streamline access and enable users to find and display dashboards easily. For example, dashboards for specific user profiles can be grouped together. All dashboards relevant to supervisors can be grouped under the "Supervisor Dashboards" group. Similarly, location-based monitoring dashboards can be grouped under the location's name. For example, all dashboards related to energy monitoring, smart lighting, and so on, in the location Zylker Chennai office can be grouped under "Zylker Monitoring".
The dashboard can be included in particular groups during creation in the New Dashboard form.
The dashboard can be included in particular groups during creation in the New Dashboard form.
Image: Dashboard creation form
Image: Dashboard in Group
Time Selection
The Time Selection option can be used to specify the time period to be set for all the widgets in the dashboard. This option is selected when creating a dashboard, and is applied to all widgets added to the dashboard. The time period can be updated at dashboard level by selecting the new time period from the drop down list on the top.

Refer to the Setting Time Selection section in the Working with Dashboards document for more details.
Dashboard Operations
Various dashboard related operations that you can perform are listed below:
Add Widgets: This option is used to add a widget to the dashboard.
Manage Widgets: This option is used to show or hide a widget in a dashboard.
Edit Layout: This option is used to modify the widget arrangement, resize the widgets, and add new widgets to a dashboard.
Edit Details: This option is used to modify the details such as the name, group, and permissions of a dashboard.
Export Dashboard: This option is used to export the widgets in the dashboard.
Clone: This option is used to create a cloned version of a dashboard.
Delete: This option is used to remove a dashboard from the application.
Understanding the Dashboard Builder
The dashboard builder is a tool to perform actions such as resizing and rearranging the widgets on the dashboard grid by simple drag and drop actions.
There are two instances when the dashboard builder is invoked: when creating a new dashboard and when editing the layout of an existing dashboard. You can add widgets, delete widgets, rearrange and resize the widgets in a dashboard using this tool.

Note: Widgets can be added, deleted from the Dashboard view also. Refer to the Working with Widgets document for more details.
To add widgets, delete widgets, rearrange and resize the widgets in a dashboard,
- Select Dashboard from the application's main menu on the left pane in the developer application.
- Select the dashboard you want to edit from the drop down list.
- Click Actions, then select Edit Layout to edit a dashboard which you have already created in the dashboard builder.
Note: Widgets can be edited or deleted from the widget in the dashboard view also. Refer to the Working with Widgets and Working with Dashboards document for more details.
Availability

All Dashboard operations require necessary permissions. Refer to Users and Profiles document for more details.
Check Feature Availability and Limits
Check Feature Availability and Limits
See Also