Working with Widgets
Creating Widgets
This section of the document provides an overview of creating and editing various types of widgets.
The following are the ways to create & add widgets in a dashboard.
- When creating a new dashboard.
- Using the Actions > Add Widget option in the existing dashboard's view screen.
- Using the Add Widget option when accessing the dashboard builder.
To add widgets when creating a new dashboard:1. Go to the End Application.2. Select Dashboard from the application's main menu on the left pane.3. Click the Add Dashboard button in the top-right corner. The Widget's welcome screen is displayed.4. Click the OK button, and select the required widget type from the left panel.5. Select the required widget from the widget gallery.6. Configure widget properties. Widget properties are different for every type of widget. Refer to the documents under Different Types of Widgets for more details on creating each widget.7. Click Create to add the new widget to the dashboard.To add widgets using the Add Widget option from the dashboard view:1. Go to the End Application.2. Select Dashboard from the application's main menu on the left pane.3. Select the dashboard to which you want to add the widget from the dashboards drop down list.4. Click Add Widget from the Actions button.5. Select the required widget type from the left panel.6. Configure widget properties. Widget properties are different for every type of widget. Refer to the documents under Different Types of Widgets for more details on creating each widget.7. Click Create to add the new widget to the dashboard.To add widgets using the Edit Layout option from dashboard view:1. Go to the End Application.2. Select Dashboard from the application's main menu on the left pane.3. Select the dashboard to which you want to add the widget from the dashboards drop down list.4. Click Edit Layout from the Actions button.5. Select the required widget type from the left panel.
6. Configure widget properties. Widget properties are different for every type of widget. Refer to the documents under Different Types of Widgets for more details on creating each widget.7. Click Create to add the new widget to the dashboard.
Availability

All Widget operations require necessary permissions. Refer to Users and Profiles document for more details.
Check Feature Availability and Limits
Check Feature Availability and Limits
Editing Widgets
An existing widget can be modified using the Edit option in the Ellipse button.
To edit a widget:
1. Select the dashboard in which the widget to be edited is present.2. Click on the vertical ellipsis button and the Edit option to display the widget configuration screen with the current values.
3. Modify the required values.
4. Click Save.

Note: You can modify the style of a widget to another compatible style by using the Change Style option. Similarly, you can modify the time frame of period-based charts, graphs etc.
Cloning Widgets
The Clone option is used to create a widget similar to any existing widget and with minor modifications. Cloning helps you avoid performing repeated configurations.
To clone a widget:
1. Select the dashboard in which the widget to be deleted is present.2. Click on the vertical ellipsis button on the widget, then select the Clone option from the drop down menu.3. Modify any required values.4. Click Create.
Deleting Widgets
The Delete option is used to remove widgets from the dashboard.
To delete a widget:
1. Select the dashboard in which the widget to be deleted is present.2. Click on the vertical ellipsis button on the widget, then select the Delete option from the drop down menu.
3. Click Delete in the confirmation window.
Changing Widget Styles
Widgets can be switched to other compatible styles of the same type without recreating the widget. For example, you can switch a Simple Card 1 style widget to a Simple Card 2 style widget. Similarly, graphs, charts etc., can also be changed to other compatible styles within their type.
Inline Switching
For inline switching, you can use the Change Style option on the top right corner of the widget in the dashboard view.
Note: The switching of widget style is for temporary viewing only and therefore the view is not saved anywhere. The widget is displayed in its original style when the client interface is refreshed.
The steps to be performed for Inline switching are provided below:
1. In the dashboard view, click the widget's Change Style image icon as shown in the above image. The compatible styles are displayed as options in the drop down list.
2. Choose the desired style.
Configuration Switching
Configuration Switching can be done using the Edit option on the widget in the dashboard view. You can provide the modified configuration values in the widget's edit screen and save the changes.
To switch style based on configuration switching:1. In the dashboard view, click on the vertical ellipsis on the top right corner of the widget2. Click Edit to invoke the Edit Widget screen.3. Click Change Style link below the sample image on the left.4. Choose the desired style.5. Modify the values you want to change.6. Click Save.
Advanced Options
Graph Widgets come with additional customization options such as Adding KPI Bar, Ranking/Sorting, Adding Threshold Line, and Configuring Axis Settings. These options will enhance the viewing experience providing more details in the charts.
The chart below displays the availablity of the options for timeseries and instance property grouping charts.
Timeseries Grouping Charts | Instance Property Grouping Charts | |
Add KPI Bar | ✓ | ✗ |
Add Ranking/Sorting | ✗ | ✓ |
Add Threshold | ✓ | ✓ |
Set Multiple/Single Axis | ✓ | ✓ |
Note: Card and Image Widgets have color code options to improve aesthetics and readability of the widgets.
Cards | Image | |
Apply Colors | ✓ | ✓ |
Ranking/Sorting
The ranking and sorting option helps you sort the data of the selected metrics in the chart.
Image: Chart displaying location-wise demand sorted in descending order
Adding KPI Bar
KPI Comparison bar displays the summary of the chart values. Here, you can also display the increase or decrease in value when compared to the previous period as positive/negative.
Note: The KPI Comparison bar is available for only Timeseries Group chart.
Image: KPI Comparison Bar in Chart
Configuring KPI Bar
Adding Threshold Line
A Threshold line can be drawn across the chart values to highlight the property values that are higher/lower than the threshold value.
Image: Distinctly displaying the devices having Alarm history count of more than 50.

Note: Multiple threshold lines can be used in a graph to visually distinguish between different performance levels or alert conditions.
Image: Configuring two threshold lines to distinguish each range value in the chart.
Image: Distinctly displaying the devices having Alarm history count between 30 and 50 using multiple threshold lines.
Configuring Threshold Line Color
The color of the threshold line can be set while adding the line.
Note: The Threshold Line setting is available for both Timeseries Group charts and Instance Property Group charts.
Configuring Threshold Area
The color of the area above and below the threshold line can be set while adding the line.
Adding Axis Setting
Axis setting helps to display metrics' values along a single axis or multiple axes. This provides a comparison view of the values as required.
Sample chart displaying the average values of CO2 and TOV Level in multiple axes
Image: Sample chart displaying the average values of CO2 and TOV Level in single axis
Configuring Axis Setting
Single and Multiple Axis settings can be configured using the Axis Setting option.
Multi-axes charts allow all measures to be represented with separate axes, ensuring better clarity when visualizing multiple metrics. Using custom axis range within multi-axes helps users to manage the range for selected metrics, tailoring the display to specific data intervals.
When data falls outside the defined interval in a custom axis range, there are two possible approaches:
- Dynamically adjusting the axis range to accommodate all data points.
- Displaying only the data that falls within the given range.
This flexibility helps in maintaining a focused and meaningful visualization.
Adding Comparison
Time grouping-based comparison allows you to visualize and compare data trends across different time periods such as days, weeks, months, or years in Line, Area, Bar, and Column charts.
Image: Sample chart displaying the comparison of fuel consumption vs fuel level in a line chart.
Configuring Comparison Chart
The configuration setting for a comparison chart can be done by selecting two Y-axis parameters.
Multi-axes charts allow all measures to be represented with separate axes, ensuring better clarity when visualizing multiple metrics. Using custom axis range within multi-axes helps users to manage the range for selected metrics, tailoring the display to specific data intervals.
When data falls outside the defined interval in a custom axis range, there are two possible approaches:
- Dynamically adjusting the axis range to accommodate all data points.
- Displaying only the data that falls within the given range.
This flexibility helps in maintaining a focused and meaningful visualization.
Applying Colors to Widgets
The aesthetics of your widgets can be enhanced considerably using color coding in widgets. This will help denote the intensity of the values displayed by using different color ranges and combinations based on the values. The two coloring types supported in the application are: Static and Dynamic.
Static Color
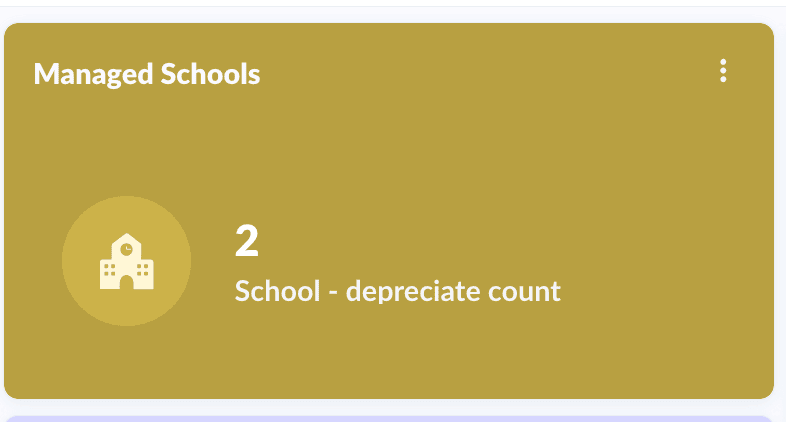
The card widget is filled with the selected color when using the Static option.
1. Colored widget
2. Show color only in header strip and icon
3.Show color only in icon holder
Dynamic Color
The card widget is filled with the selected color set for different value ranges.
As shown in the above image, the widget values/color mapping is segregated into three ranges for 0-200 values. When the value for the widget is above 133.33, the color of the widget is set to the third range color which is RED.
Note: The Apply Color feature changes in behavior based on the widget type and style.
Hide Title
The Hide Title option is used to hide the widget title.
Image: Devices Count Card widget with title "Devices".
Image: Devices Count Card widget without a title.
Color Scheme for Metrics
For Dial and Chart Widgets, the color scheme is configurable for each metric.
Hide Values for Metrics
Select the option Hide Data Values to hide the values displayed on any widget.
Image: Dial Widget with and without values displayed.
 For step by step illustration on working with any specific type of Widget, refer to the Understanding & Working With Different Types of Widgets document.
Configuring Dynamic Description
Dynamic description in Simple Card widgets allows the displayed text to change automatically based on the data value ranges, providing contextual insights at a glance.
- The card widget description can be configured to change dynamically based on the value range of data received.
Image: Sample card widget with dynamic description. Different description will be displayed for higher/lower values as configured.
Image: Sample card widget description configuration.
- The font style of descriptions in Simple Card 1 and Simple Card 2 widgets can be customized with Bold, Italic, or Underline for improved emphasis and readability.
Configuring Fonts
- The fonts and size of texts in the Card Widgets can be customized as desired.
Image: Sample card widget description configuration
Image: Sample card widget increased value size