Understanding the acquisition report in website analytics
To access your acquisition report in website analytics:
Select Website Analytics and then click Acquisition from the left pane. You will see three subcategories under the menu:
Channels: This report shows you how much traffic each marketing channel (organic, referral, paid, etc) generates, as well as which channel performs the best in terms of conversion rate.
Source/Medium: This report shows you which traffic sources generate the most visitors and their association with the different mediums. For example, Google (organic search) or Facebook (social).
Country: This report breaks down the key website stats based on the city, state, and country where the visitors originated from. For example, United states--->California--->Los Angeles.
Let's look at what detailed information you can find within each subcategory of acquisition reports and how well it can be used for your business growth. The web analytics report for each category (Acquisition and Behavior) is divided into two portions: a Performance Over Time graph, and a dimensions and metrics table.
Understanding the Performance Over Time graph
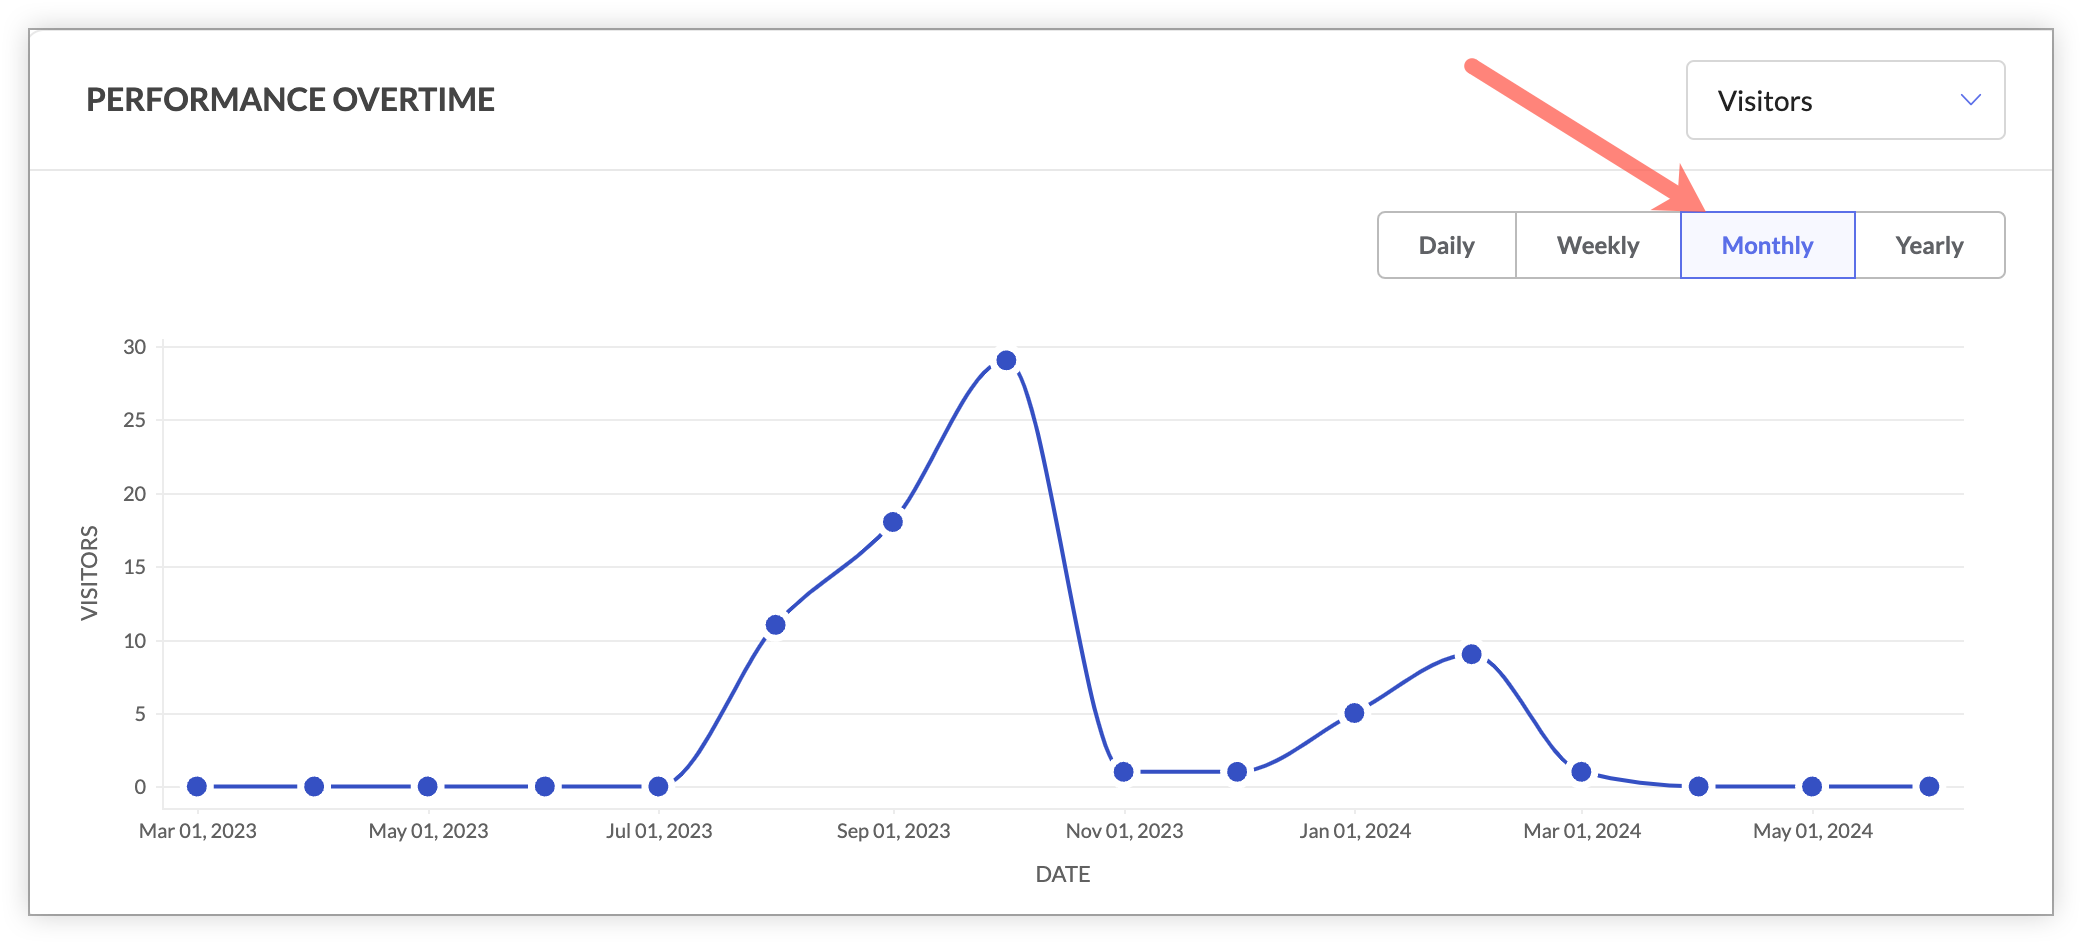
The Performance Over Time graph can be viewed under each subcategory of the acquisition reports (channels, source/medium, and country). It provides a high-level summary of all relevant metrics in one place. If you don't have enough time to dig into individual dimensions and metrics for your website, you can use this comprehensive graph to view your website's performance based on major analytical data in a single click. You can also change and compare your data points in two ways:
By different web metrics
Change and compare different website metrics, such as sessions, page views, bounce rate, average time spent on page, and exit rate, over a selected period by clicking the dropdown menu in the top-right corner of the graph (as shown below).For example, you can use this graph to track the overall percentage of sessions recorded by your marketing channels during a selected period. If you see there was a significant break in this trend, it might tell you that something brought a larger number of sessions to your website, such as a successful ad campaign, email campaign, or SEO effort. Based on this insight, you can drill down into each of your marketing channels, such as social, organic, and others, to identify which contributes to this higher number.
By duration
Change and compare the performance of your website metrics over different time ranges, including daily, weekly, or monthly, by clicking on the duration selector at the top-right side of the graph (as shown below).For example, you can compare the number of new visitors coming to your website within a specific period of time, such as the previous month and current month, to ensure you’re hitting your set goals and growing month-over-month.
 The Channels report
A channel is a combination of several traffic sources with the same medium. For example, let's say Jonah is typing in a keyphrasew "best email marketing tools" in any of the search engines like Google, Yahoo, or Bing. He sees a list of search results on the page and decides to click on one that takes him to your website's blog page on 'Popular email marketing software'. In this case, the marketing channel is grouped as 'Organic Search.' Here, the traffic sources are different, but the medium is the same, as mentioned below:
Google/organic (source/medium)
Yahoo/organic(source/medium)
Bing/organic(source/medium
With so many marketing channels out there, finding out which channels are actually driving traffic and conversions on your website is essential to promote your business successfully. Using the website analytics Channels report, you can determine the different marketing channels through which visitors come to your website, and further figure out the channel that bring the most or least traffic to your website. Tracking this information can help you to understand where your current traffic comes from, and whether your promotional efforts are producing any results.
The Channels report table shows several useful pieces of information about your website, which is broken down by different channels, like:
Which channels generate the highest traffic to your website
The bounce rate, pages/session, and average session duration for traffic coming from each channel
The goal completion rate for traffic coming from different channels. A goal completion is any action completed by the visitors on your website such as form submission, purchase completion, or ebook download.
To view your channels report:
Select Website Analytics and then click Acquisition from the left pane, then select Channels. You will see the list of channels that are sending traffic to your site such as organic search, direct, social media, referral, and others, as shown in the figure below.
Default list of channels tracked in website analytics
Direct: Visitors who come to your website by directly typing your website URL in the address bar or accessing it through a bookmark saved on your browser. An increase in visitor counts from this channel is usually an indication of brand awareness or repeat visits to your site.
For example, let's say Christmas is around the corner and Jonah is looking to buy a Christmas tree for his house. He opens up Firefox browser and starts typing “flip” in the address bar, then the browser auto-completes the URL to flipkart.com, as he'd already booked marked the shopping site. He presses enter and Flipkart’s website shows up. In this case, Jonah's visit is recorded as a direct traffic in your analytics report.
Referral: These are the visitors who come to your website by clicking on referral links placed in third party emails, other websites, or any external promotional links. If you’ve been focusing your marketing efforts on referral marketing, this is a useful metric to keep track of. This kind of traffic is commonly obtained when people or organizations write about your products or services on their own websites placing a link to your business site. So when a visitor clicks on that link, they land on the website and is counted as a referral channel.
For example, say Jonah is reading a blog article on 'healthandfiness.com.' He reads an interesting health tip that says flax seeds are a good source of fiber, then he notices a link that takes him to your shopping website for a purchase of this item. In this case, Jonah is counted as the referral traffic in your channel report.
Social: These are visitors who come to your website from social networks (or social media platforms) such as Facebook, Google +, Twitter, LinkedIn, and Pinterest. Tracking this channels data will provide you insights on how your posts are performing amongst users outside your own target audience and if they are actually converting once after they reach your site.
For example, say Jonah is scrolling through his Twitter pages and sees a video on 'cooking of pasta in 4 simple ways.' He clicks on the link in the post to see the full recipe video that loads in to your website. In this case, Jonah is counted as a visitor from a social channel in your report.Organic search: These are visitors who come to your website after searching for something on Google.com, Yahoo.com, Bing.com or other search engines. Organic search channel is considered to be the best, most sought-after ways to obtain traffic to your website since it doesn’t involve any sort of direct or paid advertisements to attract visitors towards your business. So, as long as your website is optimized for search engines, you should be able to bring in a significant amount of organic search traffic.
For example, say Jonah types in 'Headphones' in the Google search box and sees a list of websites in the search results.Hhe clicks on one of these results that takes him to your eCommerce store. In this case, the visit is counted in the organic search channel in your report.
Tip: Make sure that you’re utilizing meta descriptions and keywords in all of your website pages and content updates. The stronger your SEO, the greater likelihood that someone will find you on a search engine.
Paid search: These are visitors who come to your website via Google Ads, Bing Ads, or other paid advertisements. To be more specific, links with the medium “ppc” or “cpc” is tracked and grouped under this paid search channel. It is the exact opposite of organic search traffic, in which you pay for the ads to drive visitors to your website. Tracking this channel data can help you gain better insights on how your marketing campaign is performing individually.
 For example, say Jonah is scrolling through his Facebook page and suddenly sees a smashing ad with the cheapest flight offers to his dream destination. He clicks on the ad that leads to your travel website's offers page. In this case, the visit is counted under the Paid search channel in your report. Tip: Try adjusting your keywords or targeting options to make your ads more relevant.
Others: Visitors who don't fall in the any of the default channels discussed above are grouped in this channel. This usually happens when you use custom UTM tags in your display links.
Exporting Data from the Acquisition Tabs
- Go to the Acquisition tab.
- Set the desired date range.
- Apply segment filters if needed to refine your data.
- Click on the download icon
- Enter a file name of your choice and choose the file format. You can export the file in .csv, .tsv, .xls, or .xlsx formats.
- Choose whether to protect the file with a password.
- If you choose Yes, the exported file will be password-protected.
- Your default password is the first four characters of your email address followed by the last four digits of your user ID. Example: Email – patricia@zylker.com, User ID – 567891011; Password – patr1011
- This password is valid only for the current file.
- If you choose No, the file will be downloaded without password protection.
- Click on Export to download the data.

How can the channels report be useful to you?
Below are a few ways the channels report in website analytics can be beneficial to you:
Identify the top performing channel for your business
While you're running an online website, you might use different marketing channels, such as organic, paid, social, email, and referral, to drive traffic. However, you can't afford to chase them all, so you'll need to find out what works best for your business and what doesn't. Using the channels report in web analytics, it's easy to learn which marketing channel is outperforming all the others and which channel you should be focusing more on to maximize your business' growth, in the long run. Furthermore, the report also lets you drill down each of your channel's data based on a set of primary dimensions like traffic sources, landing pages, country and device types that are generating the highest traffic and conversions towards your site.For example, let's say you are acquiring huge number of new customers through social media compared to other channels to your website. You can consider testing and developing your social media posts as your major marketing plan to attract increased clicks, and conversions rather than concentrating much on your referral or paid advertisements.
Streamline the marketing spend for your business
Once you identify which channels or marketing campaigns are driving the most visitors to your site, the next big step would be to reduce and streamline your marketing spend. With the channels report, you can learn which marketing techniques or ad spends are worth the investing, and also where you should actually cut down unnecessary expenses in the future. This data will give you the ability to quickly focus your ad spend on the area that actually drives conversions in a short period without the need to continue testing or running ad campaigns that are not worth your time.For example, let's say you're running a Facebook ad campaign to increase sales on your ecommerce site, and from your report you see that the traffic has increased in your social channels specifically from the source Facebook in the past month. Based on this analysis, you can be sure that the budget spent on this platform has helped you in driving more traffic and conversions to your site compared to other social platforms like Twitter, Instagram, or LinkedIn.
Diagnose issues and improve your website's performance
Sometimes you might see that visitors coming from organic search channels are spending an average of two minutes on a particular page, but your social media traffic leaves the same page in just eight seconds. Have you wondered why this happens? With the help of your channels report, you can track the engagement levels of visitors (like bounce rate and average session duration) across various channels and dig out if visitors coming through certain channels face any underlying problems on a specific page. The problem may be technical (e.g. CTA button not tracking clicks) or poor user experience (e.g. there are too many pop-ups with promotional offers), or design-related (e.g. unorganized placement of content or images).For example, let's say you're running a social media ad for your ecommerce site that promises a discount coupon for first time users. However, when visitors try to click the link on your ad banner, it fails to direct them to the right landing page and hence leads to poor conversion rate. On the other hand, you see an increased number of visitors and completion rate for traffic coming through organic searches to this offer page. This type of comparison and analysis between traffic channels when drilled down by specific ads or webpages can help identify and fix problems on your site immediately.
Find out if your content strategy is doing well
Good content is a passage that helps you reach out to your customers. That's the reason you create landing pages, blogs infographics, and videos on your site. With your channels report in web analytics, you can quickly track whether your organic search traffic stands at the #01 position, and if your website is ranking high on search engines like Google, Yahoo, and Bing. This metric also shows you whether your newly published posts/pages are doing well in terms of search results, whether your SEO efforts are working fine and if people locate your useful content that encourages them to buy. Based on the analysis, you can tweak your content with relevant keywords and build a stronger content strategy in the future.For example, let's say while analyzing your organic search traffic in your channels report, you see 'google.com' ranks first in the list followed by Yahoo and Bing. However, when you break down your report based on top ranking pages (choosing primary dimension as Pages) in Google, you find that the important pages on your website like homepage and blog page don't appear in your Google organic listing. In this case, you can dig deeper to check if the keywords used on these pages are relevant to your customer's requirements, and further optimize these pages to improve their search ranking on google.
Track the performance of your online marketing campaigns
As a business, you'll be constantly looking to acquire more customers to your site. To do this, you need to create marketing campaigns that reach out to your customers. You need to be able to measure the impact of these online campaigns on your business and learn whether it meets your target audience needs. With the channels report in web analytics, you can easily track the effectiveness of individual online advertising and marketing campaigns you're running for your industry, such as PPC advertising, email marketing, and social media marketing. You can also view how much of that effort is converting into sales. Once you’ve identified the KPIs, you can make adjustments and changes to each of your digital campaigns to achieve greater targets in the future.For example, let's say you're running several email campaigns to improve the engagement of visitors on your website pages, and you want to keep track of which campaigns are really bringing in customers to your website. Do you see a lift in overall traffic to the site after your campaign? By looking at your channel's report for email, you can see which particular campaign leads to a lot of traffic and also how you need to shape your under-performing email content to garner more leads.
The Source/Medium report
The Source/Medium report in web analytics provides you metrics like:
Which sources and medium generate the most traffic to your website
Visitors and new visitors coming from each source
The bounce rate, pages/session, and average session duration for traffic coming from each source
The goal completion rate achieved for traffic coming from different sources.
So, what is the difference between source and medium in web analytics?
A source is the actual domain sending traffic to your website. Usually, this is a website like Google, Facebook, Bing, or any other site where your audience was right before they came to your site. Whereas a medium is the category of traffic source through which visitors came to your website. In simple terms, medium acts as the vehicle that brings visitors to your site through a particular source. These include organic (people searching for something on search engines), social (people clicking a link from social media site like Facebook, Twitter, etc), CPC (people clicking on paid ads running on search engines). or Referral (people clicking a link from another website).
To conclude, one source can have multiple vehicles (mediums) to get your audience to your website. For example, traffic starting from Google could come to your site via CPC (AdWords), organic (organic search), or (Newsletter) Email.
To view your source/medium report:
Select Website Analytics and then click Acquisition from the left pane, then select Source/Medium.
From the report, you can see the Source/Medium displays each combination of source and medium in the list. For example, Google/organic, nytimes.com/referral, and newsletter2014/email. Where the organic search, referral, and email are the mediums and Google, NY Times, and newsletter2014 are the traffic sources.
How can the source/medium report be useful to you?
Here are a few useful insights that the Source/Medium report can provide you in website analytics:
Identify the most profitable traffic source for your business
It's always essential to identify which channels perform the best for your company, then work from there to increase traffic and sales from the most effective sources. With the Source/Medium report in website analytics, you can track the most valuable traffic source that drive the real converting traffic to your business, then later use this data to optimize other sources that do not perform well in acquiring traffic. This report will also help provide deeper insights into which specific marketing efforts and ad campaigns are working for a particular source, or which is just a waste of time/money.For example, let's say you get the majority of traffic to your ecommerce site from organic search and the second highest volume of traffic is from paid searches. In this case, you can decide what the best strategy is to use for your business. For example, if you are more interested in building a large amount of traffic over time and establishing trust with your visitors, then a solid SEO strategy should work. If you want to increase traffic immediately, then you can lean the PPC way.
Track your social media efforts
Everything you do on social media runs behind a cause, such as building your brand awareness, promoting a new product, or generating leads to your website. However, how will you determine if these efforts are really successful, and if so, which particular social platform is the biggest contributor to your business. The best way to look at this is through your Source/Medium report. With this report, you can quickly sort which social sites are sending you the largest number of visitors to your site and which ones are underperforming. This information also helps you to analyze if you’re targeting the right audience with the right message, and further offering the right content promised to them on social media.For example, let’s say you're running an ecommerce website and you want to increase your overall website traffic through social media by 10% in one month. To find out which social platform has helped you achieve this set target, you can take a quick glance at your Source/Medium report for your social media platform. From here, you'll be able to determine which social site has received the highest traffic, engagement, and goal completion rate, then determine the ads and posts that are key contributors to your success.
Discover newly gained referral sources to your site
You can build traffic to your site many ways, but if you're getting qualified leads through a set of sources at zero cost and effort, then you wouldn't want to miss out on them. Using the referral traffic data in the Source/Medium report, you'll be able to see the list of external websites that referred traffic to your site, and also measure how well these sites are contributing to the growth of your business, free of cost. So, what is referral traffic? Technically, any domain that redirects traffic to your site is called referral traffic. This includes visitors who originate from local business listings, news mentions, and guest blogging sites. By tracking this data, you can learn where exactly your ideal buyers or customers are spending time outside your website, as well discover newly gained blog sites to publish similar content in the future.
For example, let's say the link to your ecommerce website was quoted on a blog called 'www.fashionadvice.com', which talks about the latest clothing trends. When you analyze your referral report for the previous month, you see your referral traffic percentage has increased by 15% and all of this comes from the blogging site 'Fashionadvice.' Now, you can check how this referral can best be used to establish new content marketing opportunities for your business.
Gauge your organic search traffic and SEO efforts
As a marketer, another major insight that you would want to derive from your website is whether people like your content, if it resonates with your audience's requirements, and, if so, do they stay longer to consume more content. The answer to these questions can be obtained by analyzing the organic search traffic in your Source/Medium report. We all know that organic traffic plays a major role in keeping your website healthy and prominently visible on search engines. By looking at data from organic search sources, you can analyze which pages on your website are driving enough organic traffic, then start developing enough content around them. Ultimately, if you can understand which category of posts or content style work for your industry. From there, you'll be able to quickly recognize the best way to position your site for maximum success.For example, let's say the traffic that comes to your website from Google search is high, but other organic sources like Yahoo or Bing are declining compared to the previous month. This means your SEO strategies need to improve on these search engines. This analysis can also pave the way to any hidden technical issues on your site, like your website not being indexed appropriately on Yahoo or Bing.
The Country report
If you're running a multinational business that caters to users across the globe and you want to learn where all your customer base originates from and also which locations you have a better opportunity to grow your business revenue then the Country-specific report in Web Analytics will be of great use to you. This report lets you see the performance of your website based on different geographical locations such as specific cities, states, or individual countries where the visitors originate from. In website analytics, the location of the visitor is identified based on their IP address is.
For example, let's say you own an online chain of restaurants across several countries, and have recently opened new branches in Spain and Saudi Arabia. You want to know if your business has established its presence in those new markets and if they are hitting your sales targets.
This is where the Country report in Web Analytics can help you. It can tell you which country/state/city your website is attracting the most traffic in, and further investigate the performance of your business site in new markets/regions.
The Country report in website analytics gives you a more detailed information of traffic and other important web metrics by different geographical locations, such as:
Which country/state/city generates the highest (and least) traffic to your website
The total number of visitors and new visitors coming from each location
The bounce rate, pages/session, and average session duration for traffic coming from each location
The goal completion rate achieved for traffic coming from different regions.
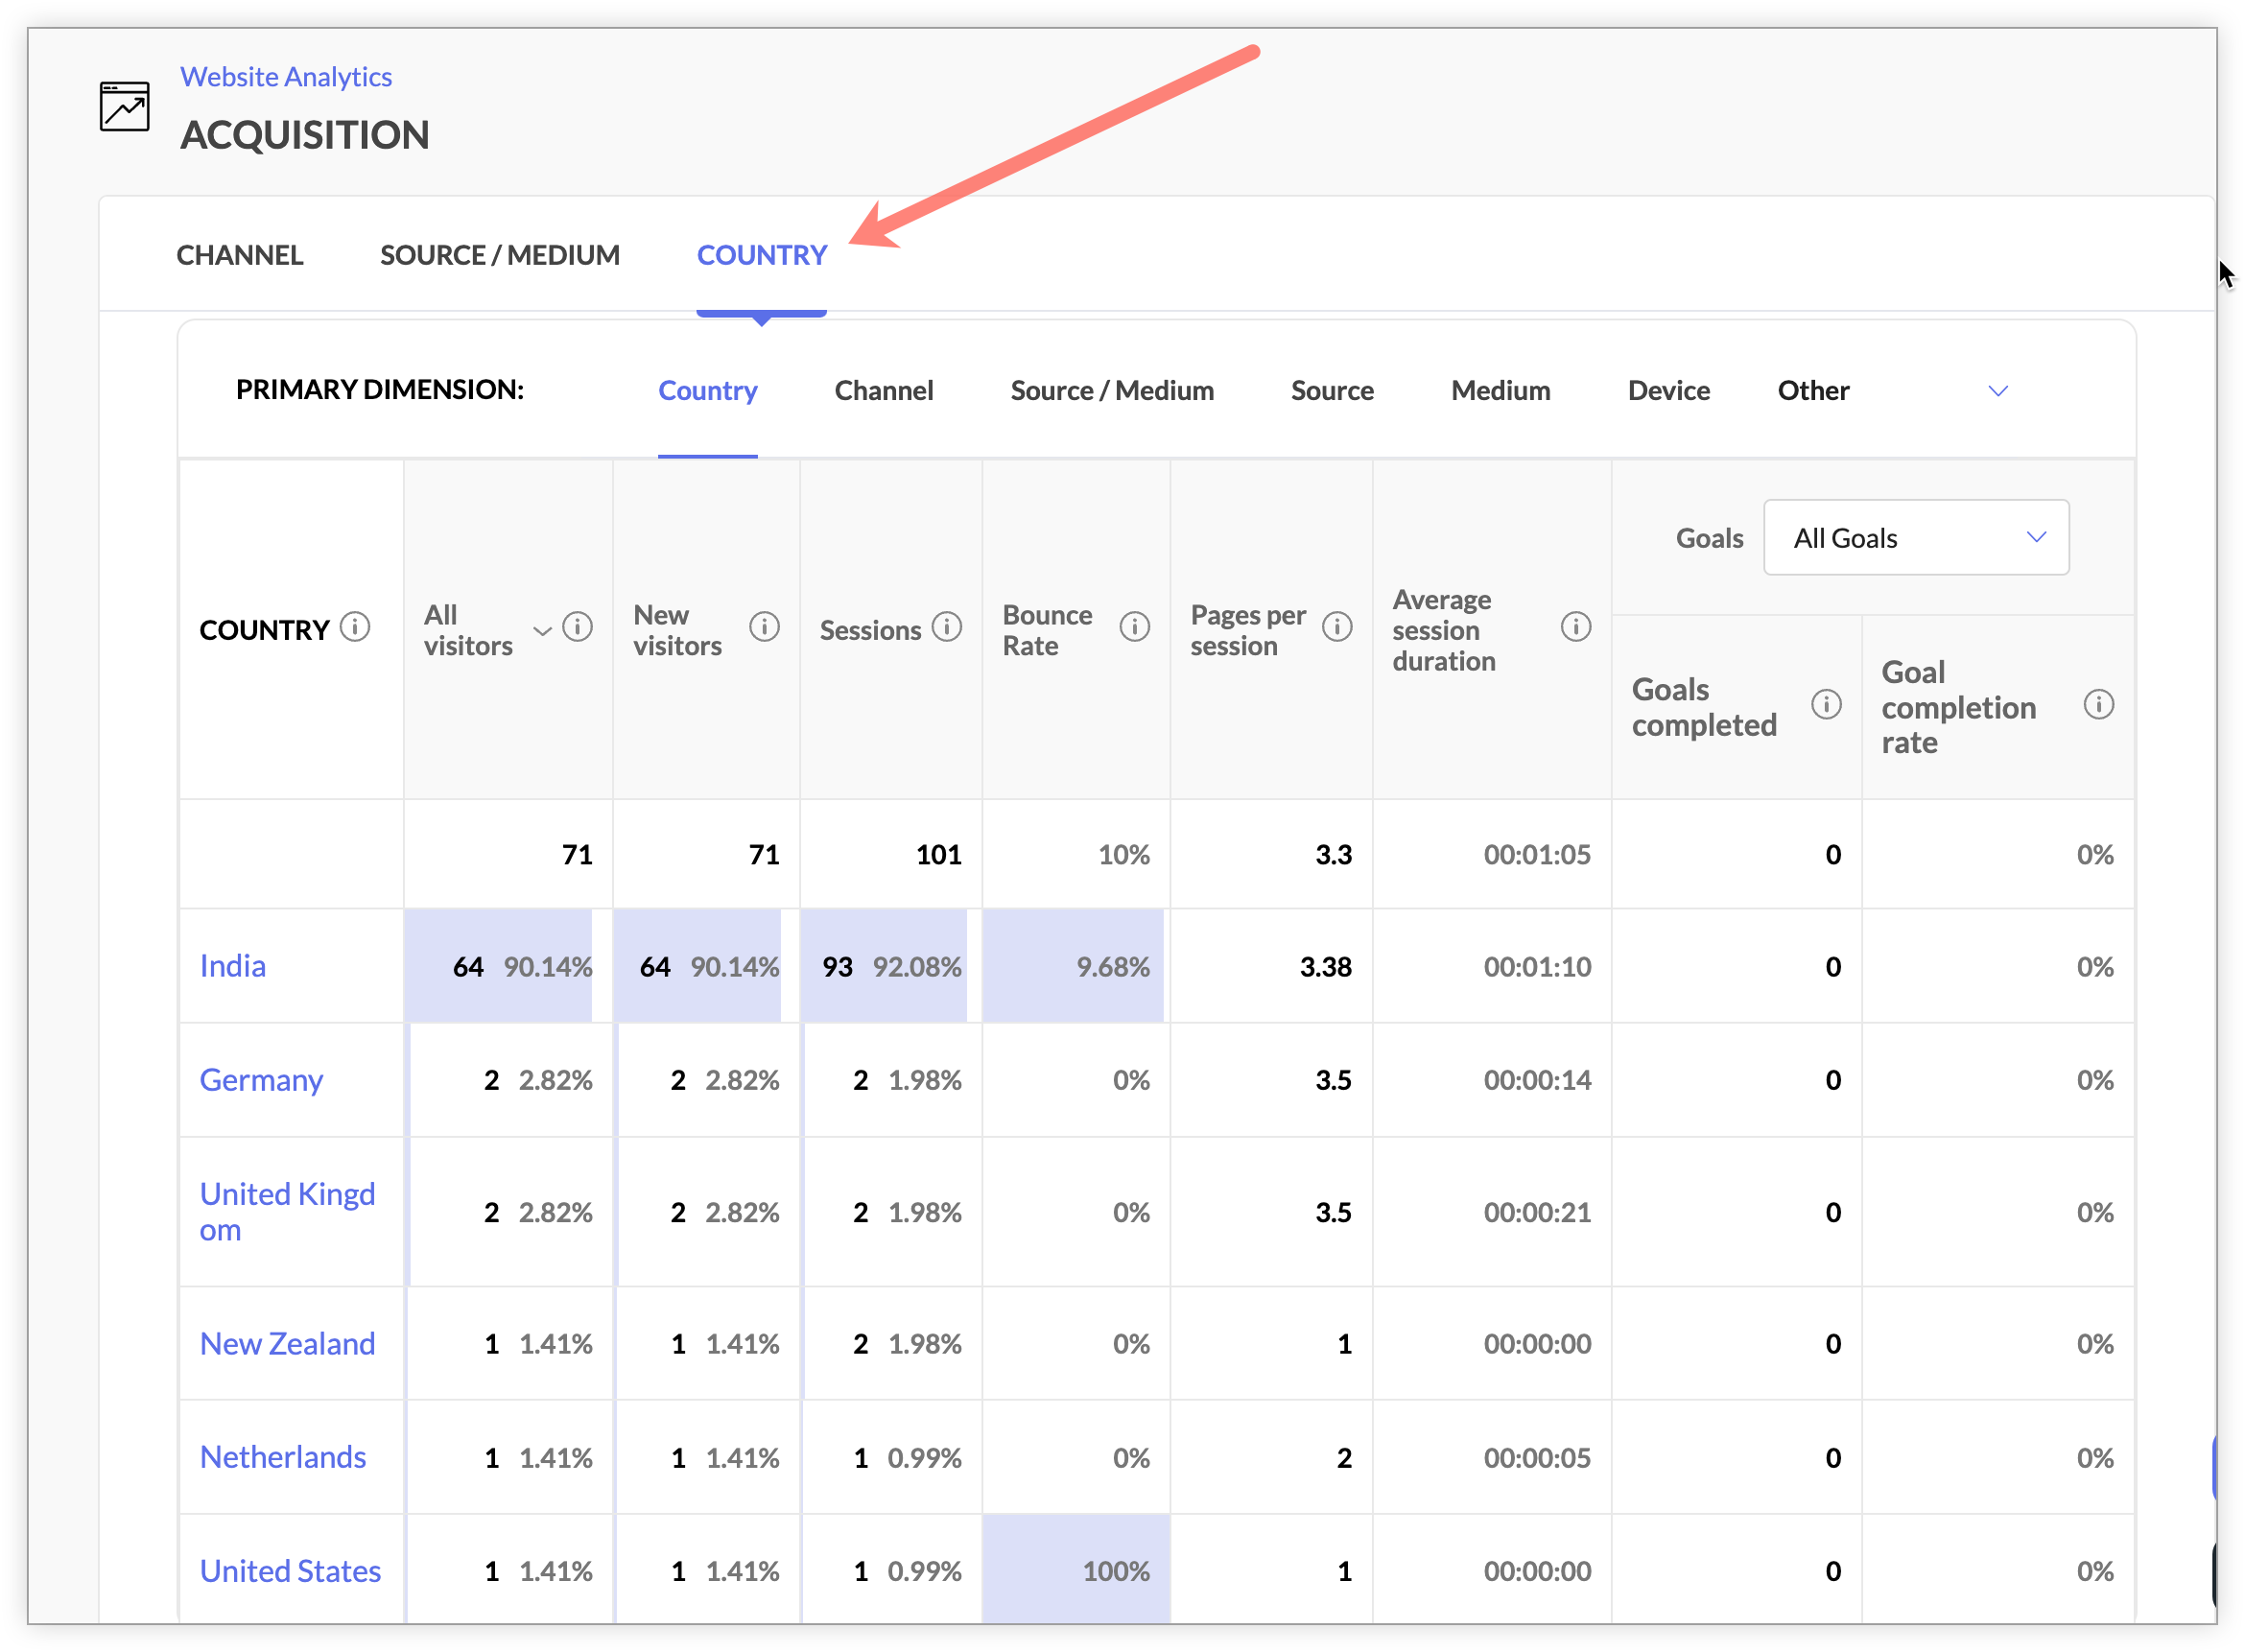
To view your country report,
Select Website Analytics and then click Acquisition from the left pane, then select Country. This report allows you to see specifically where in the world your visitors are from and determine if we’ve set up the right advertisement and promotional activities in regions where your website has gained popularity.
For example, let’s say you’re running an online travel company, and you see your display ads are very successful in Germany locations from the Country report. You see the volume of traffic and conversion obtained from this region specifically through this paid ads channel has increased by 49% month-over-month (MoM). Pretty impressive right? Such information can help you discover how your marketing efforts and advertisement campaigns are performing in different regions and contributing to your sales in these regions.
How can the country report be useful to you?
Whether you are a small local business or global business, the Country report in Web Analytics is a great metric to save money, grow your business, and uncover untapped markets. Below are a few of the best things you can discover with your Country report:
Identify which markets are good for your business
No matter how great your products and services are, if you don't target the right market for your business, then you can't serve your potential customers or identify new opportunities for development. To do this, it's necessary to understand which geographic areas your best customers are located in, and if your business growth has been consistent year over year in these regions. This data can be found under the Country report in Web Analytics. The report gives you the list of fast-growing locations for your business with a high number of visitors and completion rate. Once you find out your website's top selling market, you can direct your marketing efforts and resources to audiences in those geographic areas.For example, let's say you're running a retail business in several countries around the globe and you want to see in which locations the volume of traffic to your site is the highest. While looking at your Country report, you see visitors from Australia, United States and Canada are much attracted to your products/services, with an increased number of sessions and purchases made in this region compared to others. Using this data, you can focus on the target markets (even drill down to see top states from a country) that will be more profitable for your business, then develop a business positioning strategy in these high lead generating areas.
Understand your visitor’s interests based on locations
Let’s say you're getting a lot of traffic from a list of geographical locations, which is great, but do you know who's actually visiting your site and what their interests are? Also, is your website catering to the diverse needs of customers located in different regions of the world? Using the advanced audience segment in your country report, you can filter and track the performance of your website based on audience characteristics and interests like visitor’s demographics (age, gender, email address), pages viewed/visited, items purchased, day of the week your site was visited , products viewed, and much more. This type of segmenting your location data can be useful in understanding the level of interest your visitors from different countries have in your products/services, and further formulate your web content or marketing strategies based on their region specific needs.For example, let's say you own an ecommerce website and you're promoting 'winter wear collections' to your worldwide customers. You want to see from which locations the most interest to this product arises from and how many people viewed your product pages on winter clothing from different locations. Using the advanced audience segmentation option, you can filter your report based on the visitors who viewed this particular product page and identify promising new locations to market your product in those areas of demand/interest.Learn which country/city/state receives more new visitors
As a website owner, your main focus will be to bring more new visitors to your site. This is because they're the ones who will drive the continued success of your brand. Hence, it's not just important to track where your visitors come from, but specifically which locations are driving new visitors, so you can expand your business in these regions. With the Country report in web analytics, you can analyze which source and pages contribute to a good share of new visitors from a particular country, and further how they ultimately bounce or convert on your site. Based on this inference, you can start running email campaigns, promotional offers, and content optimization techniques for turning new visitors into customers.For example, let's say you own a SaaS website and you're planning to a setup customer meet in several locations around the world to grow your business. To do this, you want to know in which geographical regions you receive the highest number of new visitors to your site so you can plan region-specific ad campaigns for these potential users. From the Country report, you can easily derive this data and develop a better chance of converting your new visitors into your paid customers.Compare your website's performance across different locations
If you're running a business where your ideal buyers live in different location, then you’d want to know how efficient your website is for visitors from different parts of the world. Is your website meeting your audience's needs? Are they converting? If so, how do their conversion rates differ from other locations? Using your Country report, you can see how well your website is performing across different geographic locations based on metrics such as sessions, page views, time spent on pages, and goal completion rate. This information can tell you in which countries or cities your ad campaigns or webpage content has outperformed compared to others and then figure out what improvements should be made in the upcoming months to increase the popularity of your business in the low-performing areas.For example, say you own a SaaS business and you see a poor conversion rate in California compared to Texas in the US. In this case, you can think of running an ad campaign on social media sites for visitors from California that offers paid plans at a discounted price. This action can help you attract more traffic to your business and also improve the overall performance of your website in this location.Create tailored marketing messages based on visitors' location
Another great way to use your Country report in web analytics is to identify locations that send high traffic to your site, then create customized webpage contents, marketing messages, and promotional discounts for audiences based in these locations. Testing geo-targeted ad campaigns with messaging appropriate to your visitor's locality and behavior can help increase engagement that converts into additional revenue. With ecommerce in particular, there’s tons of opportunity to run promotions suited to visitors from specific locations. This type of location targeting is also a powerful way to fine tune your website content specifically for potential customers within a certain geographic radius.For example, if you're running a travel company with visitors from Chicago have a higher ecommerce conversion rate, then you can create a geo-targeted campaign for Chicago with ad text including, "Cheap flights tickets from Chicago." Alternatively, if you see visitors from Hong Kong also have an increased conversion rate, then you can customize and run ads with text including "Cheap tourist destinations from Hong Kong" for visitors in this region.