Funnel Analysis Reports
By analyzing these reports, you can quickly determine how many visitors move from one step to the next and which pages require improvements to increase conversions.
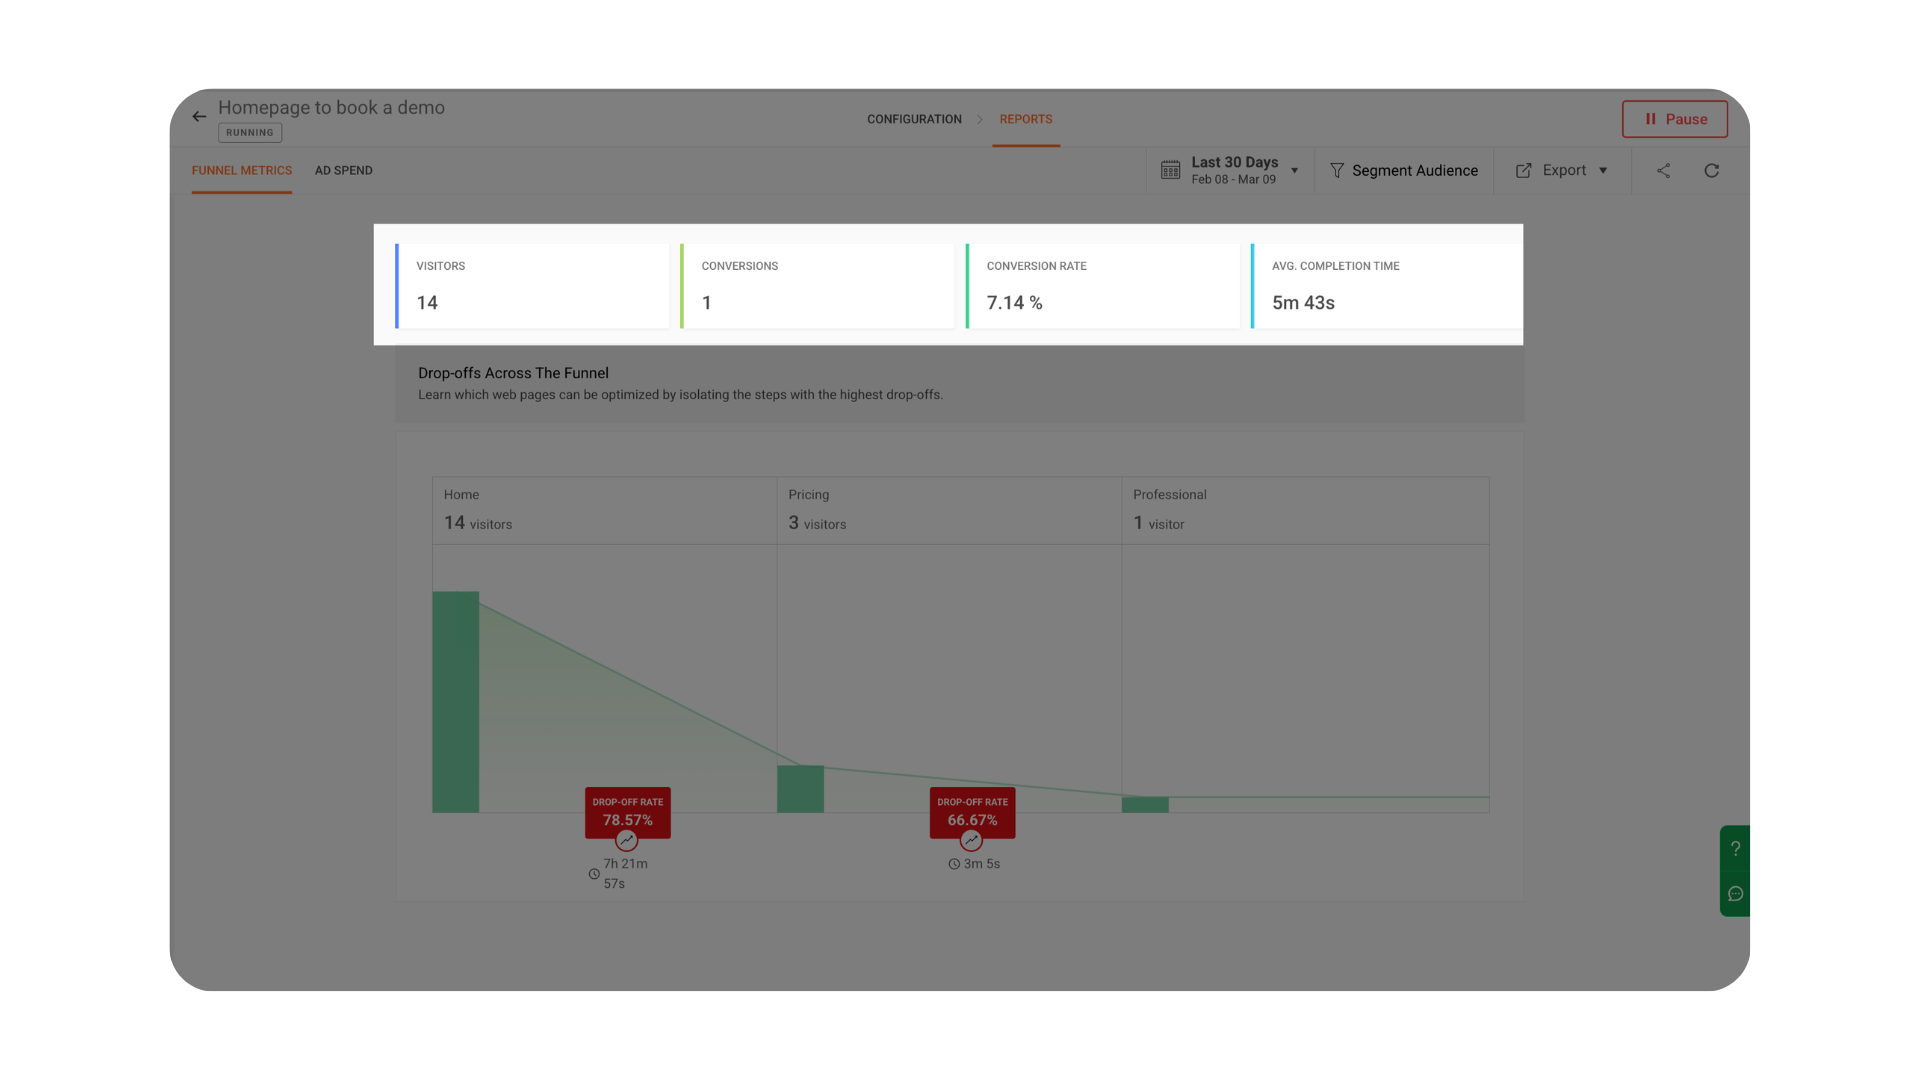
Key Metrics in Funnel Reports
 Drop-offs Across the Funnel
The Drop-offs Across the Funnel section visually represents how visitors move through each step of the funnel and where they exit the process.
For every step in the funnel, the report displays:
-
Visitors – The number of visitors who reached that particular step.
-
Drop-off Percentage – The percentage of visitors who left the funnel before moving to the next step.
-
Time Between Steps – The average time visitors take to move from one step to the next.
To make analysis easier, drop-off levels are visually highlighted using color indicators. The drop-off box between funnel steps is automatically color-coded based on the severity of the drop-off value.
These color highlights help you quickly identify the most critical stages in the funnel where visitors abandon the process, making it easier to focus on improving those steps.
High drop-off rates can often indicate issues such as:
-
Confusing page layout or navigation
-
Long or complicated forms
-
Slow page load time
-
Unclear or poorly placed call-to-action buttons
By identifying and optimizing these stages, you can reduce friction in the user journey and improve overall funnel conversions.
Additional Report Options
Smart Segments – Quickly apply predefined visitor segments available in your project, such as location-based audiences, campaign traffic, or device-specific visitors. These segments allow you to instantly analyze funnel performance for common visitor groups.
Advanced Segments – Create custom audience filters by combining multiple conditions using AND / OR logic. This allows you to build more precise segments such as visitors from a specific country using a particular device or traffic source.
Other options
Best Practices for Funnel Analysis
To get the most accurate insights from your funnel analysis, follow these best practices:
- Keep funnel steps clear and logical
Ensure each step represents a meaningful stage in the user journey. - Avoid adding too many steps
Funnels with too many stages can make analysis complex and harder to interpret. - Track key conversion actions
Focus on important milestones such as product views, form submissions, and checkout completions. - Use segmentation frequently
Analyzing funnel performance across different audience segments helps uncover deeper insights. - Monitor drop-off trends regularly
Review your funnel reports periodically to identify new friction points.