Audit log in Zoho QEngine
In a nutshell
The audit log in Zoho QEngine provides a centralized record of activities across the portal. It captures creation, update, and deletion events across all project components, from Test Cases, Test Suites, to Test Plans. Built-in filters let you narrow logs by time period, user, and activity type for focused analysis and activity review.
Availability
Super admins and admins can view audit log across the portal.
1. Overview
As projects grow and teams expand, keeping track of every change made across test cases, test plans, and other components becomes increasingly difficult. Zoho QEngine addresses this with Audit Log, a user activity history that records all changes made within a project at the portal level. Every time something is added, modified, or removed, an event is captured, giving you a reliable, traceable history of activity across the project.
Trace every change across your project
The audit log captures actions performed across categories including Users, Test Cases, Test Suites, and Test Plans. Within each category, events are recorded under three operations: Created, Updated, and Deleted. This covers everything from a test case step being modified to a webhook being configured, or a user's permissions being changed.
Narrows down to exactly what you're looking for
Active projects accumulate entries quickly, and the full user activity history across all your projects lives in one place in the portal. To get to the required records, you can filter by date, project, user, category, and operation. For example, you can narrow down by a specific team member's activity, changes within a particular category, or updates made within a given time period. Admins can use this to monitor activity across projects and ensure proper governance.
Why Audit log matters
The audit log serve several critical purposes:
- Compliance: Meet regulatory requirements and industry standards by maintaining detailed activity records.
- Accountability: Track who made changes and when, ensuring team members are responsible for their actions.
- Troubleshooting: Investigate issues by reviewing the sequence of events that led to a problem.
- Change tracking: Understand what was modified in test cases, and other components.
- Audit trails: Provide evidence of system integrity and data governance for internal or external audits.
- Version history: Maintain a complete record of all modifications to your test resources.
2. Understanding Audit log
You can access Audit Log from the Setup page of your portal.
- Navigate to Audit Log from Setup.
Select a project from the drop-down and click View.
 Note: Super admins and admins can view the audit log across all projects in the portal.
The audit log displays activities in a structured timeline view. Each event represents a recorded action, with key details available at a glance. The audit log displays the activity history of test cases by default. You can switch between categories and records using the breadcrumb, refine what you see using filters, and sort events by time.
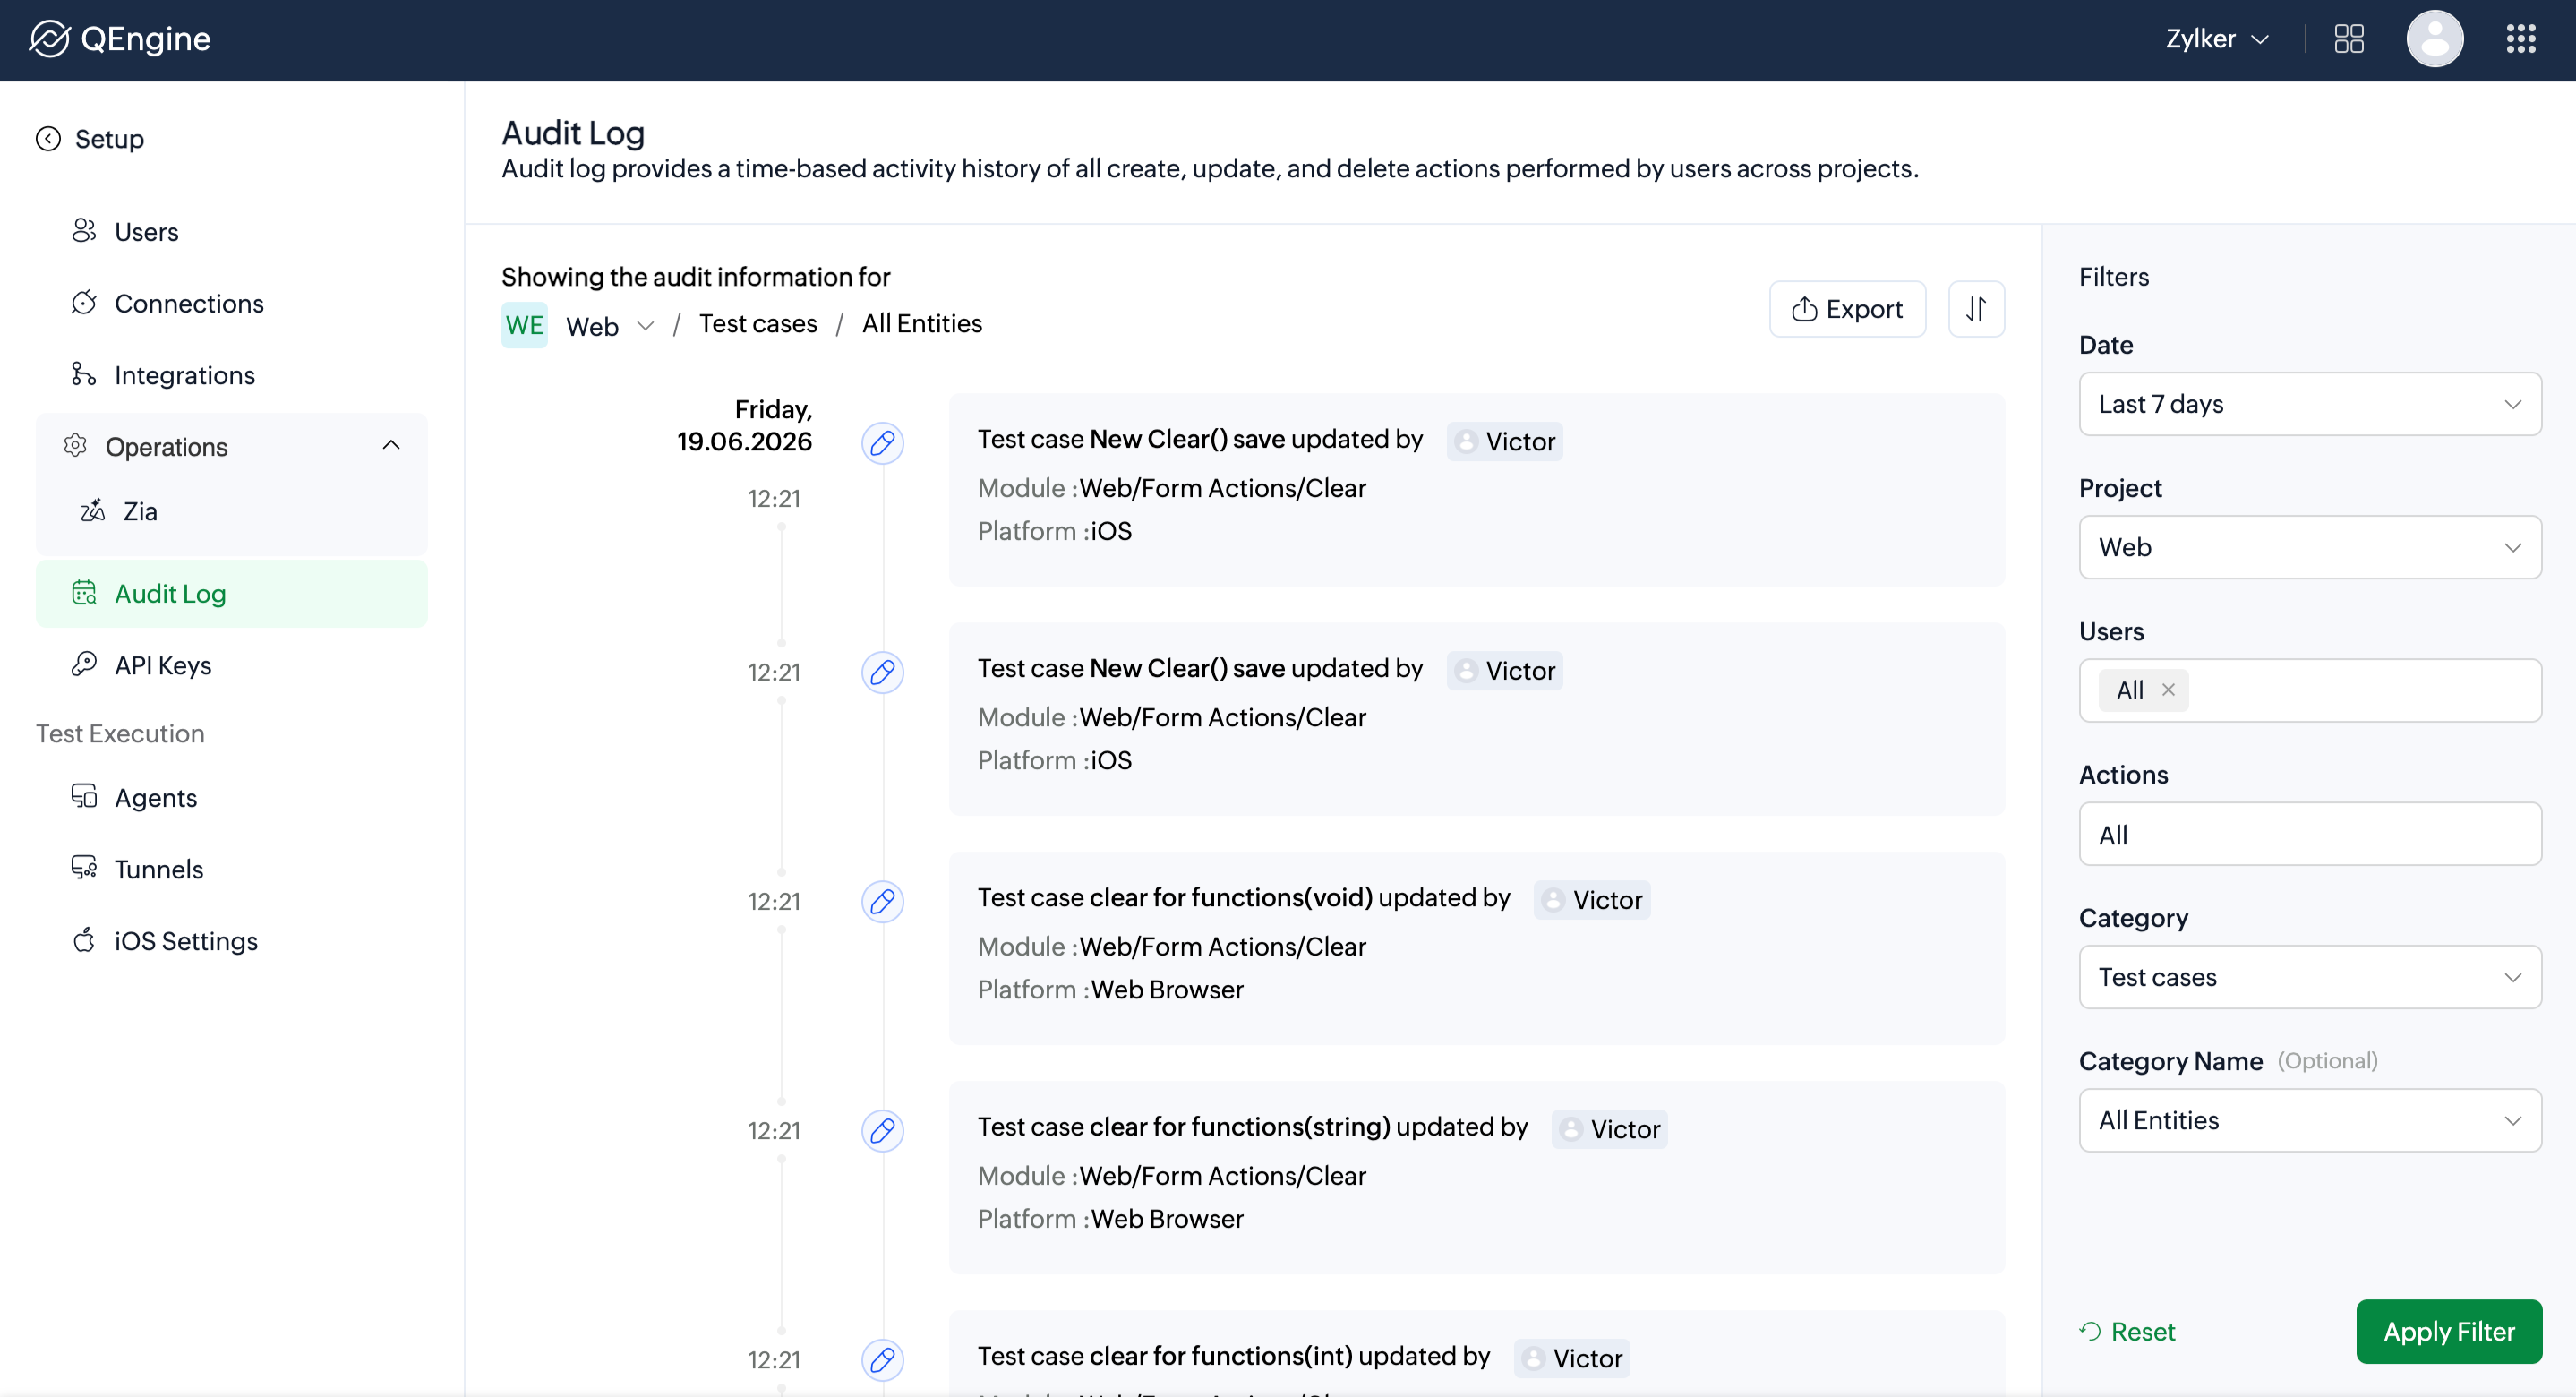
2.1 Breadcrumb Navigation
- Project - The project whose audit log is currently displayed. You can click this to switch to a different project without leaving the page.
- Category - The component of the project you are viewing activity for, such as Test Cases, Elements, or Variables.
- Record - The specific item within the selected category, such as an individual test case. Records are shown for test cases, test suites, and test plans.
2.2 Activity Feed
Logs are displayed as cards on a timeline, with the most recent activity appearing at the top by default. You can click Sort { } to switch between newest-first and oldest-first order. Each card shows the day, date, and time the event occurred, based on your portal's time zone settings. When multiple actions are performed in quick succession, cards stack in order, letting you trace the exact sequence of changes without gaps.
To view a detailed log for an activity:
- Click View Log on an activity card.
A comparison panel opens, highlighting what was added or removed between the current and the previous version of the record.
Click Done.
Note:
- If your project uses test case approval, events such as a test case being submitted for review, approved, rejected, its review request being cancelled, or test cases submitted for bulk approval from a module are recorded as audit entries.
- Test cases migrated into the project from external services like Postman also appear as distinct entries.
2.3 Filters
The right panel provides filtering options to refine the displayed logs. These filters help isolate specific activity by narrowing the dataset based on selected criteria.
- Date - Filter activity by a specific time period: Today, Yesterday, Last 7 days, Last 30 days, This week, This month, Custom
- Projects - Lists all projects you have access to. Selecting a project updates the activity history for that project.
- Users - Lists all users belonging to the selected project. You can select one or more users to view their activity history.
- Categories - Filter by a specific component of the project: Test Case, Test Suite, Test Plan, Variables, MFA, Elements, Data Source, Files, Webhooks
- Category Name (optional) - Lists the items within the selected category. Appears when Test Cases, Test Suites, or Test Plans is selected under Categories. Select a specific item to narrow the log to that record only.
- Actions - Filter by the type of change: All, Created, Updated, Deleted
To apply filters:
Select the required filters from the filter panel.
Click Apply Filter.
To revert to the default view, click Reset.
3. Export Audit log
You can export the audit log as a JSON file when you need to share activity history with stakeholders, run offline analysis, or maintain records for compliance and governance purposes.
Click Export in the top-right corner of the Audit log page.
- Select whether you want to export the full history or apply filters before exporting to narrow down the data.
Select the Protect with password checkbox and enter a password if you want to protect the exported file.
 Tip: A strong password includes uppercase and lowercase letters (A–Z, a–z), digits (0–9), and special characters.
Click Export.
Note: You can export files up to 250 MB. If you are working with a large dataset, apply filters before exporting to keep the file size manageable and the data relevant.4. Related links
5. FAQ
How long are audit logs retained?
Audit log entries are retained for 90 days. Activities older than this period will no longer be available in the log.
Can I modify or delete audit log entries?
No. Audit logs are immutable records designed to be tamper-proof for compliance purposes. They cannot be edited or deleted by any user, including administrators.
What activities are captured in the audit log?
The audit log only tracks significant change events (create, update, delete operations).
Why is my recent activity not showing in the audit log?
There may be a brief delay before a recent action appears in the audit log. If you don't see it, wait a moment and refresh the page.
How often are audit logs updated?
Audit logs are typically updated within seconds to a minute of an action being performed. If you are looking for a recent activity and don't see it, wait a moment and refresh the page.