Filter data based on date in Reports
The Reports module in Zoho Social lets you view in-depth analytics for all social media channels. You can visualize the data by defining an appropriate date range of your choice. With Social, you can visualize the performance of your Social media channels over the last year. You can also group the data in the cards by day, week, month, or quarter.
Say you want to visualize the performance of your brand's Instagram profile for the current quarter, you can specify that date range in the filter to visualize the data that you need.

Feature Availability
- Users subscribed to the Standard plan can generate the summary reports with data over the last 15 days. Professional plan lets you visualize detailed reports over the last 3 months. Premium, Agency, and Agency Plus subscribers can generate detailed reports such as audience, posts and engagement, performance, reach and impression, along with the summary and a lot more with data from the last year.
- This feature is also available for Hashtag reports.
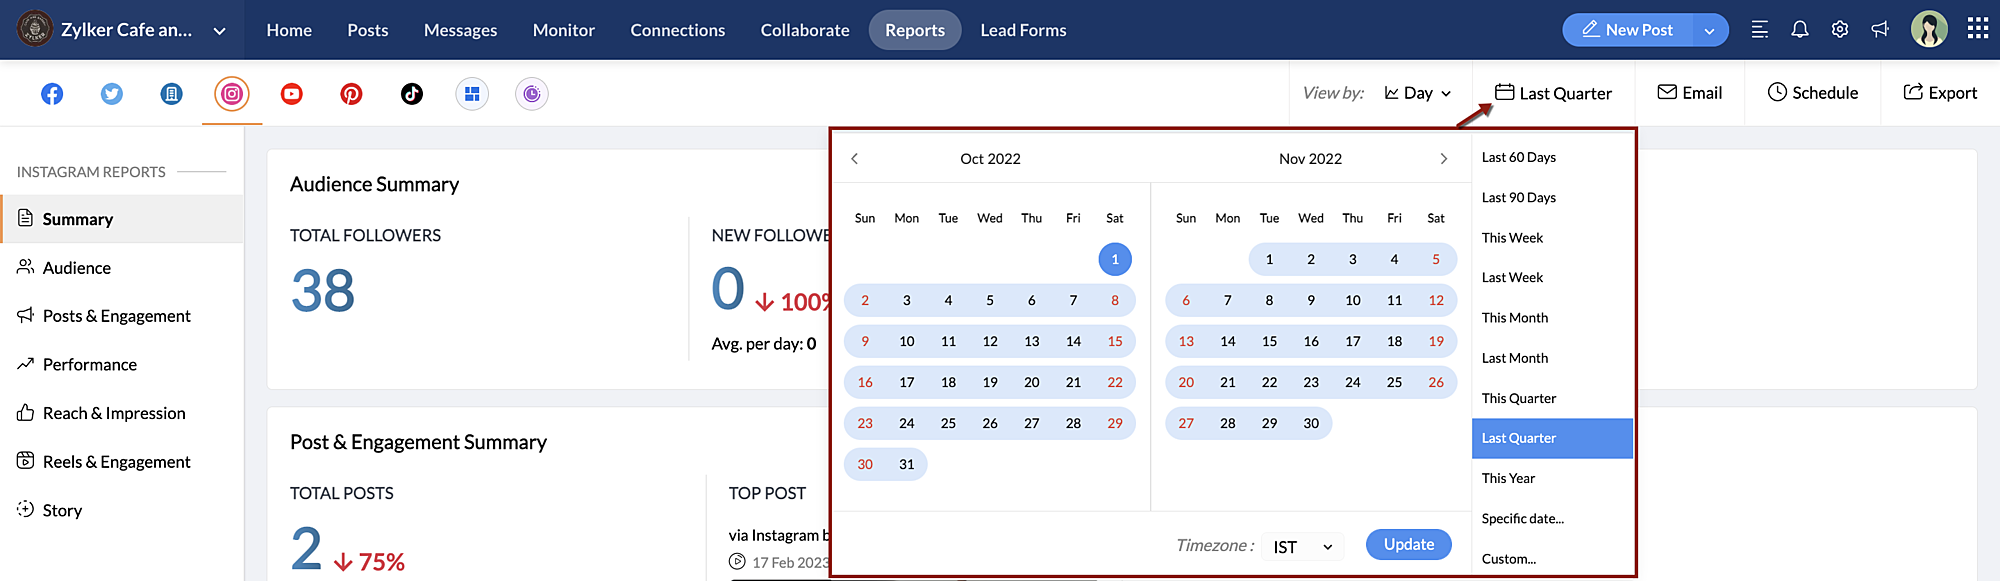
To apply date range for reports
- Go to the Reports module and select a channel from the top.
- Specify the date range and click Update.
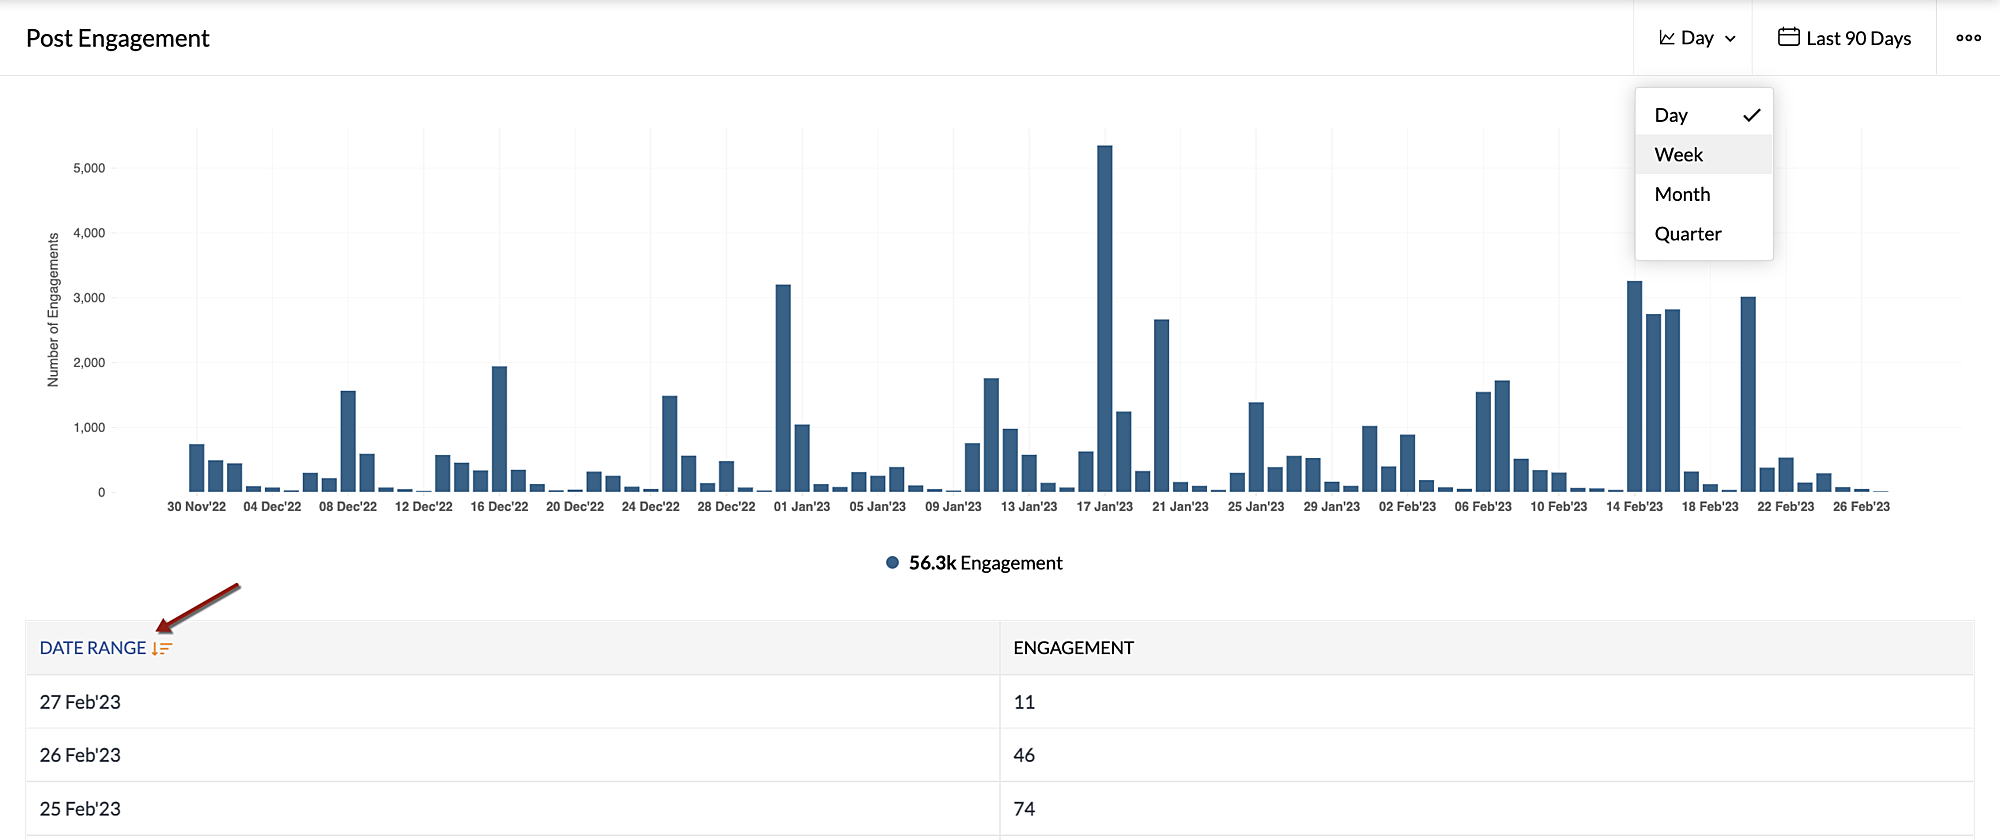
- In the View By drop-down list, select Day, Week, Month, or Quarter to group the data in all the cards accordingly.

Note
- You will be able to visualize the performance of social media channels from the time when they were connected in Zoho Social. The maximum range is 15 days for Standard, 3 months for Professional, and 1 year for Premium, Agency, and Agency Plus plans.
For example, if you are part of the Premium plan and have connected your social media channels with Zoho Social for a period of 6 months, you will be able to visualize the performance of those channels over the last 6 months only.
Group data for individual cards
A report consists of various cards which helps you visualize the performance metrics for your social media channels. Apart from grouping the data of the entire report, you can also group data of the individual cards by day, week, month, or quarter.
This option will be available for all cards and detailed view with a graph, chart, or table where the metrics are defined based on date.
Card:
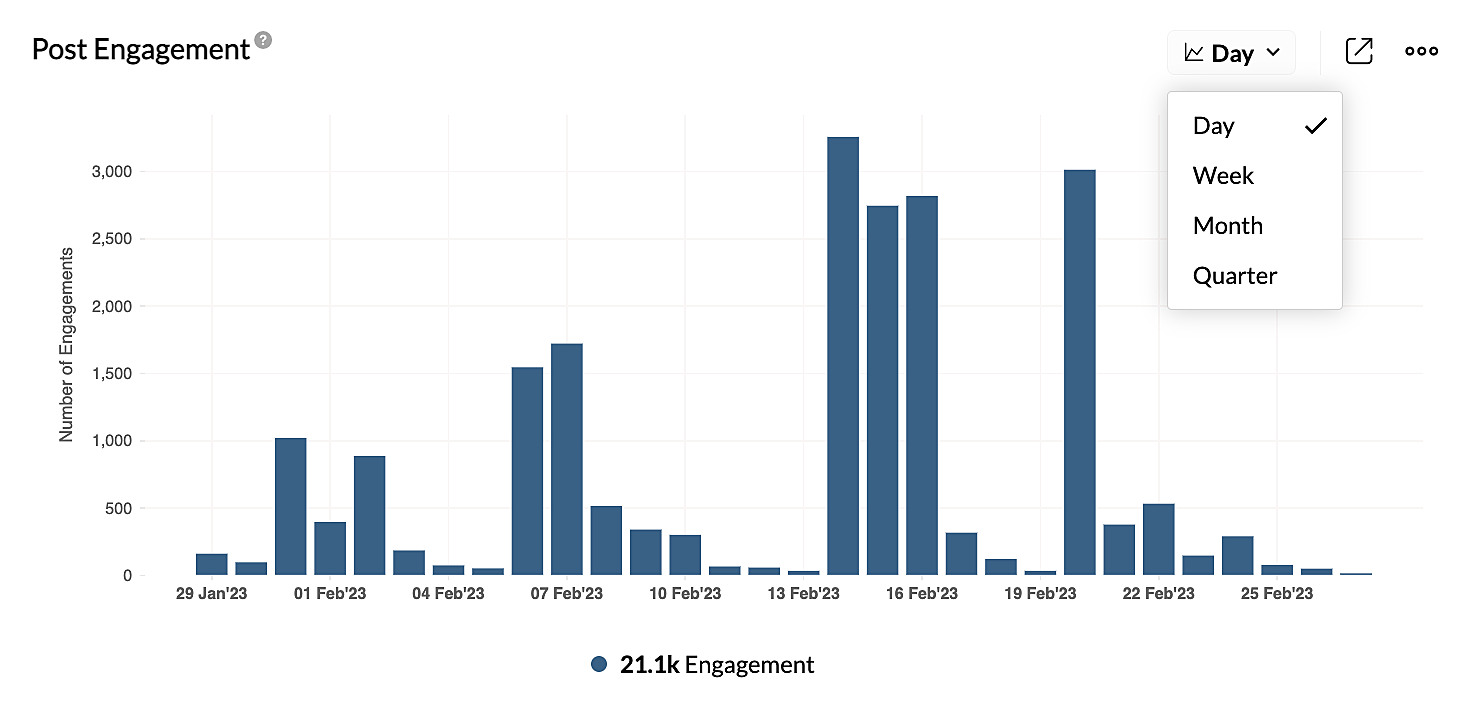
Detail View: