Analyzing community engagement
Understand what Analytics helps you measure
Open Community Settings.
Go to Analytics to get an overview of how people are participating across your community.
This section is important for a superhost, as it helps you move beyond assumptions and understand what is actually happening across users and modules. Instead of looking at activity in one area at a time, Analytics gives you a broader view of community health, participation trends, and module-level engagement.
Use this section when you want to:
- Understand how active your members are
- Identify which modules drive the most engagement
- Compare activity across community areas
- Spot high-performing or underused spaces and boards
- Identify top contributors
- Track engagement patterns over time
Across most analytics sections, you typically begin by choosing a date range and then selecting the scope or area you want to analyze. This helps superhost and hosts review performance for the entire community, for the community wall, for all spaces together, or for a specific space or module area depending on what is supported.
Analyze user participation
Open Users to understand how actively members are participating in the community.
Start by choosing the required date range at the top right.
Next, choose the area you want to analyze, such as:
- Entire Community
- Community Wall
- All Spaces
- Specific Space
Once selected, you can review:
- Statistics, which shows metrics such as New Users and Unique participants
- The Activity graph, which visualizes user activity during the selected time period
- Top contributors, which lists members from highest to lowest based on the number of posts they contributed
This helps a superhost understand whether participation is growing, which parts of the community are drawing activity, and which members are contributing the most visibly.
Use this section when you want to answer questions such as:
- Are new users actually participating after joining?
- Is activity increasing or declining over time?
- Which users are driving the most visible contribution?
Analyze feed engagement
Open Feeds to understand how actively the feed wall is being used.
After selecting the time range and area, you can review Statistics, such as:
- Number of posts
- Post likes
- Comments
- Comment likes
- Attachments
- Unique participating users
You will also see useful averages, such as:
- Average comments per post
- Average likes per post
- Average likes per comment
The Activity graph helps you visualize trends across the selected period, including:
- Posts
- Comments
- Attachments
- Post likes
- Comment likes
This helps a superhost understand not just how much content is being posted, but how much engagement that content is generating. It is especially useful for checking whether the feed is acting as an active discussion layer or simply as a passive update stream.
Analyze space activity
Open Spaces to understand how spaces are performing during the selected time period.
This section helps compare engagement across spaces and understand how the space structure is being used.
You can review:
- Statistics showing the number of new spaces created
- Most Active Spaces
- Least Active Spaces
- Recently created Spaces
These comparisons are based on the number of posts within each space.
This helps a superhost identify which spaces are thriving, which spaces may need more attention, and whether newly created spaces are actually being used. It is also useful when reviewing whether your space structure is too broad, too fragmented, or working well.
Analyze task board performance
Open Tasks to understand how task boards are being used across the community.
Choose the time range, then review a specific board or all boards together.
This section includes Statistics such as:
- New Boards
- All Tasks
- Completed Tasks
The Activity graph shows trends for:
- Tasks created
- Tasks completed
You will also see additional widgets such as:
- Most Active Boards
- Least Active Boards
- Priority Chart
- Consolidated Status
- Assigned vs Unassigned
- Recently Created Boards
This helps a superhost understand how work is being managed inside the community. It is especially useful for identifying whether boards are active, whether tasks are being completed, whether work is being assigned properly, and whether certain boards are underused.
Analyze manuals engagement
Open Manuals to understand how your knowledge content is being used.
Choose the required time range, then select how many items should appear in the widgets, with a minimum of 10 and a maximum of 30.
From here, you can understand how actively manuals are being consumed and contributed to during the selected period.
Use the available statistics and activity trends to review knowledge engagement over time and identify which manual content areas are driving the most participation.
You can also use the widgets in this section to review manuals more contextually:
- Manuals with Maximum no. of Articles helps you identify which manuals contain the highest number of articles. This is useful when you want to understand which manuals are more content-rich or have grown the most over time.
- Most Discussed Articles helps you identify which articles are generating the most discussion. This is especially useful when you want to understand what topics are drawing the most member interaction and where knowledge content is leading to active engagement.
- Recently Created Manuals helps you track the latest manuals added to the community, so you can review how quickly new knowledge areas are being introduced.
- Recently Created Articles helps you monitor the newest articles published across manuals, making it easier to keep track of fresh knowledge content being added.
Together, these widgets help a superhost evaluate not just how manuals are being used, but also how knowledge is expanding, which articles are triggering conversation, and where new documentation is being created most actively.
This makes Manuals Analytics especially useful when you want to review the health of your knowledge base, identify high-engagement content, and understand whether your manuals are growing in the right areas.
Analyze forum participation
Open Forums to understand how actively long-form discussions are happening in your community.
Start by choosing the required time range and the forum category scope you want to review. This helps you analyze all categories together or focus on a specific category when needed.
From here, the Statistics section gives you a quick summary of forum engagement during the selected period. You can review:
- Posts to see how many forum posts were created
- Likes to understand how much appreciation or lightweight engagement those posts received
- Comments to track how actively members are discussing forum topics
- Likes on comments to understand how members are responding to those discussions
- Attachments to see how often files were shared as part of forum posts
- Unique Users to understand how many different members participated in forum activity
You will also see useful averages such as:
- Avg. comments per post to understand how discussion-heavy forum posts are
- Avg. likes per post to measure how much engagement each post receives on average
- Avg. likes per comment to understand how much response comments themselves are generating
The Activity Graph helps you visualize forum engagement trends across the selected time period. It shows how forum activity changes over time for:
- Posts
- Comments
- Attachments
- Post likes
- Comment likes
This helps a superhost identify spikes, slow periods, or changes in engagement patterns instead of looking only at totals.
Below the graph, the analytics page also highlights two important widgets:
- Top Forum Authors shows the members who created the highest number of forum posts during the selected period. This helps you identify the users driving the most long-form contributions in the community.
- Most Discussed Posts shows the forum posts that received the highest number of comments. This helps you understand which discussion topics generated the most conversation and where members were most engaged.
Together, these sections help a superhost understand not just how many forum posts are being created, but also:
- How much discussion those posts are generating
- Which members are contributing most actively
- Which topics are attracting the strongest conversation
- Whether forum engagement is growing, stable, or slowing over time
This makes Forums Analytics especially useful when you want to evaluate the health of long-form discussions in the community and identify what kinds of topics are driving the most meaningful participation.
Analyze Town Hall engagement
Open Town Hall to understand how actively live sessions are performing in your community.
Start by choosing the required time range, then select how many items should appear in the widgets. This helps you control both the reporting period and how many top results you want to review at once.
From the Statistics section, you can quickly understand overall Town Hall activity during the selected period. You can review:
- Town Hall Sessions to see how many sessions were conducted
- All Questions to understand how many questions were posted across sessions
- Answers to see how many responses were added to those questions
- Unique Users to understand how many different members participated in Town Hall activity
This helps a superhost understand whether Town Halls are being used regularly, whether members are actively asking questions, and whether those questions are receiving enough responses.
The Activity Graph helps you visualize Town Hall engagement trends over time. It shows activity changes across the selected period for questions and answers.This is useful when you want to identify spikes in live participation, compare active and inactive periods, and understand when Town Hall engagement is strongest.
Below the graph, you can use the widgets to understand Town Hall activity in more detail:
- Most discussed Town Halls highlights the sessions that received the highest number of questions. This helps you identify which Town Hall sessions generated the most discussion and member participation.
- Most answered questions highlights the questions that received the highest number of answers. This helps you understand which questions attracted the strongest response from hosts, panelists, or participants.
- Most upvoted questions highlights the questions that received the highest number of upvotes. This is especially useful when you want to identify the questions that members consider most relevant, important, or worth prioritizing.
Together, these sections help a superhost understand not just how many Town Halls were conducted, but also:
- How actively members are participating in live sessions
- Which sessions generate the most discussion
- Which questions are receiving the most attention
- Whether questions are being answered adequately
- How Town Hall engagement changes over time
This makes Town Hall Analytics especially useful when you want to evaluate the effectiveness of your live engagement sessions, identify the topics that resonate most with members, and improve how future Town Halls are planned and moderated.
Export analytics data
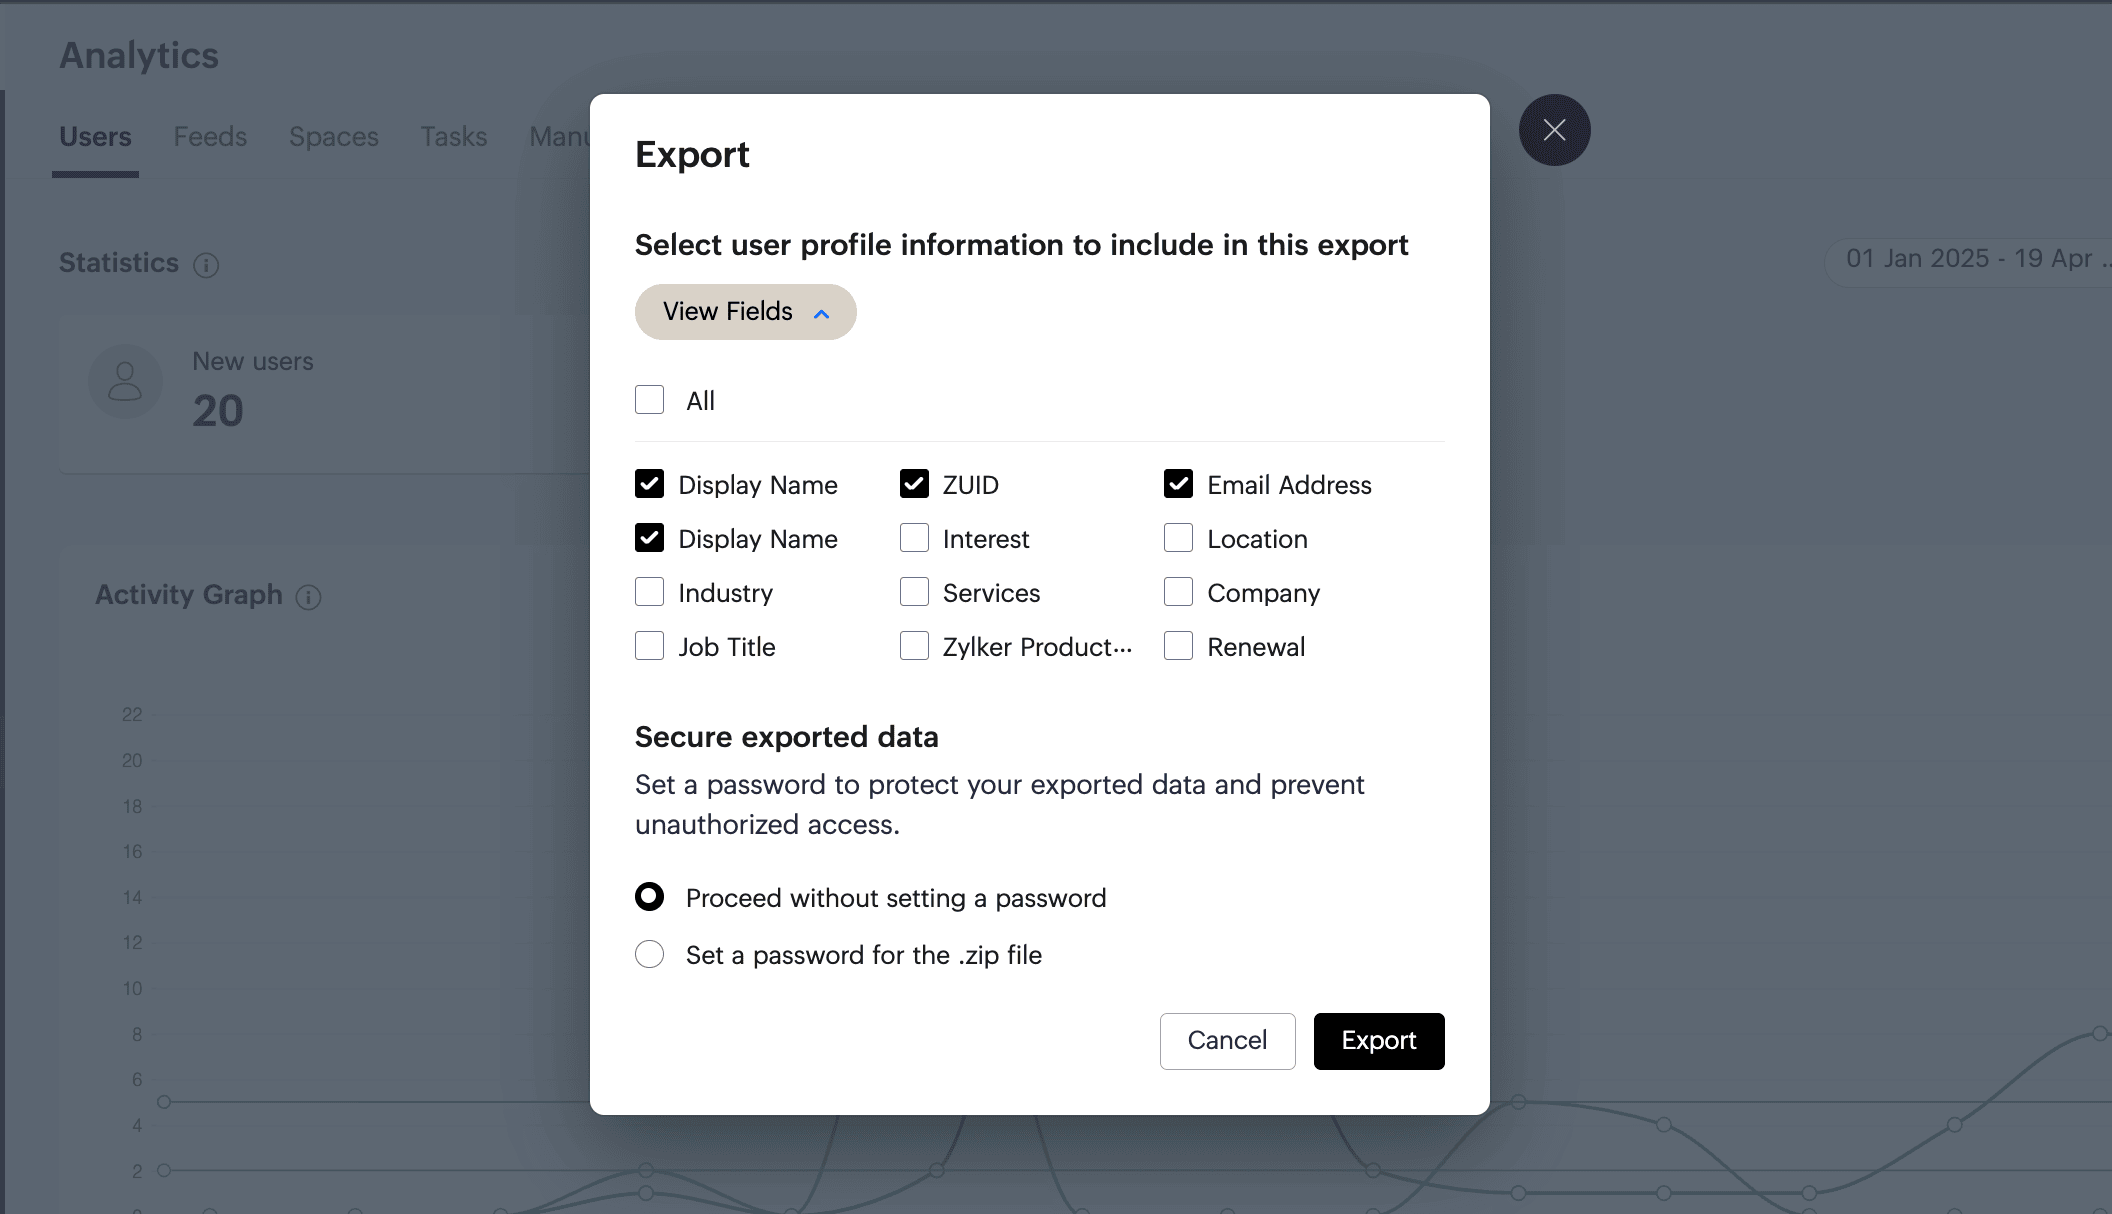
In analytics sections such as Users, Feeds, Forums, and Town Hall, you will also see Export in the top-right corner.
Use Export when you want to download the analytics data for the currently selected view.
Before exporting, first choose the required filters such as the time range and, where applicable, the relevant scope, category, or the number of items to display in the widgets. The exported data will reflect the analytics view based on the selections currently applied.
From the export flow, you can choose:
- Specific profile details
- All available profile details
You can also choose whether to export with or without a password.
This helps a superhost retain a record of engagement data outside the product for reporting, review, presentations, or internal analysis. This is especially useful when you want to:
- Review analytics offline
- Share engagement data with internal stakeholders
- Compare performance over time outside the product
- Keep reporting records for operational tracking
Next: After understanding how your community is performing across users and modules, continue with Customization to align the community experience with your brand through logo, favicon, custom styling, domain, email, templates, and signup experience.