Visualize your data with a new set of charts: Treemap, Butterfly, Sankey, and Cluster charts in Zoho CRM
Dear customers,
When it comes to analytics, it's not just about the numbers; it's about understanding the story behind them.
With that philosophy in mind, we’re excited to introduce a line of representations to the existing array of chart types in Zoho CRM: Treemap, butterfly, sankey and cluster charts. Let's go!
Treemaps
Treemap charts are used to visually represent hierarchical datasets in a rectangular layout. It aligns its parent categories as larger tiles with their sub-categories nested within them. The size of each tile is proportional to its corresponding value, making it easy to compare different segments within the hierarchy.
This is how a treemap chart looks:

These structured data representations help you understand overall performance and contributions, as well as compare participating entities at a glance.
Unlike traditional bar charts or pie charts, treemaps can be used if your datasets are large and exhibit parent-child relationships.
Here are some examples to better understand their usage:
Comparing revenue distribution between functions
A company's revenue is distributed among its functions before it gets further disbursed to its employees. Treemap charts can be used to depict this distribution and compare it between functions. As you can see below, the hierarchy can be represented as a treemap to compare it directly with other functions:

The hierarchy at the top shows just the numbers and levels, but the treemap chart represents the numbers proportionally, allowing leaders to visualize the difference in distribution.
Interpretation: As you can easily see in the treemap, sales and marketing receive the same amount of revenue, while engineering is given significantly more than the other two.
Likewise, with treemap charts, you can:
- Compare popular lead sources with lead counts is the measure and lead source being the participating entity—a classic single-grouping configuration.
- View cost savings achieved across departments. With the departments as the grouping parameters and the cost saved as the measured amount, the chart lays out all the departments as tiles in proportion, based on money saved.
- Compare ad spends across channels, where channels are the parent grouping and ad spend is the measured unit.
Butterfly
Butterfly charts are used to compare two related datasets side-by-side, resulting in a representation that looks like a butterfly or tornado.
Now, how does it differ from bar charts?
The standard bar chart can compare two entities for a given measure. Say, you are comparing the performance of Mary and Charles. The two users' data is represented using bars, and the length will denote their performances. But, when it comes to comparing their performances over a period or their contribution across different stages, a bar chart is not sufficient.


With butterfly charts, you can:
- Compare revenue between two of your branches each month. With branches being compared for sum of sales revenue, grouped by closing date.
- Compare the performance of two reps in a given quarter. Compared between two users for average of amount of deals, grouped by closing date until today.
In addition to the user-based comparison above, butterfly charts are well-suited to visualizing other types of data comparisons, like:
- Picklist-based comparisons
- Duration-based comparisons
- Aggregate-based comparisons
Business scenario
Comparing the number of deals closed for each lead sources: Duration-based comparison
You can identify the productive lead source by comparing the number of deal closures for every lead source in your organization based on their closing week.

Analyzing effective sales methodology, inbound vs. outbound: Picklist-based comparison
Businesses use both inbound and outbound lead generation strategies, and each of these methods can reap different results based on the season and occasion. By comparing inbound versus outbound each month, you can identify which works best at what time.

Analyze the amount versus the expected revenue between accounts: Aggregate-based comparison
Expected revenue is a result of a deal's progression in the sales pipeline. Comparing the amount versus their expected revenue will not only help visualize the expected revenue of participating accounts but also indicate the accounts' stage in the sales pipeline.

Sankey
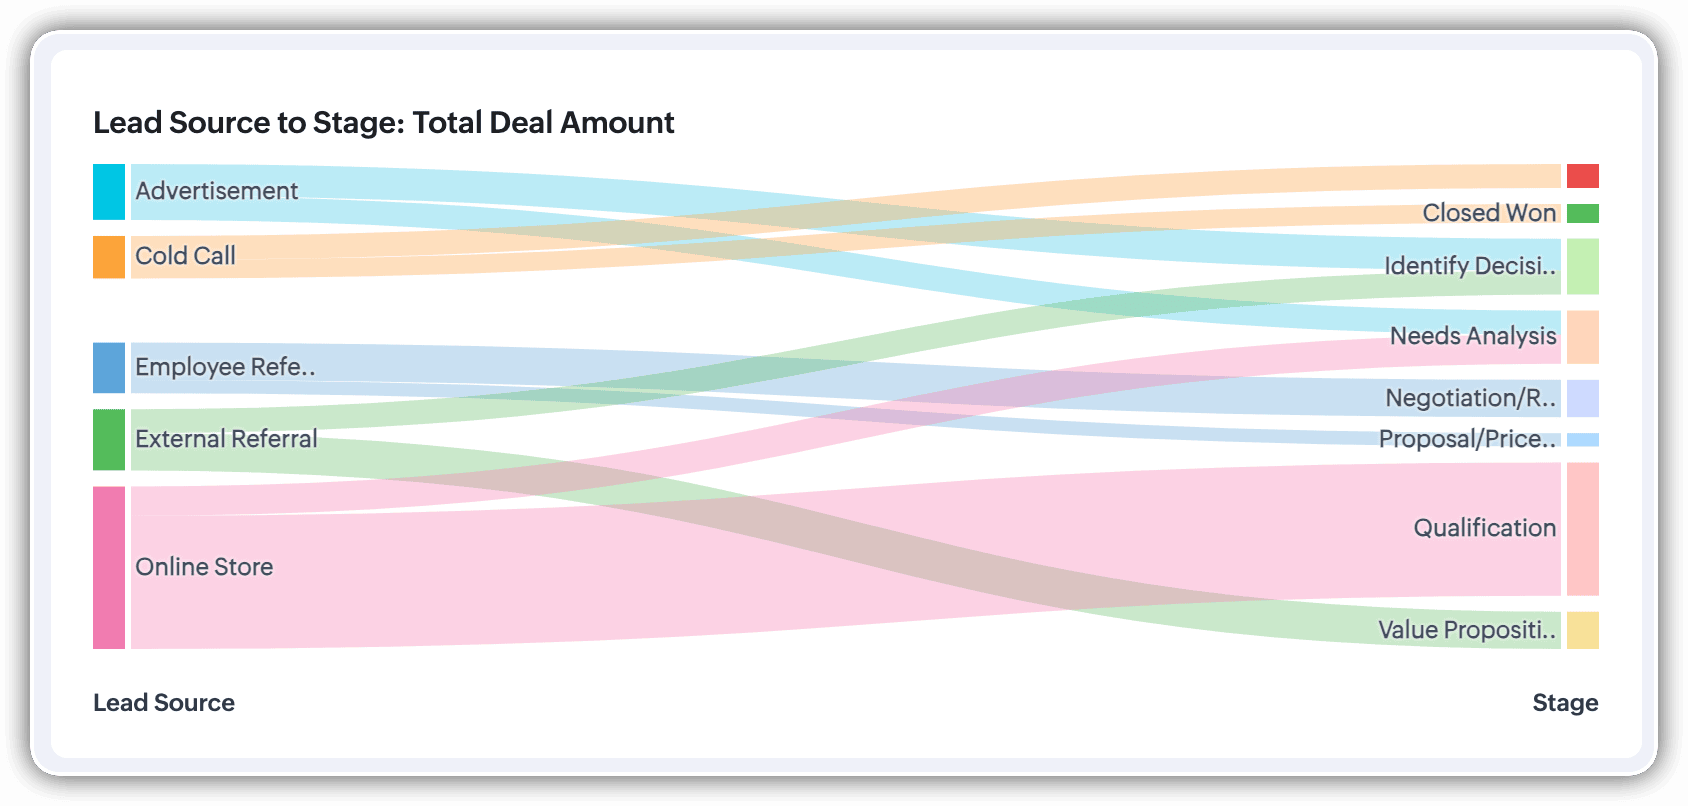
A Sankey Chart is designed to visualize the movement of data across different data groups. Unlike traditional charts—such as bar, column, pie, or donut—that mainly provide a static distribution of values, the Sankey Chart focuses on illustrating the flow between multiple segments or grouping fields. This makes it an ideal choice when you want to track how values (like lead counts, revenue, or deal statuses) move from one category to the next.

Key features
- Flow visualization: With the Sankey Chart, you can observe the movement of data between different groups.
- Multiple grouping fields: This chart works best when you have at least two grouping fields. You can go even further and add a third grouping to see an even more detailed mapping of your data flow.
- Simple configuration: The configuration for the Sankey Chart is as simple as any other chart type in Analytics.
Business scenarios:
Imagine you’re a sales manager trying to get a better handle on your team’s performance and your company’s pipeline. You want to understand not just how many deals are coming in, but also which sources are contributing the most value—and how those deals are progressing through different sales stages.
Let’s say you want to understand which lead sources are driving the most deal activity and how those deals progress through the pipeline. You can create a Sankey chart that maps the count of deals from Lead Source to Stage.

After analyzing the chart, you might notice that Online Store brings in a high volume of early-stage deals, while sources like External Referral contribute fewer deals that are more likely to reach advanced stages like Proposal or Negotiation.
This insight helps you prioritize nurturing the most profitable channels.
Sankey charts can also be helpful in other operational scenarios where understanding transitions across stages or teams is essential:
- Regional revenue distribution: Visualize how revenue flows across different regions, product categories, and their corresponding annual revenue. This helps you compare which regions contribute the most to each product line and where your high-value segments lie.
- Ticket handling flow: Visualize the flow of support tickets from their origin channel to internal departments and finally to resolution statuses. This can reveal workload imbalances or common points of delay in your support process.
Cluster
A cluster chart is similar to stacked column charts, but instead of stacking horizontally, the data is represented as vertical bars. As you create a column chart with multiple groupings, you can change the type of column chart to a cluster chart to achieve this representation.

In the above image, you can see the stacked column chart compares the number of lead conversions based on popular sources between countries. The stacks appearing on top of existing stacks ask you to calibrate the record count (y-axis) based on the previous stacks, which can lead to inaccurate interpretations. In this case, a cluster representation will paint a clearer picture of the analyses.
Other minor enhancements:
In addition to the three charts we mentioned above, we've also made the following minor changes:
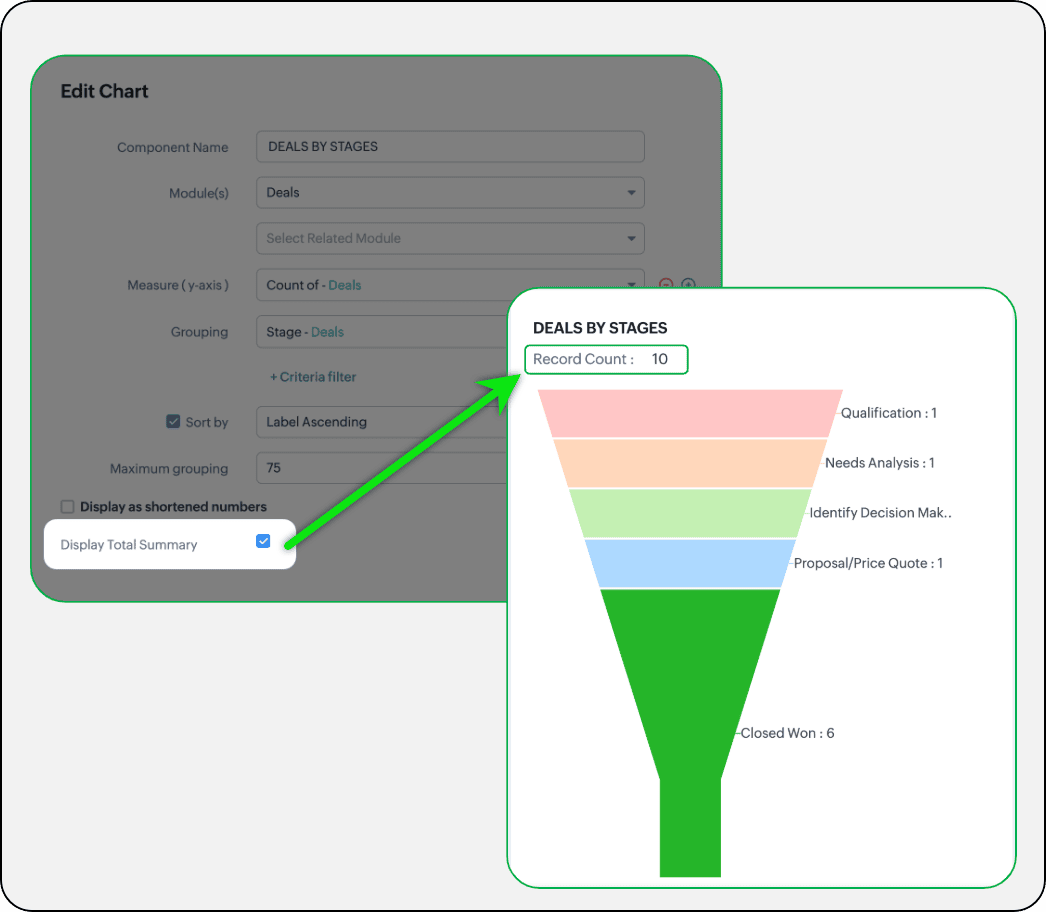
- Display total summary: Thus far, for all charts, each participating measure included labels. Now, to better understand overall contributions, a check box to display the total summary is provided under More options on the Chart Configuration page. Based on the configuration, the total revenue or the rolled-up quantities will be prominently displayed.
- Merge Y-axis: For charts that use two y-axis measurements, the intention is to view the progression of one entity against these two measures. Despite the scale, if the y-axis on the left is disproportionate to the values of the y-axis on the right, the plotted graph will result in a graphically and logically incorrect representation.
As you can see in the image below, the plot area of the sum of amount bar and the sum of expected revenue aligns close together, while, the difference between $700,000 and $40,500 is drastic, creating inaccurate interpretations.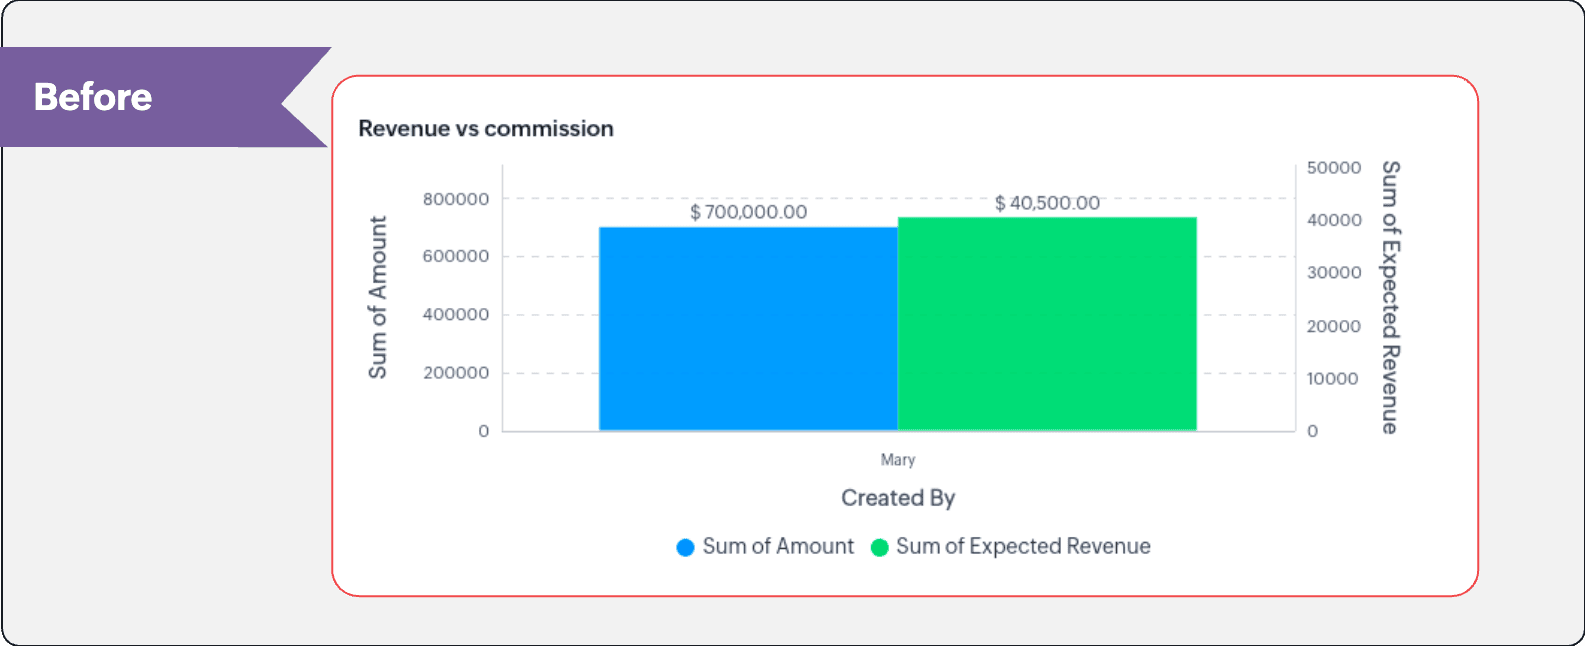
In this enhancement, we're allowing neighboring values of measures to merge so that the interpretation can be more visually accurate.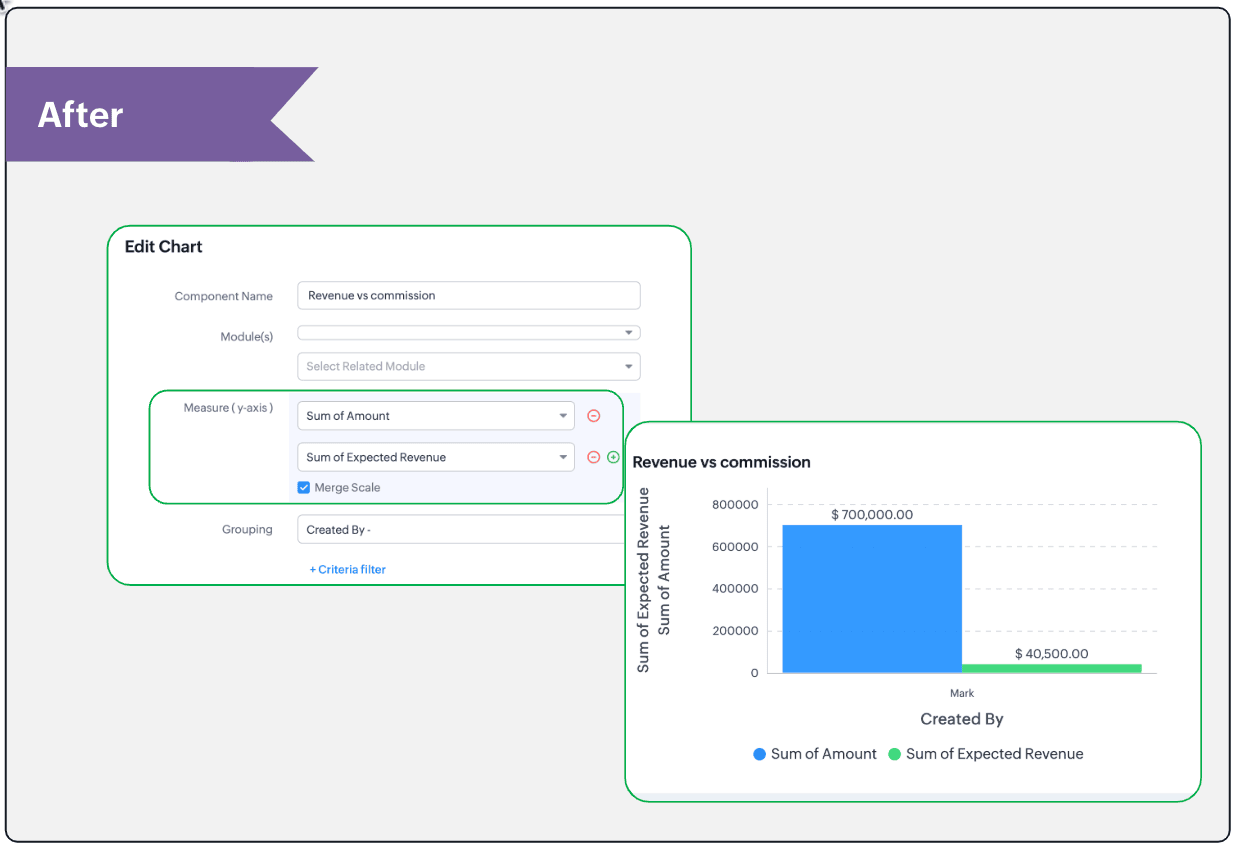
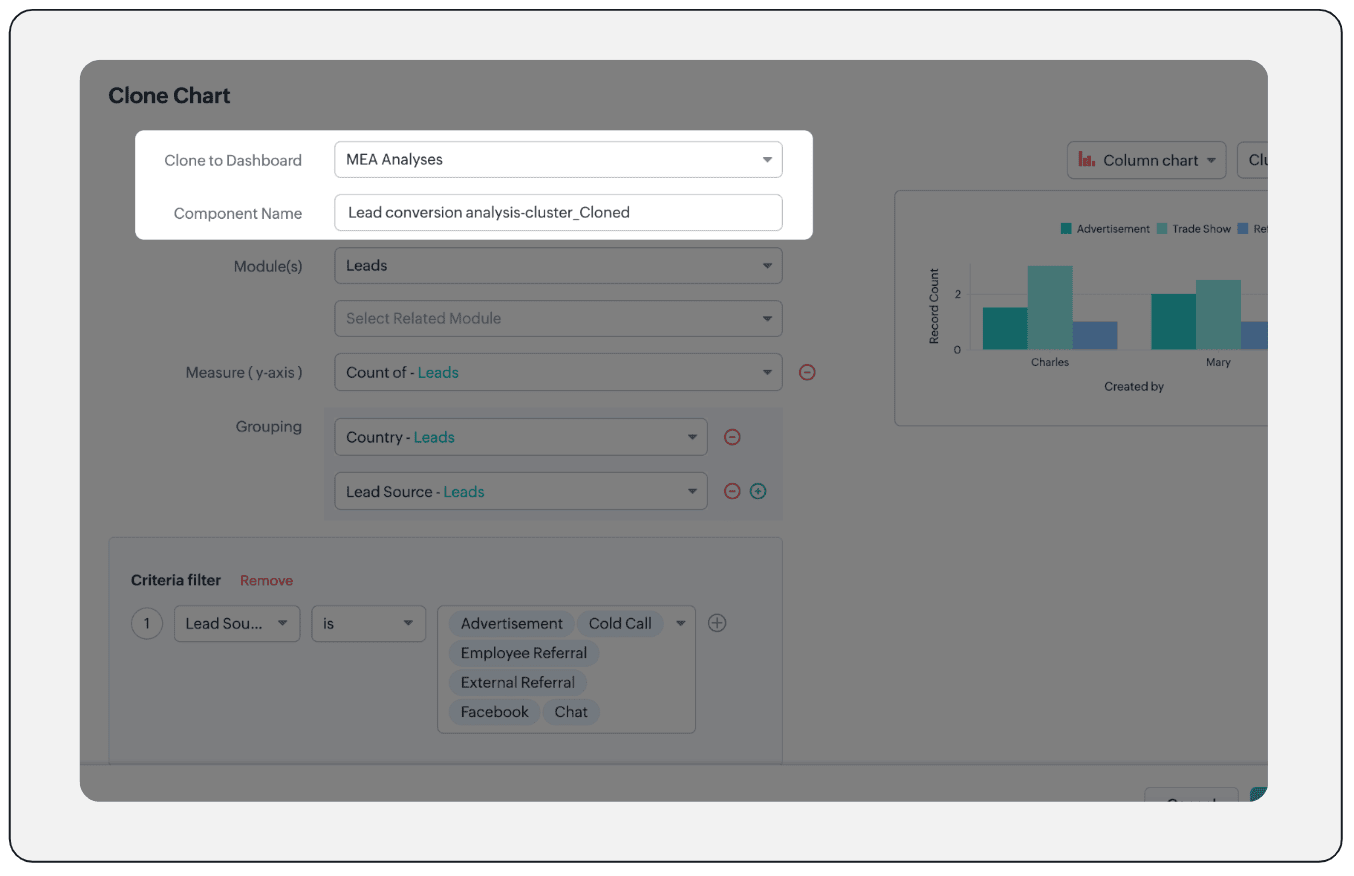
- Clone components to a different dashboard: Dashboards in Analytics serve in unique ways for various audiences—there can be separate dashboards for the sales team, marketing team, engineering team, and so on, and the chances of using the same measure for reference is common. Thus, when you clone a chart, you can now determine the target dashboard in which the cloned chart can be placed.
Resource: Help document
Thanks and have a good one!
Kind regards,
Saranya Balasubramanian
Saranya Balasubramanian
Topic Participants
Saranya Balasubramanian
Sticky Posts
Elevate your CX delivery using CommandCenter 2.0: Simplified builder; seamless orchestration
Most businesses want to create memorable customer experiences—but they often find it hard to keep them smooth, especially as they grow. To achieve a state of flow across their processes, teams often stitch together a series of automations using WorkflowPresenting ABM for Zoho CRM: Expand and retain your customers with precision
Picture this scenario: You're a growing SaaS company ready to launch a powerful business suite, and are looking to gain traction and momentum. But as a business with a tight budget, you know acquiring new customers is slow, expensive, and often deliversNimble enhancements to WhatsApp for Business integration in Zoho CRM: Enjoy context and clarity in business messaging
Dear Customers, We hope you're well! WhatsApp for business is a renowned business messaging platform that takes your business closer to your customers; it gives your business the power of personalized outreach. Using the WhatsApp for Business integrationZoho CRM: Sales Rep Professional Certification Program on Coursera
We are happy to share that we have published the Zoho Sales Representative Professional Certificate in partnership with Coursera, a leading platform for online learning and career development that offers access to courses and degrees from leading universitiesEnhancements to the formula field in Zoho CRM: Auto-refresh formulas with the "Now" function, stop formula executions based on criteria, and include formulas within formulas
Dear Customers, We hope you're well! By their nature, modern businesses rely every day on computations, whether it's to calculate the price of a product, assess ROI, evaluate the lifetime value of a customer, or even determine the age of a record. With
Recent Topics
New From Address cannot verify
I have created a new From Address, which is the support@ address for my domain, that forwards to the default support mailbox. Presumably then, the verification email that is sent, should turn up as a ticket, but it does not. How can I verify my from address so that I can use my own domain?stock
bom/bse : stock details or price =STOCK(C14;"price") not showing issue is #N/A! kindly resolve this problemZoho sheet desktop version
Hi Zoho team Where can I access desktop version of zoho sheets? It is important as web version is slow and requires one to be online all the time to do even basic work. If it is available, please guide me to the same.ZOHO SHEETS
Where can I access desktop version of zoho sheets? It is important to do basic work If it is available, please guide me to the sameOption to Empty Entire Mailbox or Folder in Zoho Mail
Hello Zoho Mail Team, How are you? We would like to request an enhancement to Zoho Mail that would allow administrators and users to quickly clear out entire folders or mailboxes, including shared mailboxes. Current Limitation: At present, Zoho Mail onlyZoho Books - France
L’équipe de Zoho France reçoit régulièrement des questions sur la conformité de ses applications de finances (Zoho Books/ Zoho Invoice) pour le marché français. Voici quelques points pour clarifier la question : Zoho Books est un logiciel de comptabilitéUsing Zoho Flow to create sales orders from won deal in Zoho CRM
Hi there, We are using Zoho Flow to create sales orders automatically when a deal is won in Zoho CRM. However, the sales order requires "Product Details" to be passed in "jsonobject", and is resulting in this error: Zoho CRM says "Invalid input for invalidIs Zoho Sheet available for Linux ?
Is Zoho Sheet available for Linux ?Bharat
ahow to disable staff selection Zoho Booking integrated to SalesIQ?
currently there is only one Consultant in my Zoho Bookings like this I integrate Zoho Bookings into Zoho SalesIQ to create a chatbot. Unfortunately, even though I only have one consultant for a consultation, the user have to pick the consultant. It willZoho Bookings No Sync with Outlook
Zoho Bookings appointments are showing on my Outlook Calendar but Outlook events are not showing on Zoho Bookings. How do I fix this?End Date in Zoho Bookings
When I give my appointments a 30 minutes time I would expect the software not to even show the End Time. But it actually makes the user pick an End Time. Did I just miss a setting?Custom confirmation message
How can I change the message that users see after they submit the booking form? I have to confirm some details before their appointment is officially "confirmed", so I want to change it where it doesn't say their appointment is "confirmed" but ratherIssue showing too many consultations in my workspace link.
Hi Team, I’ve set up two Workspaces to track meetings from different sources. So far, this has been working well, and the two Workspaces are differentiated without any issues. However, when I navigate to Consultations and share the link to my personalImproved RingCentral Integration
We’d like to request an enhancement to the current RingCentral integration with Zoho. RingCentral now automatically generates call transcripts and AI-based call summaries (AI Notes) for each call, which are extremely helpful for support and sales teams.Deluge sendmail in Zoho Desk schedule can't send email from a verified email address
I am trying to add a scheduled action with ZDesk using a Deluge function that sends a weekly email to specific ticket client contacts I've already verified the email address for use in ZDesk, but sendmail won't allow it in its "from:" clause. I've attachedZoho Learn & Zoho Connect
Hi, Is there a way to sync the knowledge base we have in Zoho Learn with the manuals section is Zoho Connect? Thanks,Addin Support in Zoho Sheet
Is there any addin support available in zoho sheet as like google marketplace to enhance productivity by connecting with other apps, providing AI data analysis, streamlining business processes, and more?Changing Corporate Structure - How Best to Adapt Current and Future Zoho Instances
My current company is Company A LLC with a dba ("doing business as" - essentially an alias) Product Name B. Basically, Company A is the legal entity and Product Name B is what customers see, but it's all one business right now. We currently have a Zohohow to add subform over sigma in the CRM
my new module don't have any subform available any way to add this from sigma or from the crmHow to Install Zoho Workdrive Desktop Sync for Ubuntu?
Hi. I am newbie to Linux / Ubuntu. I downloaded a tar.gz file from Workdrive for installing the Workdrive Desktop Sync tool. Can someone give me step by step guide on how to install this on Ubuntu? I am using Ubuntu 19.04. Regards SenthilHow to upload own video?
How can you upload your own video on your zoho website? I do not want to use another host, but i want to insert my own files. how can i do this?Support new line in CRM Multiline text field display in Zoho Deluge
Hi brainstrust, We have a Zoho CRM field which is a Muti Line (Small) field. It has data in it that has a carriage return after each line: When I pull that data in via Deluge, it displays as: I'm hoping a way I can change it from: Freehand : ENABLED ChenilleA couple of minor enhancements to Workflows
Last updated on September 17, 2024: These enhancements were initially available for early access, and we've now enabled them for all users. We are elated to announce a couple of enhancements to custom functions in our Workflows! Say hello to: "Source"Announcing new features in Trident for Windows (v.1.32.5.0)
Hello Community! Trident for Windows just got better! This update includes new features designed to improve and simplify email and calendar management—and it includes a feature you’ve been waiting for. Let’s dive into what’s new! Save emails in EML orHow to render either thumbnail_url or preview_url or preview_data_url
I get 401 Unauthorised when using these urls in the <img> tag src attribute. Guide me on how to use them!Zoho CRM Calendar | Custom Buttons
I'm working with my sales team to make our scheduling process easier for our team. We primary rely on Zoho CRM calendar to organize our events for our sales team. I was wondering if there is a way to add custom button in the Calendar view on events/meetingDefault Sorting on Related Lists
Is it possible to set the default sorting options on the related lists. For example on the Contact Details view I have related lists for activities, emails, products cases, notes etc... currently: Activities 'created date' newest first Emails - 'createdCreate Lead Button in Zoho CRM Dashboard
Right now to create Leads in the CRM our team is going into the Lead module, selecting the "Create Lead" button, then building out the lead. Is there anyway to add the "Create Lead" button or some sort of short cut to the Zoho CRM Dashboard to cut outSearching customer field
Hello, When entering a receipt, we select customer information. The customer information is synced with Zoho CRM. However, we can't find the customer information because it searches for words that begin with the entered value. It needs to search for wordsIntroducing Version-3 APIs - Explore New APIs & Enhancements
Happy to announce the release of Version 3 (V3) APIs with an easy to use interface, new APIs, and more examples to help you understand and access the APIs better. V3 APIs can be accessed through our new link, where you can explore our complete documentation,Rotate an Image in Workdrive Image Editor
I don't know if I'm just missing something, but my team needs a way to rotate images in Workdrive and save them at that new orientation. For example one of our ground crew members will take photos of job sites vertically (9:16) on his phone and uploadResume Harvester: New Enhancements for Faster Sourcing
We’re excited to share a set of enhancements to Resume Harvester that make sourcing faster and more flexible. These updates help you cut down on repetitive steps, manage auto searches more efficiently, and review candidate profiles with ease. Why we builtCliq iOS can't see shared screen
Hello, I had this morning a video call with a colleague. She is using Cliq Desktop MacOS and wanted to share her screen with me. I'm on iPad. I noticed, while she shared her screen, I could only see her video, but not the shared screen... Does Cliq iOS is able to display shared screen, or is it somewhere else to be found ? RegardsZoho CRM Tracking Google Enhanced Conversions
Can anyone @Zoho, consultants, or users help me understand if Zoho CRM is going to support Google's Enhanced Conversions? I included some information from Google below about it. We use Google Adwords for our pay per click advertising for lead generation,zoho click, and nord VPN
Unfortunately, we've been having problems with Zoho Click, where essentially the line cuts off after about a minute's worth of conversation every time we are on VPN. Is there a way we can change this within the settings so it does not cut the line offConnecting Portals from different Zoho apps
Hi, I note that Zoho has functionality for customer portals for several of the Zoho apps, like CRM, Projects, Desk etc. Is there any way to connect these portals? It would be great if we could give our customers access to a portal in which they couldBilling Management: #5 Usage Billing
After understanding the nuances of Advance Billing and Retainers, we will explore one of the booming billing models. Long ago, villagers drew water from a shared well in a small village. The well was a lifeline for the entire community. Ravi, the wellFunction #10: Update item prices automatically based on the last transaction created
In businesses, item prices are not always fixed and can fluctuate due to various factors. If you find yourself manually adjusting the item rates every time they change, we have the ideal time-saving solution for you. In today's post, we bring you customInventory Adjustments
Hi, How to transfer the material from one head to another ? Like materials purchased for manufacturing the laptop need to transfer from consumption inventory (Quantity of raw materials reduced) to destination inventory ( Quantity of Laptop increased)Next Page