Visualize your data with a new set of charts: Treemap, Butterfly, Sankey, and Cluster charts in Zoho CRM
Dear customers,
When it comes to analytics, it's not just about the numbers; it's about understanding the story behind them.
With that philosophy in mind, we’re excited to introduce a line of representations to the existing array of chart types in Zoho CRM: Treemap, butterfly, sankey and cluster charts. Let's go!
Treemaps
Treemap charts are used to visually represent hierarchical datasets in a rectangular layout. It aligns its parent categories as larger tiles with their sub-categories nested within them. The size of each tile is proportional to its corresponding value, making it easy to compare different segments within the hierarchy.
This is how a treemap chart looks:

These structured data representations help you understand overall performance and contributions, as well as compare participating entities at a glance.
Unlike traditional bar charts or pie charts, treemaps can be used if your datasets are large and exhibit parent-child relationships.
Here are some examples to better understand their usage:
Comparing revenue distribution between functions
A company's revenue is distributed among its functions before it gets further disbursed to its employees. Treemap charts can be used to depict this distribution and compare it between functions. As you can see below, the hierarchy can be represented as a treemap to compare it directly with other functions:

The hierarchy at the top shows just the numbers and levels, but the treemap chart represents the numbers proportionally, allowing leaders to visualize the difference in distribution.
Interpretation: As you can easily see in the treemap, sales and marketing receive the same amount of revenue, while engineering is given significantly more than the other two.
Likewise, with treemap charts, you can:
- Compare popular lead sources with lead counts is the measure and lead source being the participating entity—a classic single-grouping configuration.
- View cost savings achieved across departments. With the departments as the grouping parameters and the cost saved as the measured amount, the chart lays out all the departments as tiles in proportion, based on money saved.
- Compare ad spends across channels, where channels are the parent grouping and ad spend is the measured unit.
Butterfly
Butterfly charts are used to compare two related datasets side-by-side, resulting in a representation that looks like a butterfly or tornado.
Now, how does it differ from bar charts?
The standard bar chart can compare two entities for a given measure. Say, you are comparing the performance of Mary and Charles. The two users' data is represented using bars, and the length will denote their performances. But, when it comes to comparing their performances over a period or their contribution across different stages, a bar chart is not sufficient.


With butterfly charts, you can:
- Compare revenue between two of your branches each month. With branches being compared for sum of sales revenue, grouped by closing date.
- Compare the performance of two reps in a given quarter. Compared between two users for average of amount of deals, grouped by closing date until today.
In addition to the user-based comparison above, butterfly charts are well-suited to visualizing other types of data comparisons, like:
- Picklist-based comparisons
- Duration-based comparisons
- Aggregate-based comparisons
Business scenario
Comparing the number of deals closed for each lead sources: Duration-based comparison
You can identify the productive lead source by comparing the number of deal closures for every lead source in your organization based on their closing week.

Analyzing effective sales methodology, inbound vs. outbound: Picklist-based comparison
Businesses use both inbound and outbound lead generation strategies, and each of these methods can reap different results based on the season and occasion. By comparing inbound versus outbound each month, you can identify which works best at what time.

Analyze the amount versus the expected revenue between accounts: Aggregate-based comparison
Expected revenue is a result of a deal's progression in the sales pipeline. Comparing the amount versus their expected revenue will not only help visualize the expected revenue of participating accounts but also indicate the accounts' stage in the sales pipeline.

Sankey
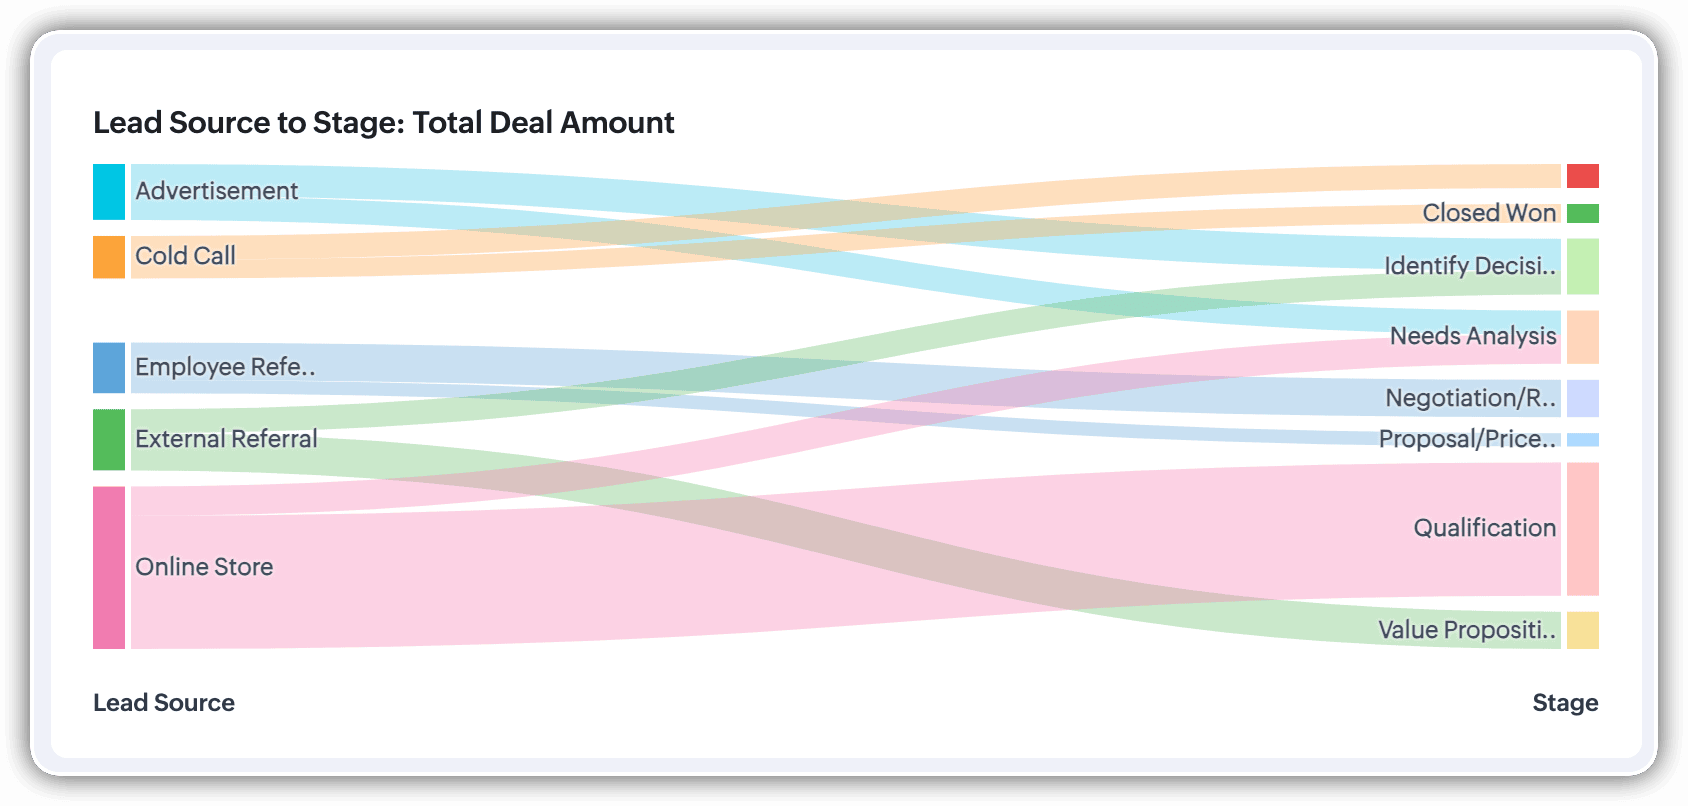
A Sankey Chart is designed to visualize the movement of data across different data groups. Unlike traditional charts—such as bar, column, pie, or donut—that mainly provide a static distribution of values, the Sankey Chart focuses on illustrating the flow between multiple segments or grouping fields. This makes it an ideal choice when you want to track how values (like lead counts, revenue, or deal statuses) move from one category to the next.

Key features
- Flow visualization: With the Sankey Chart, you can observe the movement of data between different groups.
- Multiple grouping fields: This chart works best when you have at least two grouping fields. You can go even further and add a third grouping to see an even more detailed mapping of your data flow.
- Simple configuration: The configuration for the Sankey Chart is as simple as any other chart type in Analytics.
Business scenarios:
Imagine you’re a sales manager trying to get a better handle on your team’s performance and your company’s pipeline. You want to understand not just how many deals are coming in, but also which sources are contributing the most value—and how those deals are progressing through different sales stages.
Let’s say you want to understand which lead sources are driving the most deal activity and how those deals progress through the pipeline. You can create a Sankey chart that maps the count of deals from Lead Source to Stage.

After analyzing the chart, you might notice that Online Store brings in a high volume of early-stage deals, while sources like External Referral contribute fewer deals that are more likely to reach advanced stages like Proposal or Negotiation.
This insight helps you prioritize nurturing the most profitable channels.
Sankey charts can also be helpful in other operational scenarios where understanding transitions across stages or teams is essential:
- Regional revenue distribution: Visualize how revenue flows across different regions, product categories, and their corresponding annual revenue. This helps you compare which regions contribute the most to each product line and where your high-value segments lie.
- Ticket handling flow: Visualize the flow of support tickets from their origin channel to internal departments and finally to resolution statuses. This can reveal workload imbalances or common points of delay in your support process.
Cluster
A cluster chart is similar to stacked column charts, but instead of stacking horizontally, the data is represented as vertical bars. As you create a column chart with multiple groupings, you can change the type of column chart to a cluster chart to achieve this representation.

In the above image, you can see the stacked column chart compares the number of lead conversions based on popular sources between countries. The stacks appearing on top of existing stacks ask you to calibrate the record count (y-axis) based on the previous stacks, which can lead to inaccurate interpretations. In this case, a cluster representation will paint a clearer picture of the analyses.
Other minor enhancements:
In addition to the three charts we mentioned above, we've also made the following minor changes:
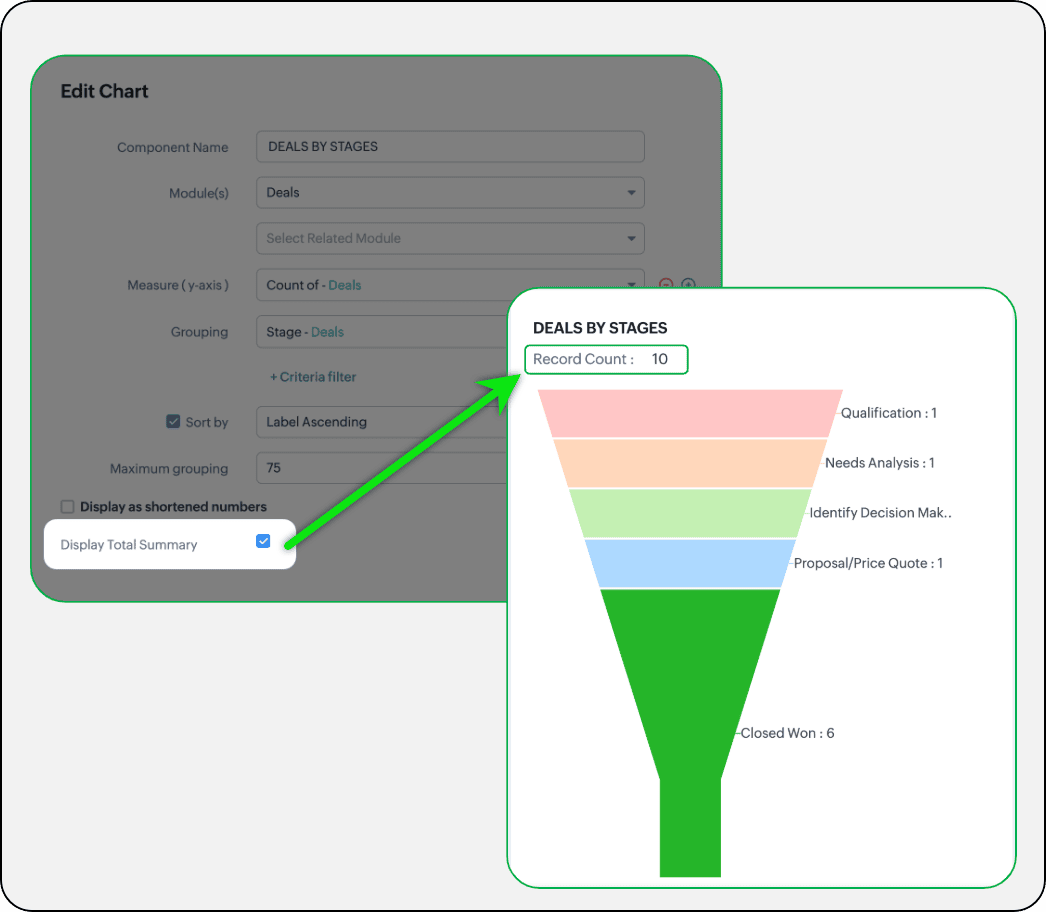
- Display total summary: Thus far, for all charts, each participating measure included labels. Now, to better understand overall contributions, a check box to display the total summary is provided under More options on the Chart Configuration page. Based on the configuration, the total revenue or the rolled-up quantities will be prominently displayed.
- Merge Y-axis: For charts that use two y-axis measurements, the intention is to view the progression of one entity against these two measures. Despite the scale, if the y-axis on the left is disproportionate to the values of the y-axis on the right, the plotted graph will result in a graphically and logically incorrect representation.
As you can see in the image below, the plot area of the sum of amount bar and the sum of expected revenue aligns close together, while, the difference between $700,000 and $40,500 is drastic, creating inaccurate interpretations.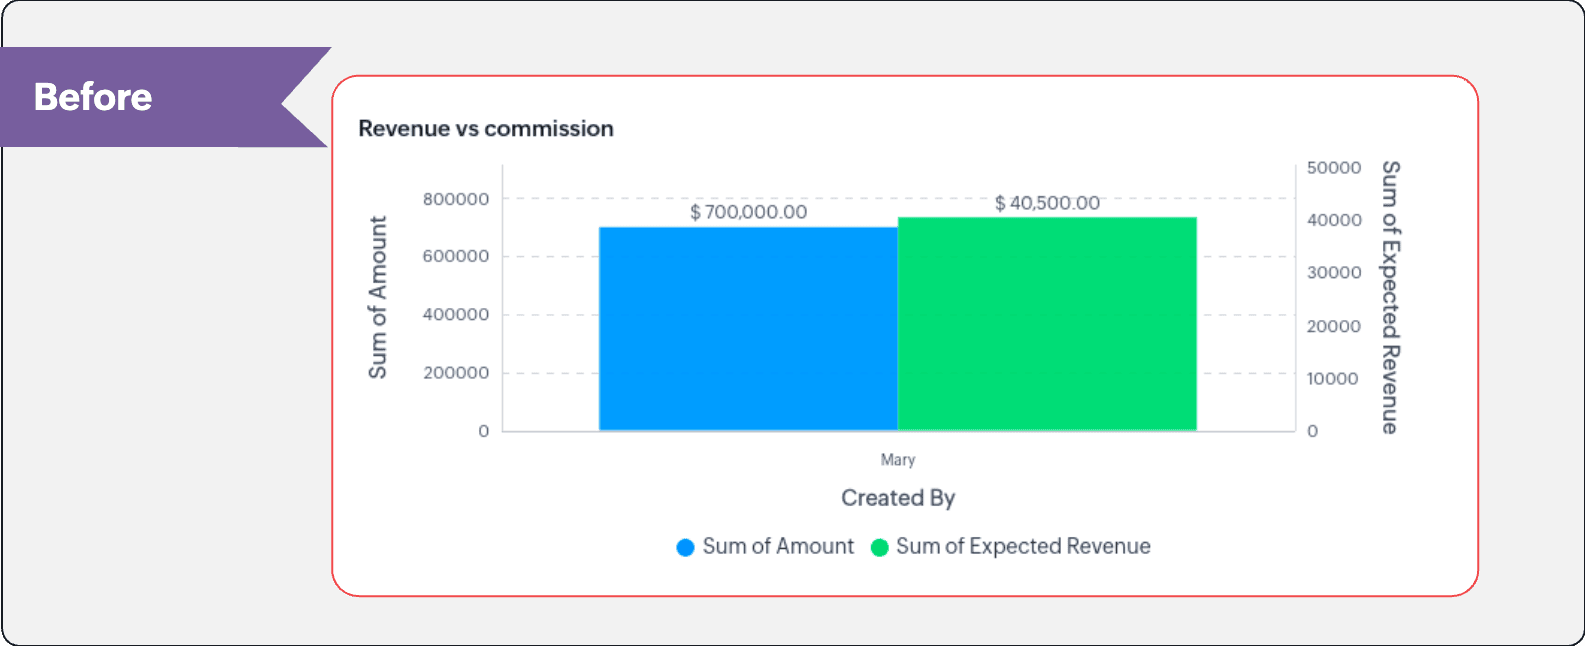
In this enhancement, we're allowing neighboring values of measures to merge so that the interpretation can be more visually accurate.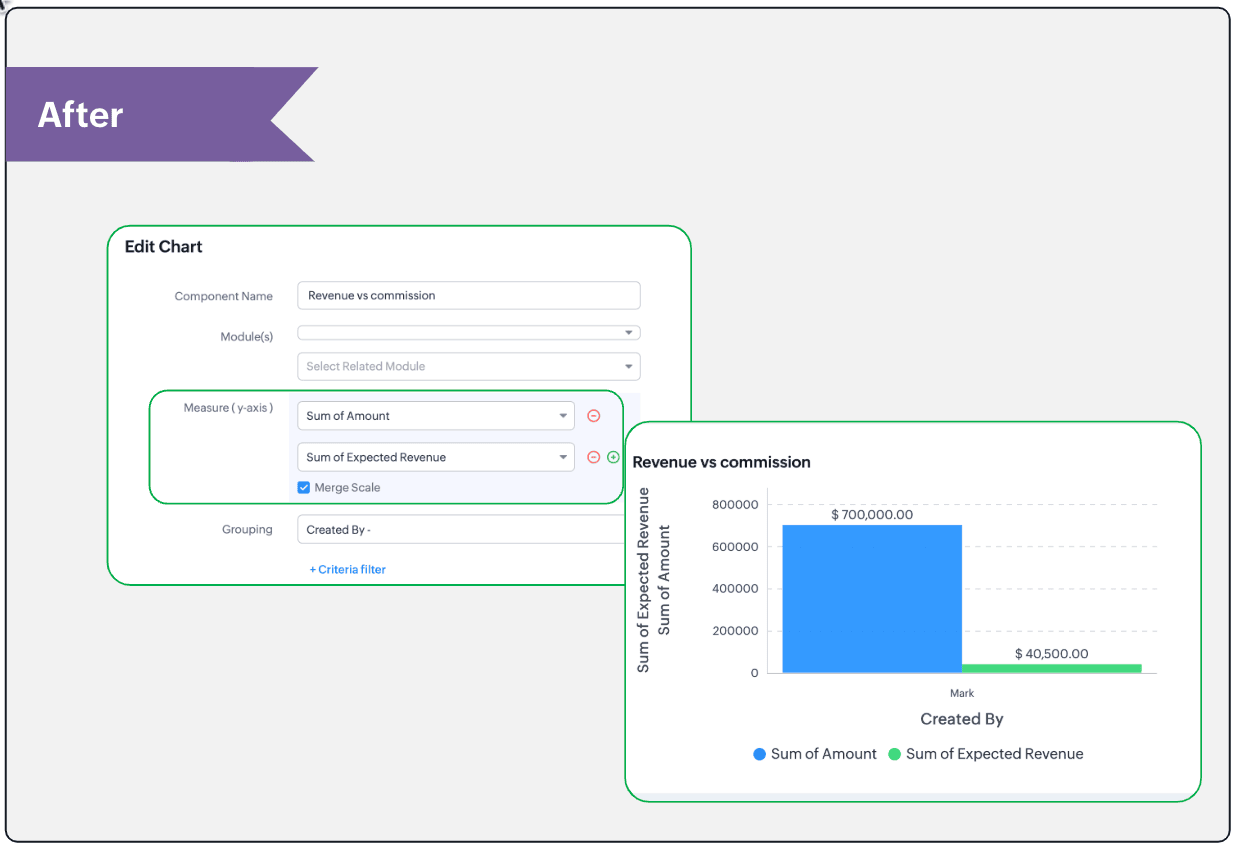
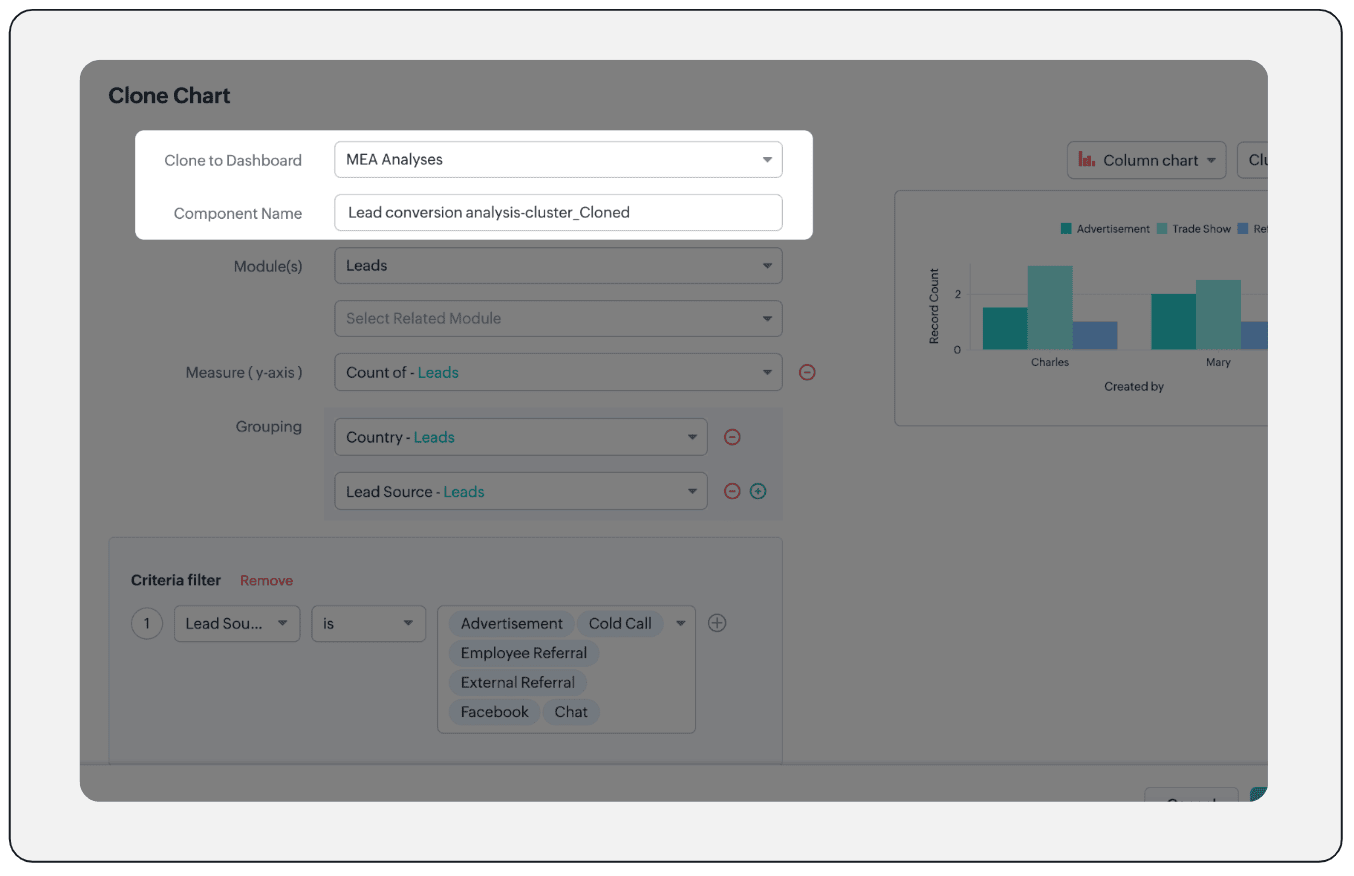
- Clone components to a different dashboard: Dashboards in Analytics serve in unique ways for various audiences—there can be separate dashboards for the sales team, marketing team, engineering team, and so on, and the chances of using the same measure for reference is common. Thus, when you clone a chart, you can now determine the target dashboard in which the cloned chart can be placed.
Resource: Help document
Thanks and have a good one!
Kind regards,
Saranya Balasubramanian
Saranya Balasubramanian
Topic Participants
Saranya Balasubramanian
Sticky Posts
Enhancements to the formula field in Zoho CRM: Auto-refresh formulas with the "Now" function, stop formula executions based on criteria, and include formulas within formulas
Dear Customers, We hope you're well! By their nature, modern businesses rely every day on computations, whether it's to calculate the price of a product, assess ROI, evaluate the lifetime value of a customer, or even determine the age of a record. WithElevate your CX delivery using CommandCenter 2.0: Simplified builder; seamless orchestration
Most businesses want to create memorable customer experiences—but they often find it hard to keep them smooth, especially as they grow. To achieve a state of flow across their processes, teams often stitch together a series of automations using WorkflowPresenting ABM for Zoho CRM: Expand and retain your customers with precision
Picture this scenario: You're a growing SaaS company ready to launch a powerful business suite, and are looking to gain traction and momentum. But as a business with a tight budget, you know acquiring new customers is slow, expensive, and often deliversNimble enhancements to WhatsApp for Business integration in Zoho CRM: Enjoy context and clarity in business messaging
Dear Customers, We hope you're well! WhatsApp for business is a renowned business messaging platform that takes your business closer to your customers; it gives your business the power of personalized outreach. Using the WhatsApp for Business integrationZoho CRM: Sales Rep Professional Certification Program on Coursera
We are happy to share that we have published the Zoho Sales Representative Professional Certificate in partnership with Coursera, a leading platform for online learning and career development that offers access to courses and degrees from leading universities
Recent Topics
Zoho people generatimg pdf
Hello , now i want to make a customm button in zoho people that is inside a deduction module , that fetches all the records and generate a pdf with a template that i have done in the mail merges template , i was told that i have to upload template onAbility to Filter Alias Mailboxes in Zoho Recruit
Dear Zoho Recruit Team, I hope you are doing well. We would like to request a feature enhancement regarding the handling of alias mailboxes in Zoho Recruit. Currently, when we connect an alias mailbox (e.g., jobs@domain.com) from our Zoho One accountzohorecruit.com career form postcode bug
Dear, When I select a postcode from the drop down on a zohorecruit.com career form, the street text field is automatically filled with the name of the city, which should not happen. Any idea how I can fix this? Thanks, BartOffice-365-agenda and Microsoft Teams Integration
Dear, I have a trial version of Zoho Recruit and trying to evaluate the Microsoft Teams Integration in Zoho Recruit. After registering with my Office 365 account and checking the result of the registration/sign-in at https://mysignins.microsoft.com/ (whichDelegate Access - Mobile iOS/iPad
We’re over the moon that delegate access is now available in Zoho Mail as we were nearly ready to switch platforms because of it! Is there a timeline on when delegate mailboxes will be accessible from the iOS and iPad OS applications? Thanks, JakeHow to add Connector in developer platform zoho?
Hi, I am working on creating an Extension, and part of the development is to retrieve Email templates. In my CRM instance I can invokeURL by creating Zoho OAuth connection and get the template. But developer platform does not provide Zoho OAuth or anyHow to archive Lost/Junk Leads so sales reps don’t see them, but keep them for reporting?
Hi everyone, In our Zoho CRM we have two Lead Status values: Lost Lead and Junk Lead. What I want to achieve is: When a lead is marked as Lost or Junk, it should disappear from my sales reps’ Lead views (so they only see active leads). At the same time,Zoho CRM Canvas Copy Original Layout
Hello all, I want to use Canvas to make small changes to certain views, not to make huge changes. Is it possible to copy the original Zoho layout and set-up and start from there? I checked and all I can find are some templates which are far from the originalRevenue Management: #5 Revenue Recognition in SaaS
If you're building or running a SaaS business, you've probably encountered this. You get paid upfront for a subscription and a one-time onboarding fee, but you end up with confusion about when to consider it revenue. Can I book all of it now? Should IMS Teams for daily call operations
Hello all, Our most anticipated and crucial update is finally here! Organizations using Microsoft Teams phone system can now integrate it effectively with Zoho CRM for tasks like dialling numbers and logging calls. We are enhancing our MS Teams functionalityZoho Learn Course Access Issue
One of the learners in a specific course can't see any lessons. They are registered as both a user and learner for this course in Zoo Learn. What could be the reason?ZOHOLICS Japan 2025 開催のお知らせ(再投稿)
【コミュニティユーザーの皆さまへお知らせ】 Zoho 最大のユーザーイベント「ZOHOLICS Japan 2025」を9月19日(金)に開催します。 AI活用に関する特別講演、ユーザー事例、Zoho 製品の活用例のご紹介など、Zoholicsならではのセッションをご用意しています。 Zoho コミュニティ開催のMeetupとはまた違った雰囲気のイベントです。 ご都合のつく方はお気軽にご参加ください✨ 詳細はこちら https://events.zoho.jp/zoholics2025#/?affl=forumpost2Phone Number format for Bulk Upload via csv for Zoho Sign
What is the phone number format that we need to use for a bulk recipient upload via csv in zoho sign, should the country code be included for ex if its US should it be +18889007865 ior 18889007865 or without country code 8889007865? the sample csv providedFilter Page Elements By Selectable Date Range
I have created a basic Page that will serve as a client dashboard with elements that will provide simple counts & sums of data in reports. There are no reports or forms added to the page, just elements. It currently functions as needed, but shows theCan’t Enter my Notebook is Locked
I’ve been using Notebook for taking notes at my college for a month and I never signed in and I never established a password. Today I tried to enter the app after the update and it asked me for a password. I need to access to my notes urgently and I can’tSend Email Directly to Channel
Hi, We are coming from Slack. In Slack each channel has a unique Email address that you can send emails too. I currently forward a specific type of email from my Gmail InBox directly do this channel for Verification Codes so my team doesn't have to askSecure your external sharing process with OTP Authentication
For any business, it's crucial to share files externally in a way that is both secure and controlled. Let's say you want to share confidential data with your partners and vendors. You must ensure that only your intended recipients can access the sharedItems attribute questions
Many of my items have attributes, such as size and color. How can I add new fields to the "New Items" screen to capture that in my Purchase Orders, Items, and Sales Order pages? I only see these attribute fields when adding an Item Group. Also, on theIs there a way to search mail for items you haven't yet responded to?
I'm trying to create a search to show emails that haven't been responded to and that have also been assigned a tag or label. Is there a way to search for the inverse of replied?Zobot and Sales IQ
What will happen to the Zoho Sales IQ being integrated to the website after creating the Zobot on the website tooSubtotals per Header
Hey, we would like to display subtotals per header in our invoices:upgrade storage
how to upgrade my storageLinking items from books and subscription
Linking books and subscription It is a pity that it is not possible to associate with a product an article present in ZohoBooks This would make it possible to manage products composed of a nomenclature of articles of booksAdd the ability to view number of hours planned for a workorder while in the Dispatch Console
Hi Zoho, When dispatching a work order through the Dispatch Console, there's currently no way to view the number of planned hours for the service tasks associated with that specific work order. Having to click into the details each time to check plannedUploading Files from uploads api
I tried uploading the image from the API call but its giving me unauthorized error even i have given valid token in header. After uploading i need that id to pass in create ticket api uploads but its not uploading that file. Please help me out in thCategorize Items with Item Headers
Hello customers, Did you ever want to classify items based on specific categories to help your customers understand your invoice better? With the new Item Header feature, you can easily categorize items in your invoices and estimates and give them a common title. Item Headers are available in the Invoices, the Recurring Invoices and the Estimates module. It can be carried forward from estimates to invoices at the time of converting the estimates. To add an item header: Go to the Estimates, InvoicesURLs being masked despite disabling tracking
Hey, We had disabled click tracking from an email update we are sharing with our users. Despite this, the URL the end user is receiving is masked, and looks like "https://qksyl-cmpzourl.maillist-manage.net/click/1d8e72714515cda6/1d8e72714515ca70" insteadChange format of quantity format
Hi, I would like to change the qunatity format from 1,00 to 1. Is this possible? thanks!square up and Zoho books
Since we set up the app connection between square up and Zoho books we have realised that when the amounts are getting transferred Zoho is adding VAT again making the numbers 20% more than they should be. We have checked our settings and they VAT/ TaxHow to provide Access rights to specific Bank accounts
We have several bank accounts. I want to provide certain members access to only 2-3 accounts. It appears that when I give permissions, they are for ALL bank accounts. How do I do that?Errors Getting a Bank Transaction
Using Postman(for testing), I am receiving errors when attempting to get a single bank transaction. I am able to receive the list of bank transactions with https://www.zohoapis.com/books/v3/banktransactions/?organization_id={org_id} but when I try toSubscriptions Plans and CRM Products Integration?
Is there any way to set up plans and pricing in Zoho Subscriptions and have those available as Products in the CRM? We are trying to set up the CRM and the Products seem to be more geared toward selling products that are not subscription based. So if we sell annual or monthly contracts which are $10/seat/month, I can set this up as a plan in Subscriptions, but how can I set the same thing up in the CRM for the salespeople to sell/quote? What is the best practice for setting up the CRM Products toMapping Zoho Subscription Plans and Products to CRM and Books
We have products that are one time products and subscription products. 1) We would like to have the ability to create an opportunity in CRM that includes both one-time charge products and subscription products. Currently the only way of creating a subscription product is by defining a "Product->Plan" hierarchy in Zoho Subscription. It appears that the only SYNC between Subscription and CRM is around contacts and the Product->Plan hierarchy doesn't sync to CRM, thus, you would need a duplicateZoho People Attendance Module - Split Shifts
Hello, Our business employs a number of college students who often split their workdays between work hours and class schedules, resulting in split shifts. For example: Employee 1 works 9am to 11:30am and then leaves for class, returning to work at 3pmBulk update fields based on date
Hi! I need all the quotes with "Quote Stage" set to "Next Year" to update to "Draft" every January 8 (every year). Can you help?Target for a campaign
Hi, Hope you can help me. I need to create a report (for a marketing campaign) that combines Deals and Contacts to export all the contacts with closed deals. I can easily do that, what I cannot do is to remove from the target the contacts that have moreZoho Desk + Jira integration - Email notifications and comments posted by administrator instead of real user
Dear All, I set up the integration under my admin account, and now when users leave comments in Jira (to created tickets in Zoho Desk), the email notifications show that the ‘Administrator’ left a comment, not a real user. The same happens in the ticketCelebrating the power of visuals
On World Photography Day, we would like to highlight the power of visuals in customer service. Visuals promote learning and understanding in less time. A photograph can rekindle a memory, convey more than words, and give a fresh perspective. How doesCustomer address in Zoho Bookings
Hello, Is it possible to add customer address information to the Zoho bookings appointment screen? Or have it pull that information automatically from the CRM? We are wanting to use this as a field management software but it is difficult to pull the address from multiple sources when it would be ideal to have a clickable address on the appointment screen that opens up the user's maps. It would also be advantageous for the "list view" to show appointment times instead of just duration and bookingBlocking / black listing customers
Hi, We have a situation, we observed that certain customers are blocking multiple appointments with our advsiors but not showing up. Some of these are repeat offenders. This leads to those service hours getting blocked and not available for genuine customers.Next Page