Tip #66 - Exploring Technician Console: Network Statistics - 'Insider Insights'
Hello Zoho Assist Community!
Have you ever wondered why a remote session feels sluggish, or wanted to check whether connectivity issues are on your end or the customer's? That's exactly where the Network Statistics feature in Zoho Assist comes to the rescue!
With just a couple of clicks, you can get a real-time information of the network health for both the technician and the customer, right from the Technician Console, without any guesswork or third-party tools.
What is the Network Statistics feature?
The Network Statistics option in Zoho Assist gives technicians a live view of the network performance for both parties during an active remote support session. It's accessible directly from the Session menu in the Technician Console.
This makes it easy to:
Monitor real-time connectivity status for both technician and customer
Check latency, download rate, and upload rate on both ends
Identify which side is experiencing network degradation
View the connected gateway location for better session routing awareness
How to access network statistics during a session
Start a remote support session and navigate to the Technician Console, click on Session in the left sidebar. Select Network Statistics from the dropdown menu. A dialog instantly appears showing a detailed breakdown of network metrics for both the customer and the technician.
It's that simple, no interruptions to your session, no switching tools!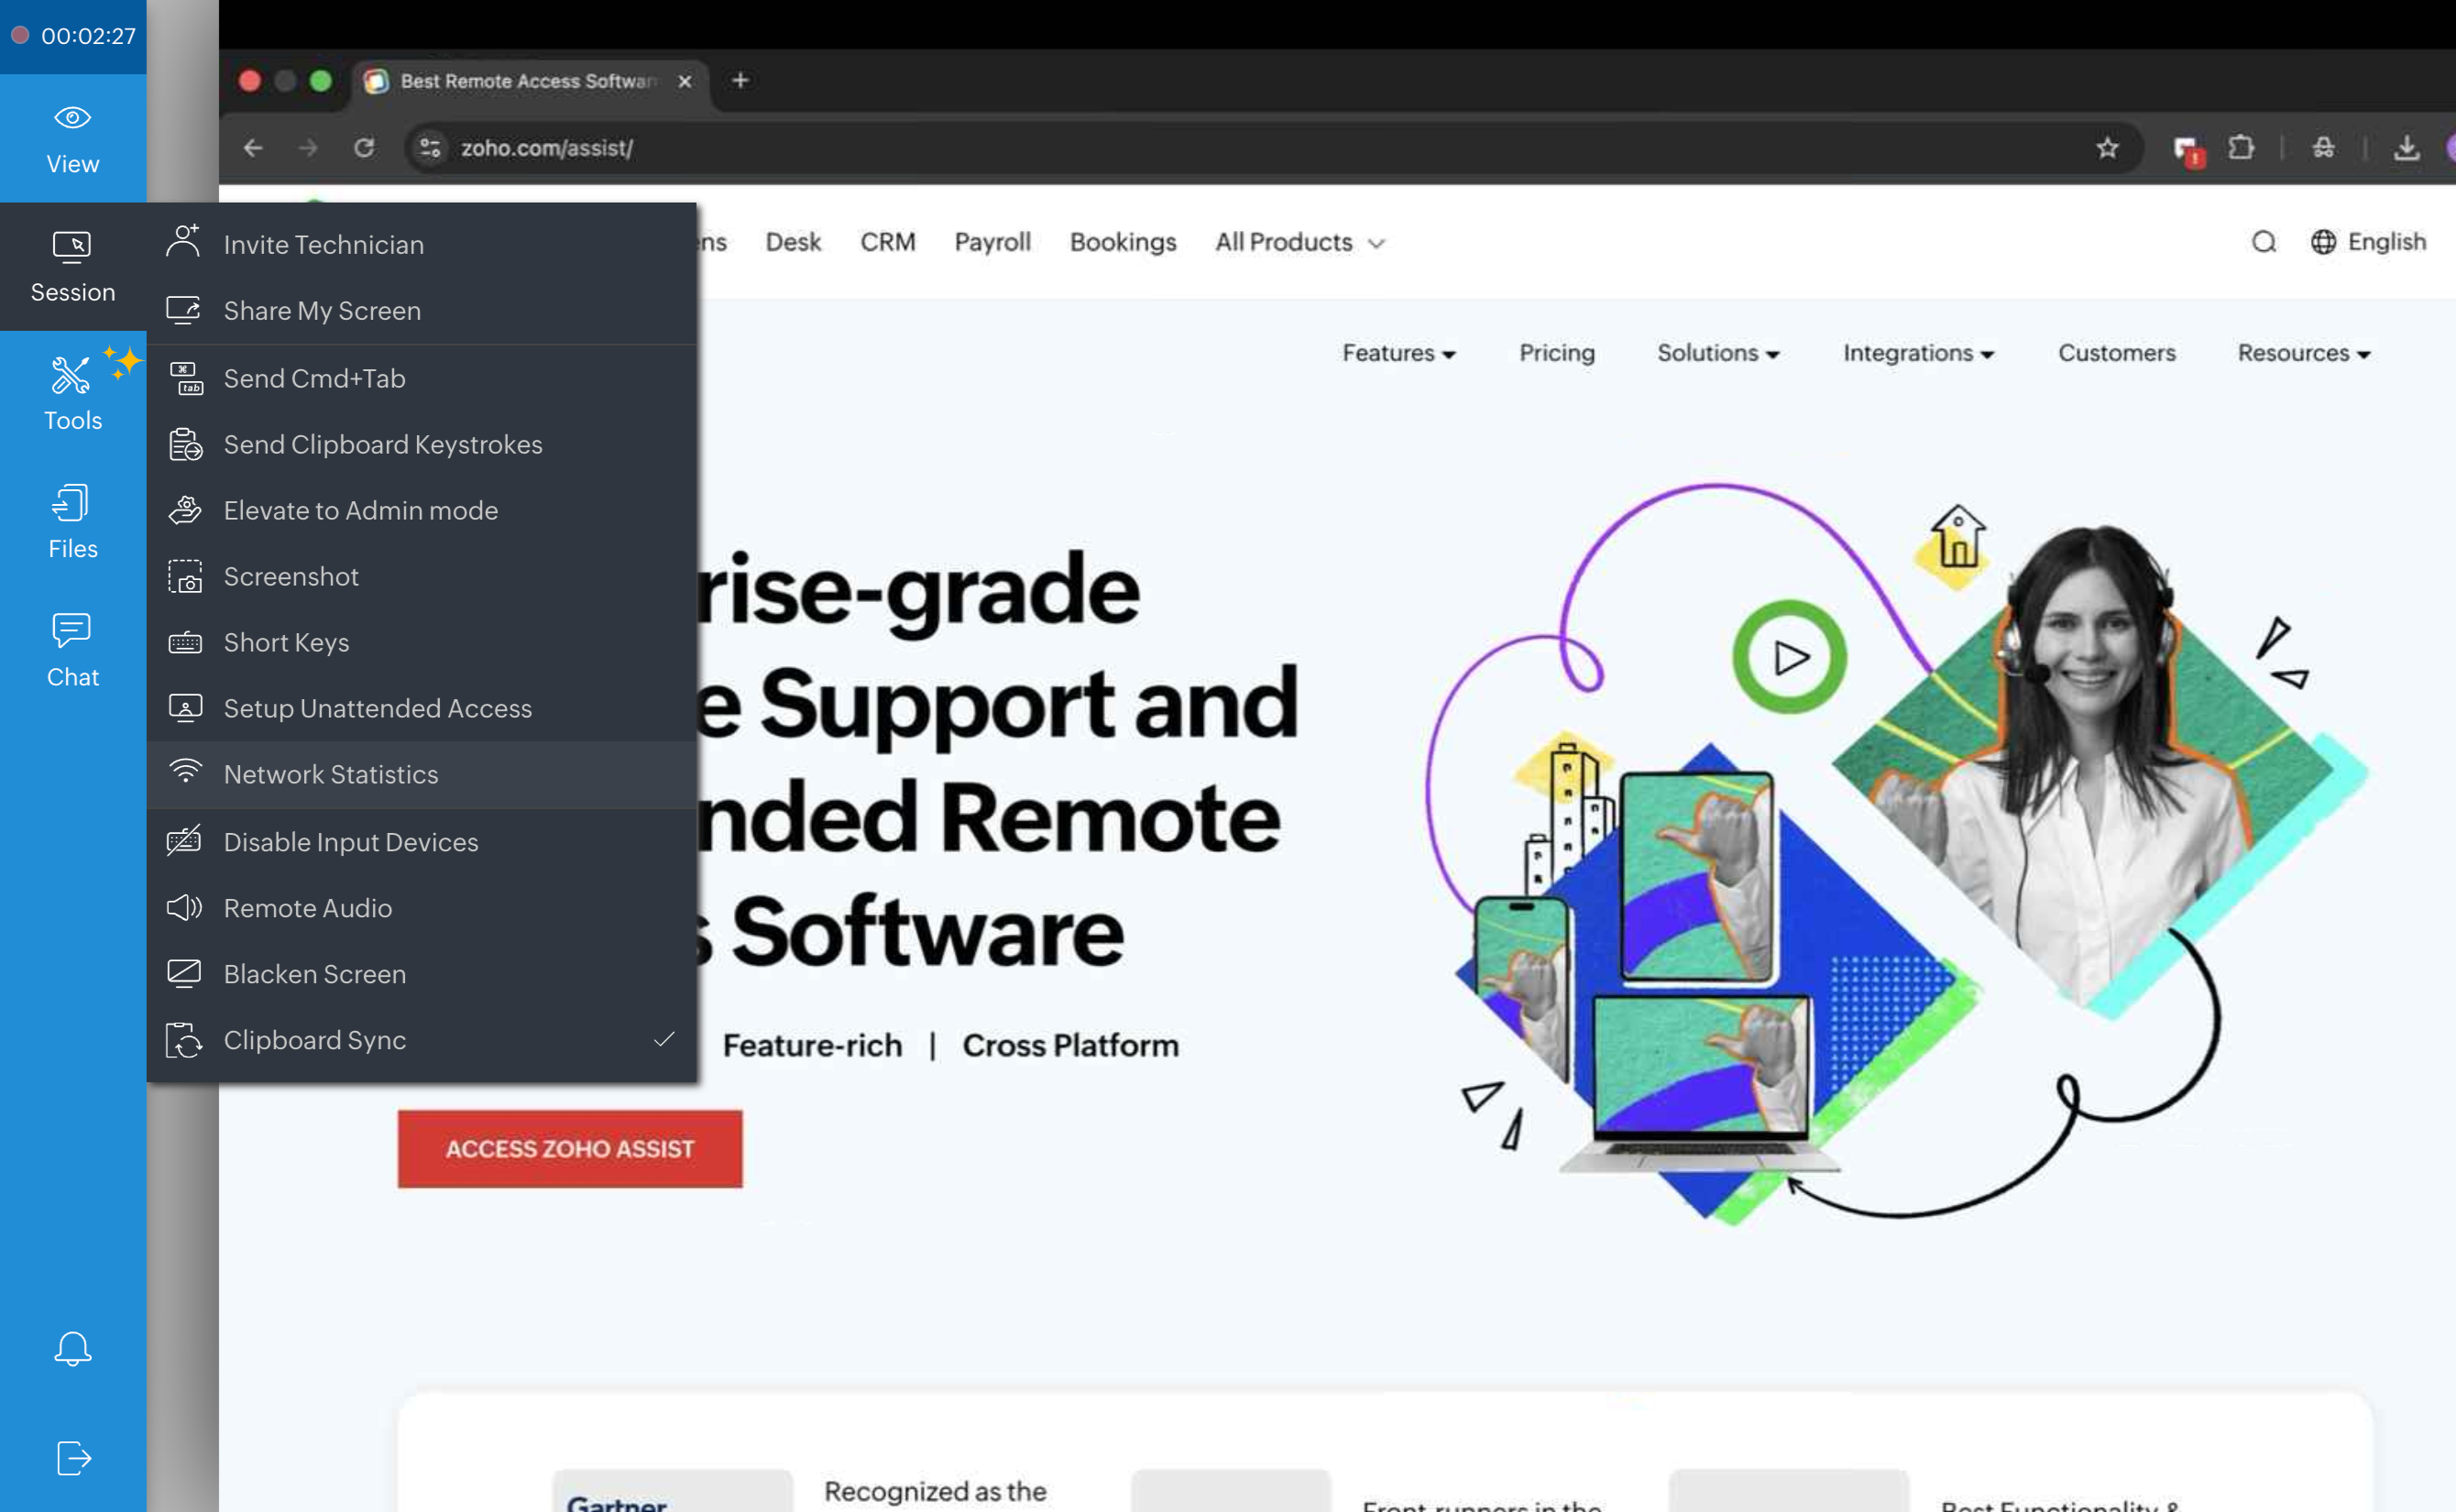
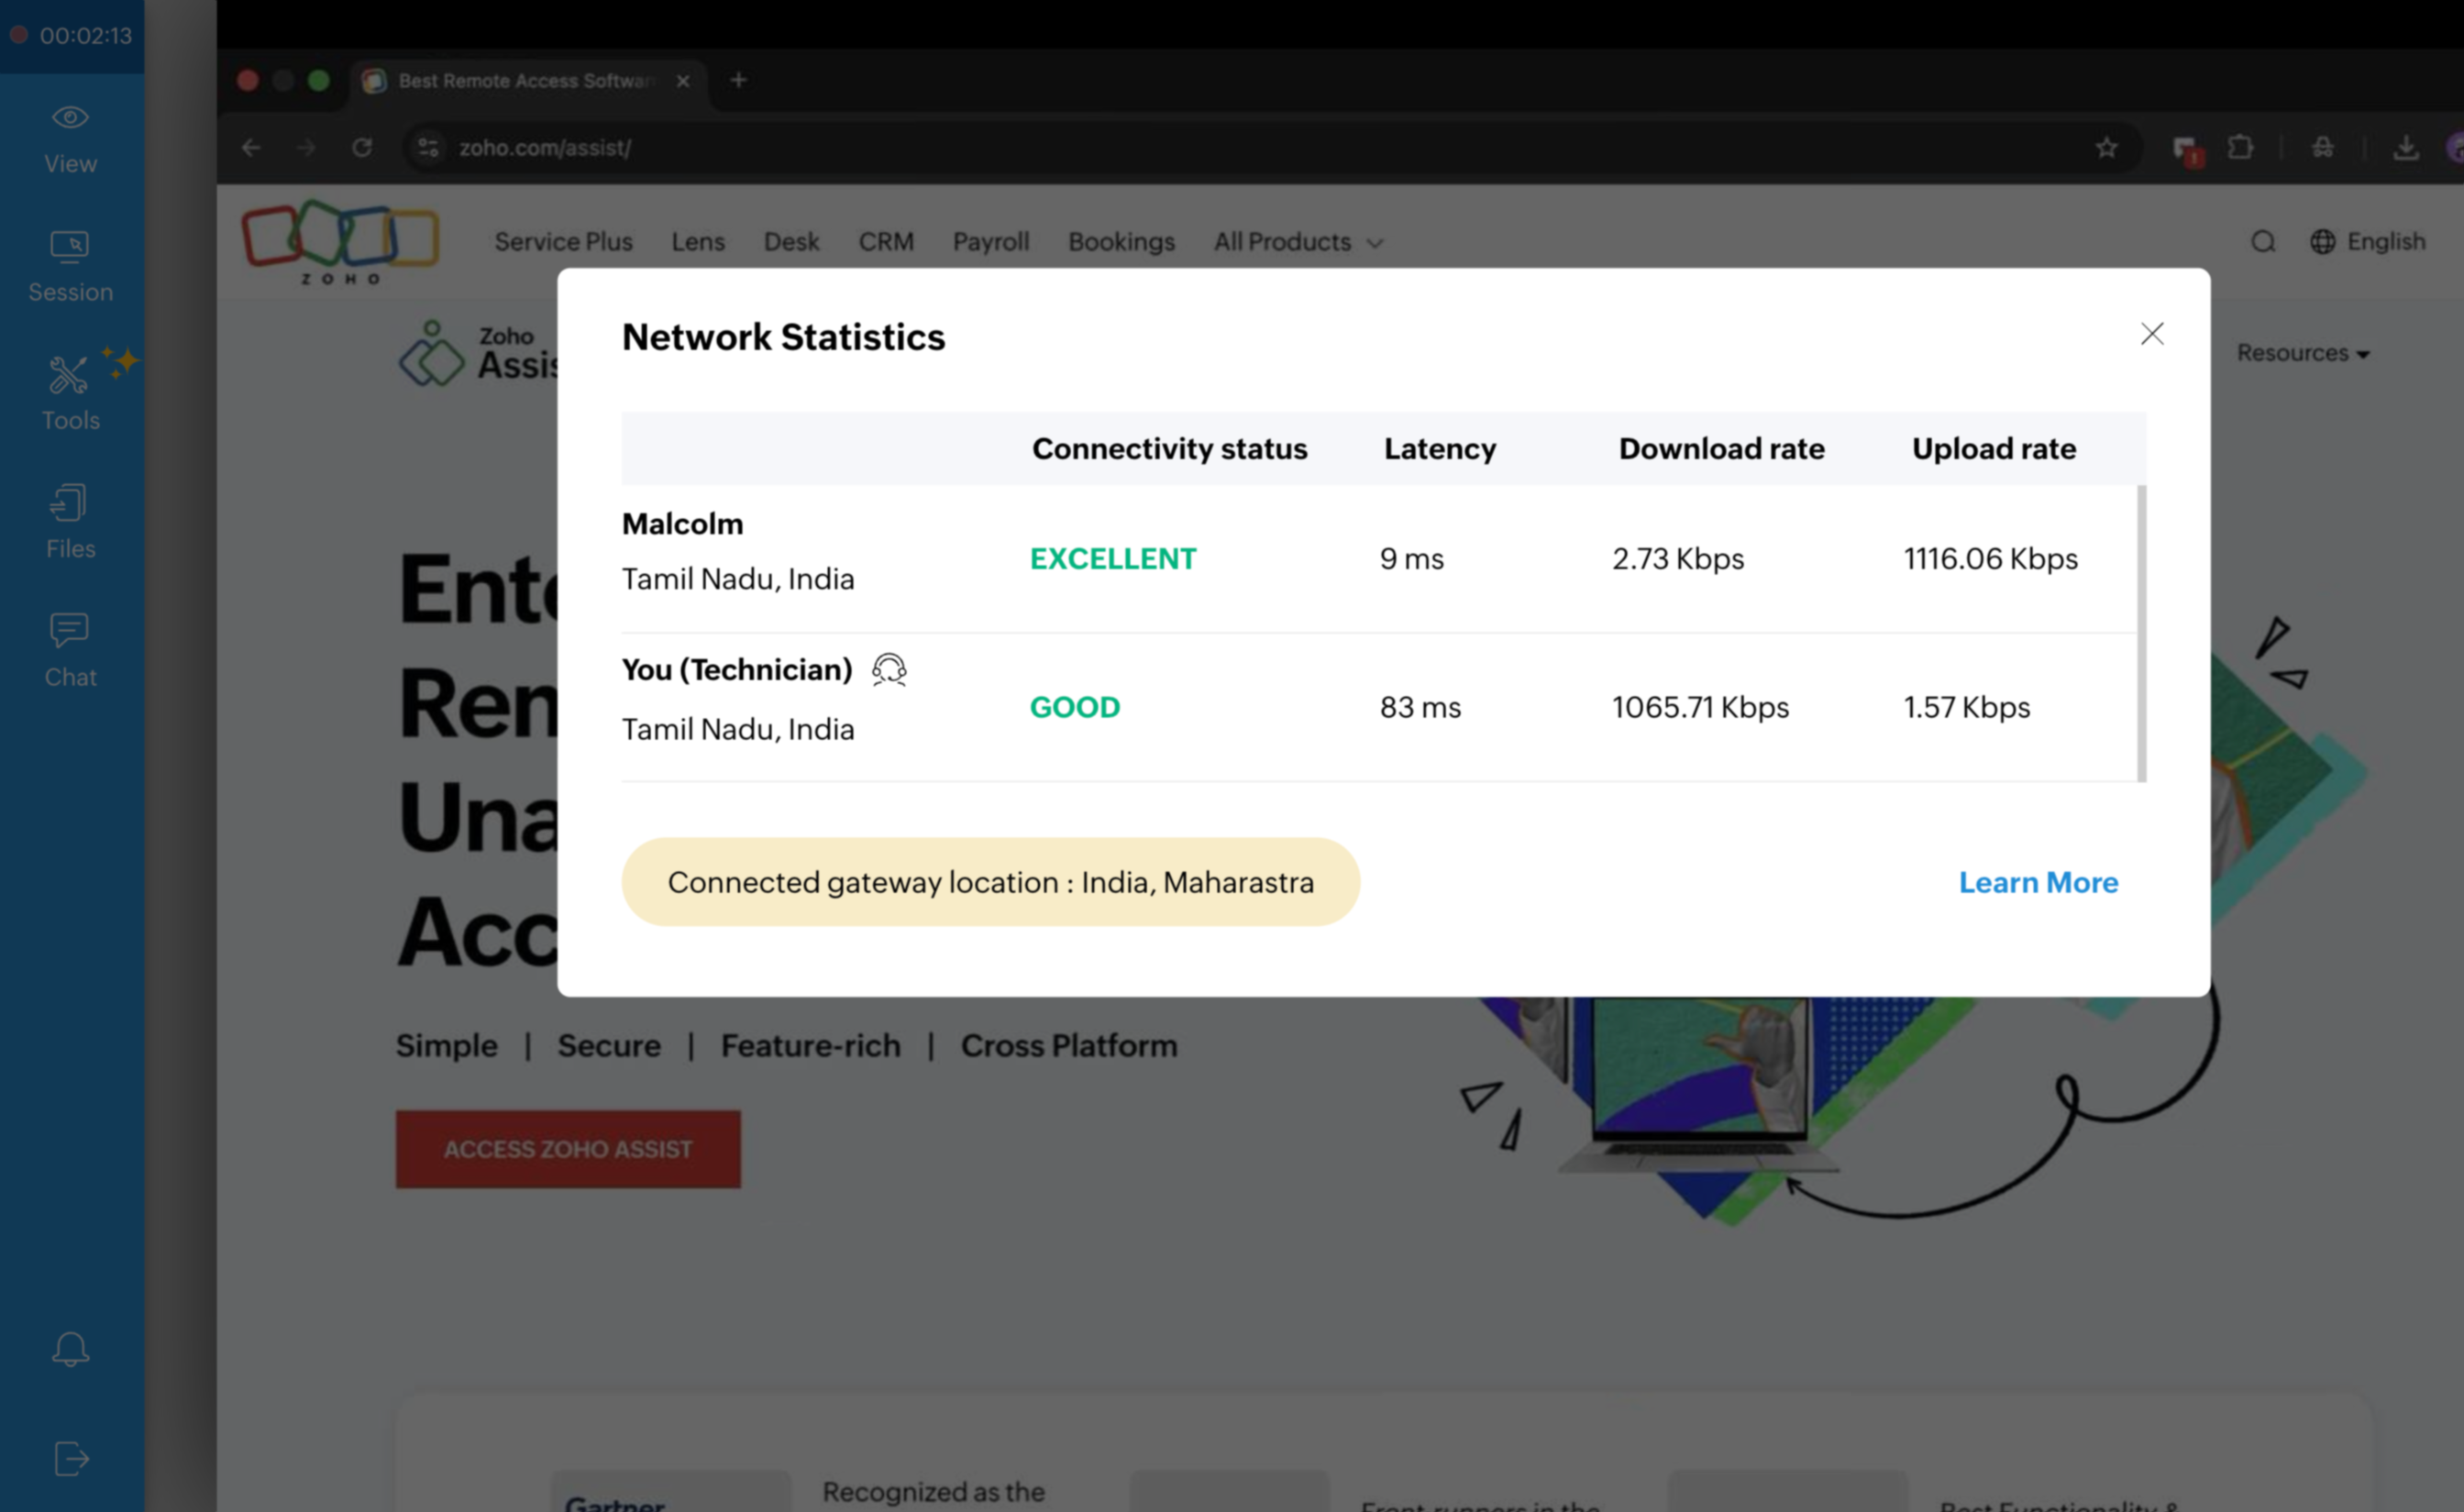
Understanding the Network Statistics Panel
Once opened, the panel displays the following metrics for both the customer and the technician:
Connectivity status — Rated as Excellent, Good, Fair, or Poor, giving you an instant health indicator
Latency — The round-trip response time in milliseconds; lower is better for a smooth session
Download rate — The speed at which data is being received, measured in Kbps
Upload rate — The speed at which data is being sent, measured in Kbps
Connected gateway location — The regional gateway through which the session is routed
Why is this feature useful?
Network Statistics is a quietly powerful tool that can transform the way you troubleshoot connectivity-related issues. Here's why it matters:
Instant Diagnosis: Quickly determine whether session lag is caused by the customer's network, your own connection.
Transparent Communication: Show customers real data about their connectivity status instead of relying on vague explanations.
Faster Resolution: Stop guessing and start resolving, know where the bottleneck is before diving into troubleshooting steps.
Session Quality Management: If latency is high on your end, you can take corrective action like switching networks before it impacts the session experience.
Professional Credibility: Walking a customer through their own network metrics builds trust and demonstrates thoroughness.
If you've used the Network Statistics feature during a remote session, whether to diagnose lag, reassure a customer, or optimize your session quality, we'd love to hear how it fits into your workflow!
Drop your experience, tips, or questions in the comments below. And if you ever need help or have questions about the feature, feel free to reach out to us at support@zohoassist.com , we're always here to help!