Announcing Zoho Analytics 6.0 - An AI Powered Self-Service BI & Analytics Platform!
That’s why we’re excited to announce the launch of Zoho Analytics 6.0! This powerful new version brings together business users, data analysts, data engineers, and data scientists on a single platform, making data-driven decision-making easier and more accessible for all. Welcome to a new era of analytics!
Data Connectors and Data Management
New Connectors
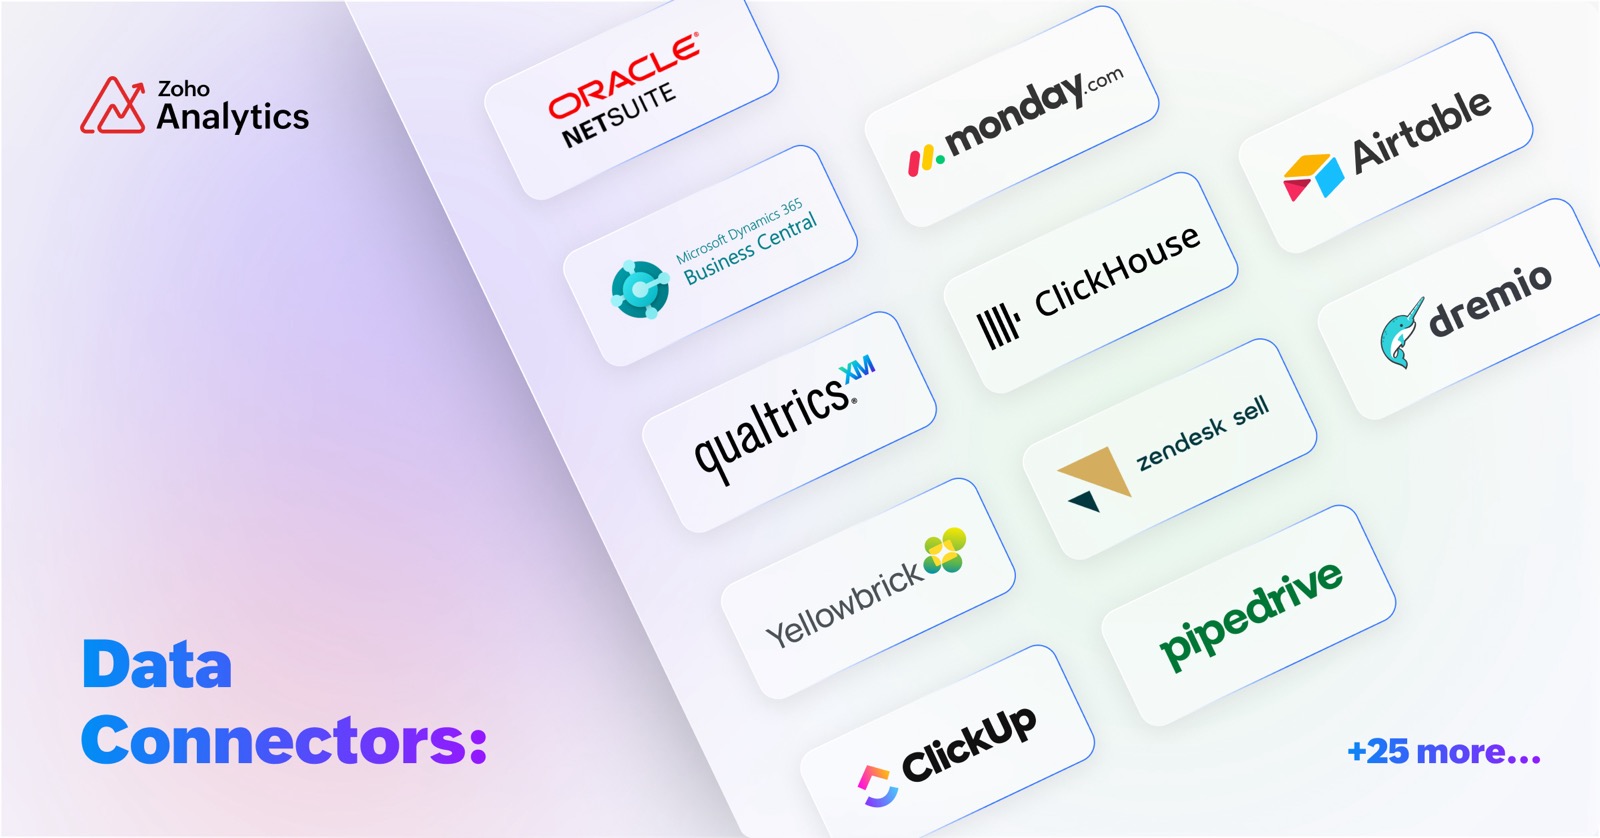
We are enhancing our existing portfolio of over 500+ advanced analytics connectors by adding more than 25 connectors to this list. These additions cater to big data platforms and business applications, including Yellowbrick, ClickHouse, Dremio, Oracle Netsuite, Databricks, Monday.com, Airtable, Qualtrics, ClickUp, and several others.
Effectively analyze your data from different business applications by using our pre-built reports and dashboards. Additional features in Zoho Analytics like Sync history, Audit History, and Undo Import allow you to manage all data sources, including the connectors.
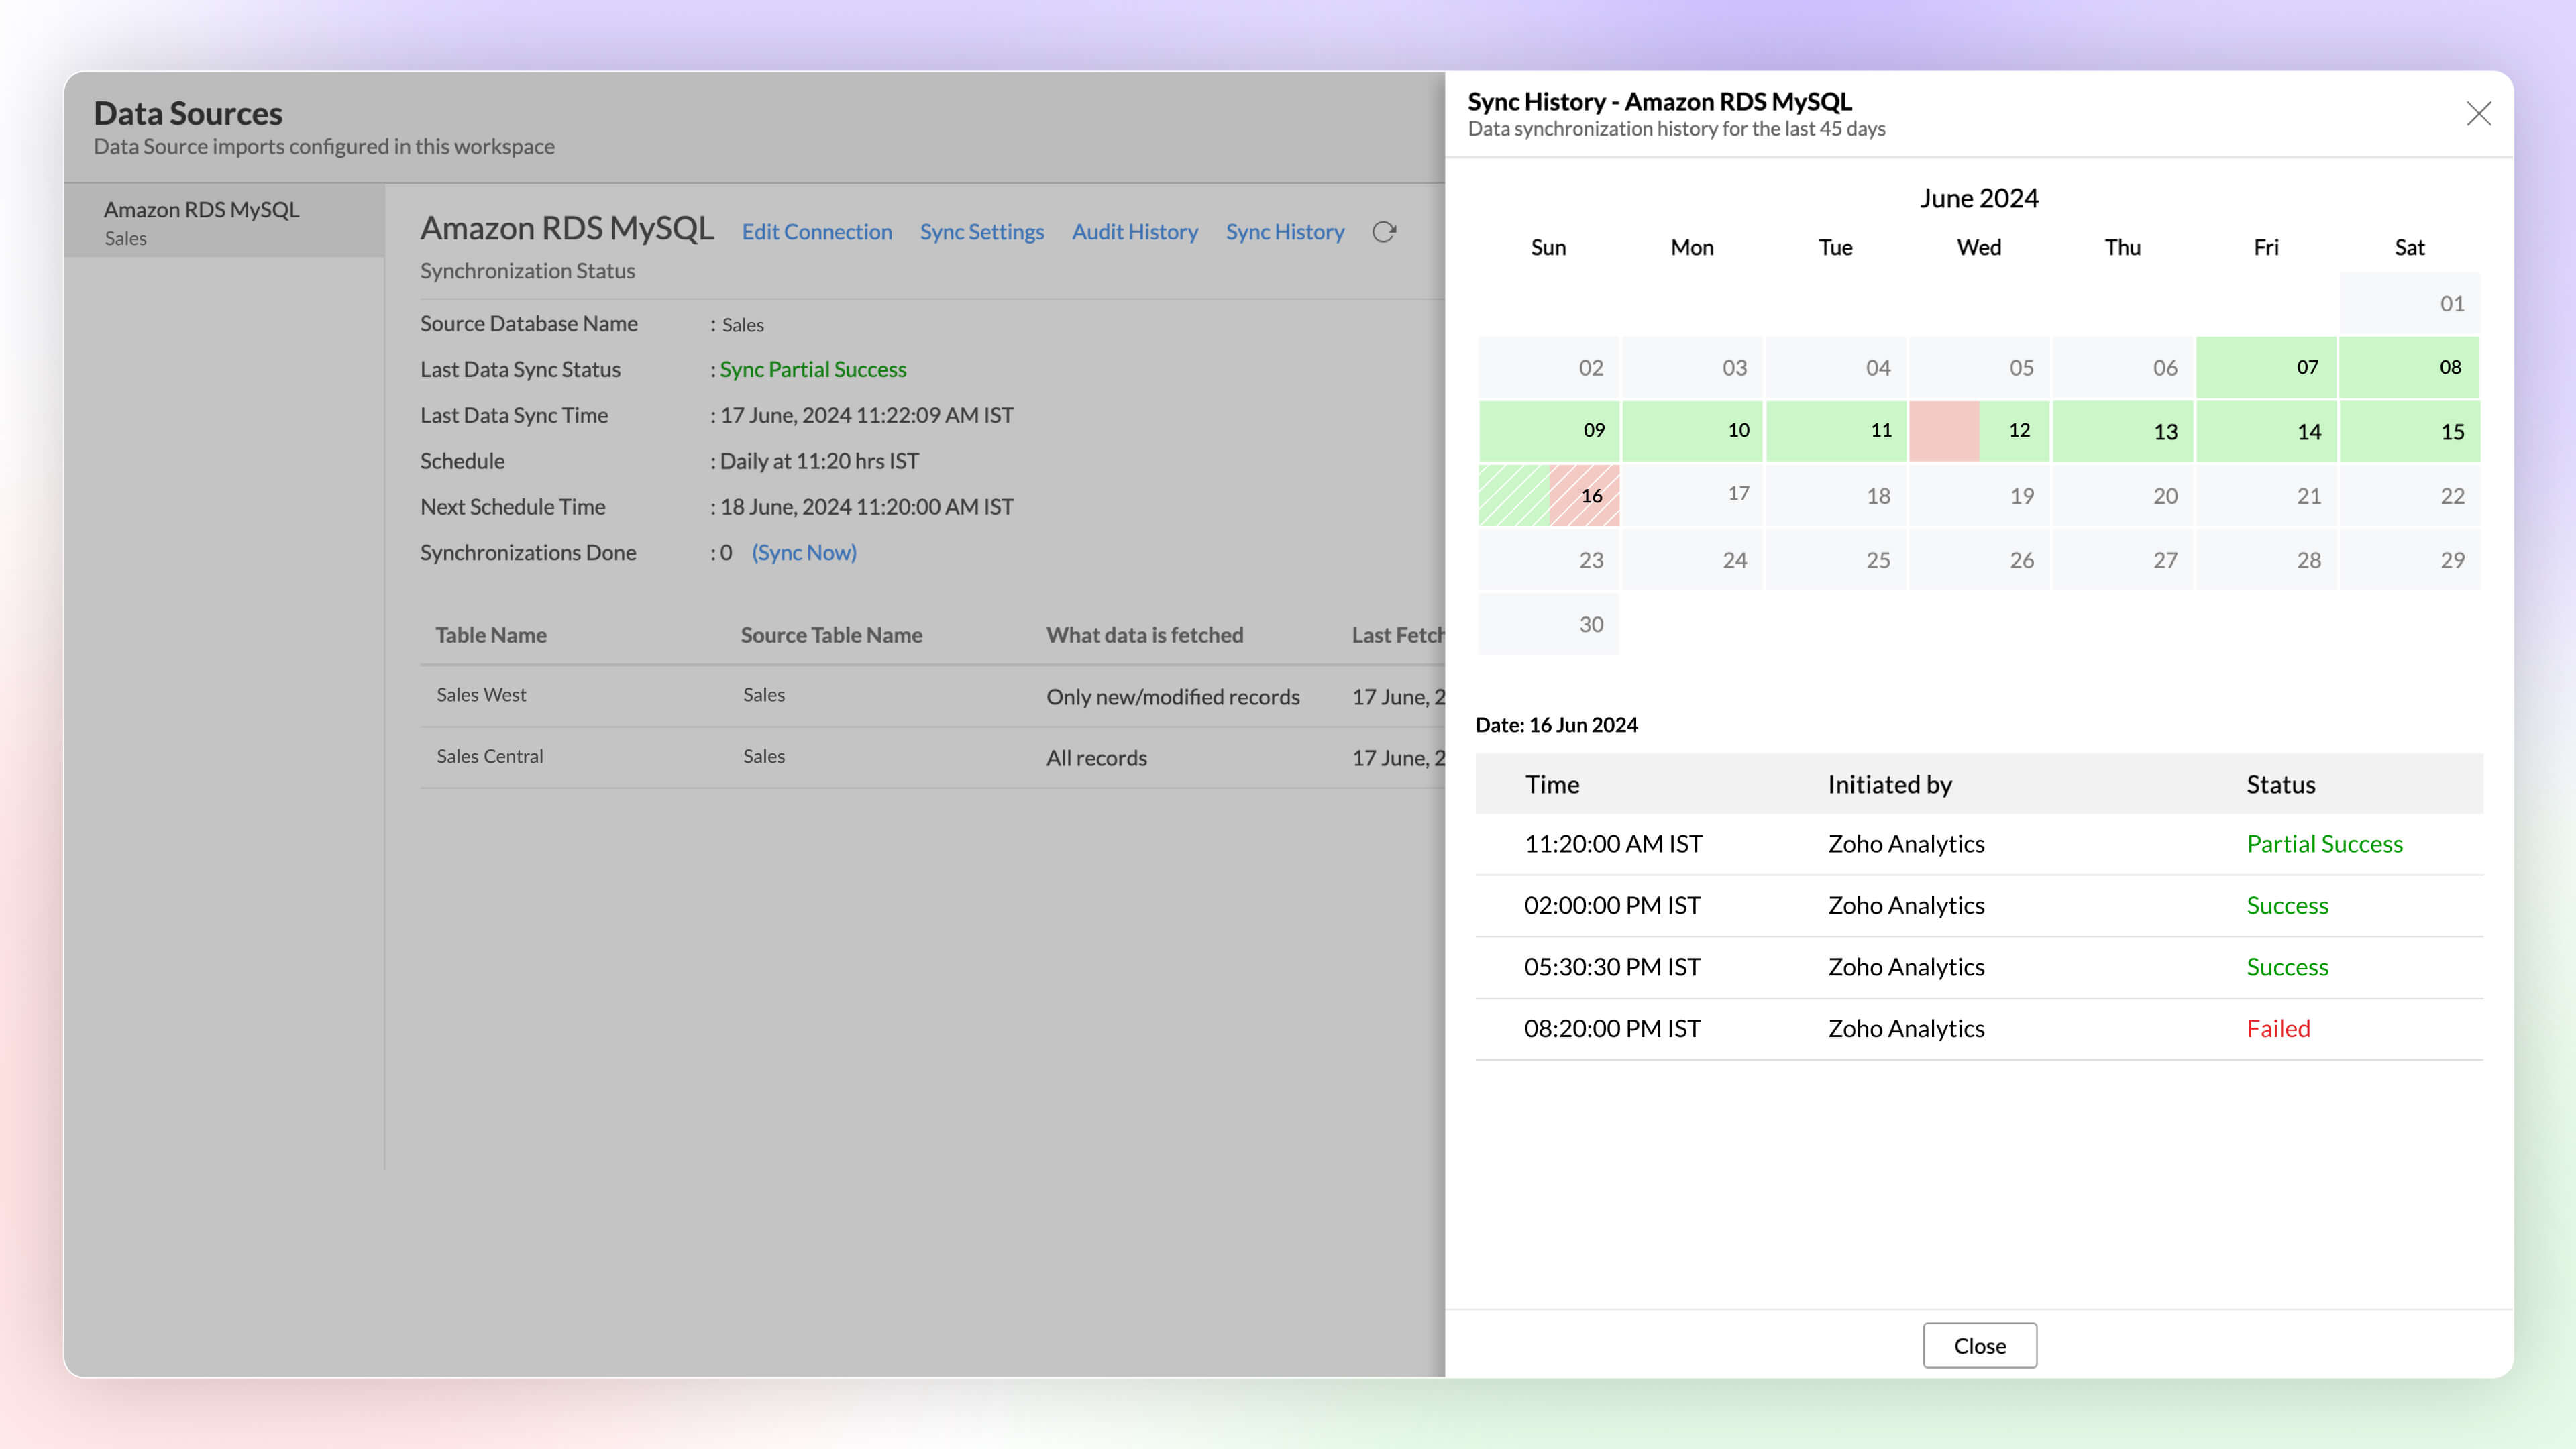
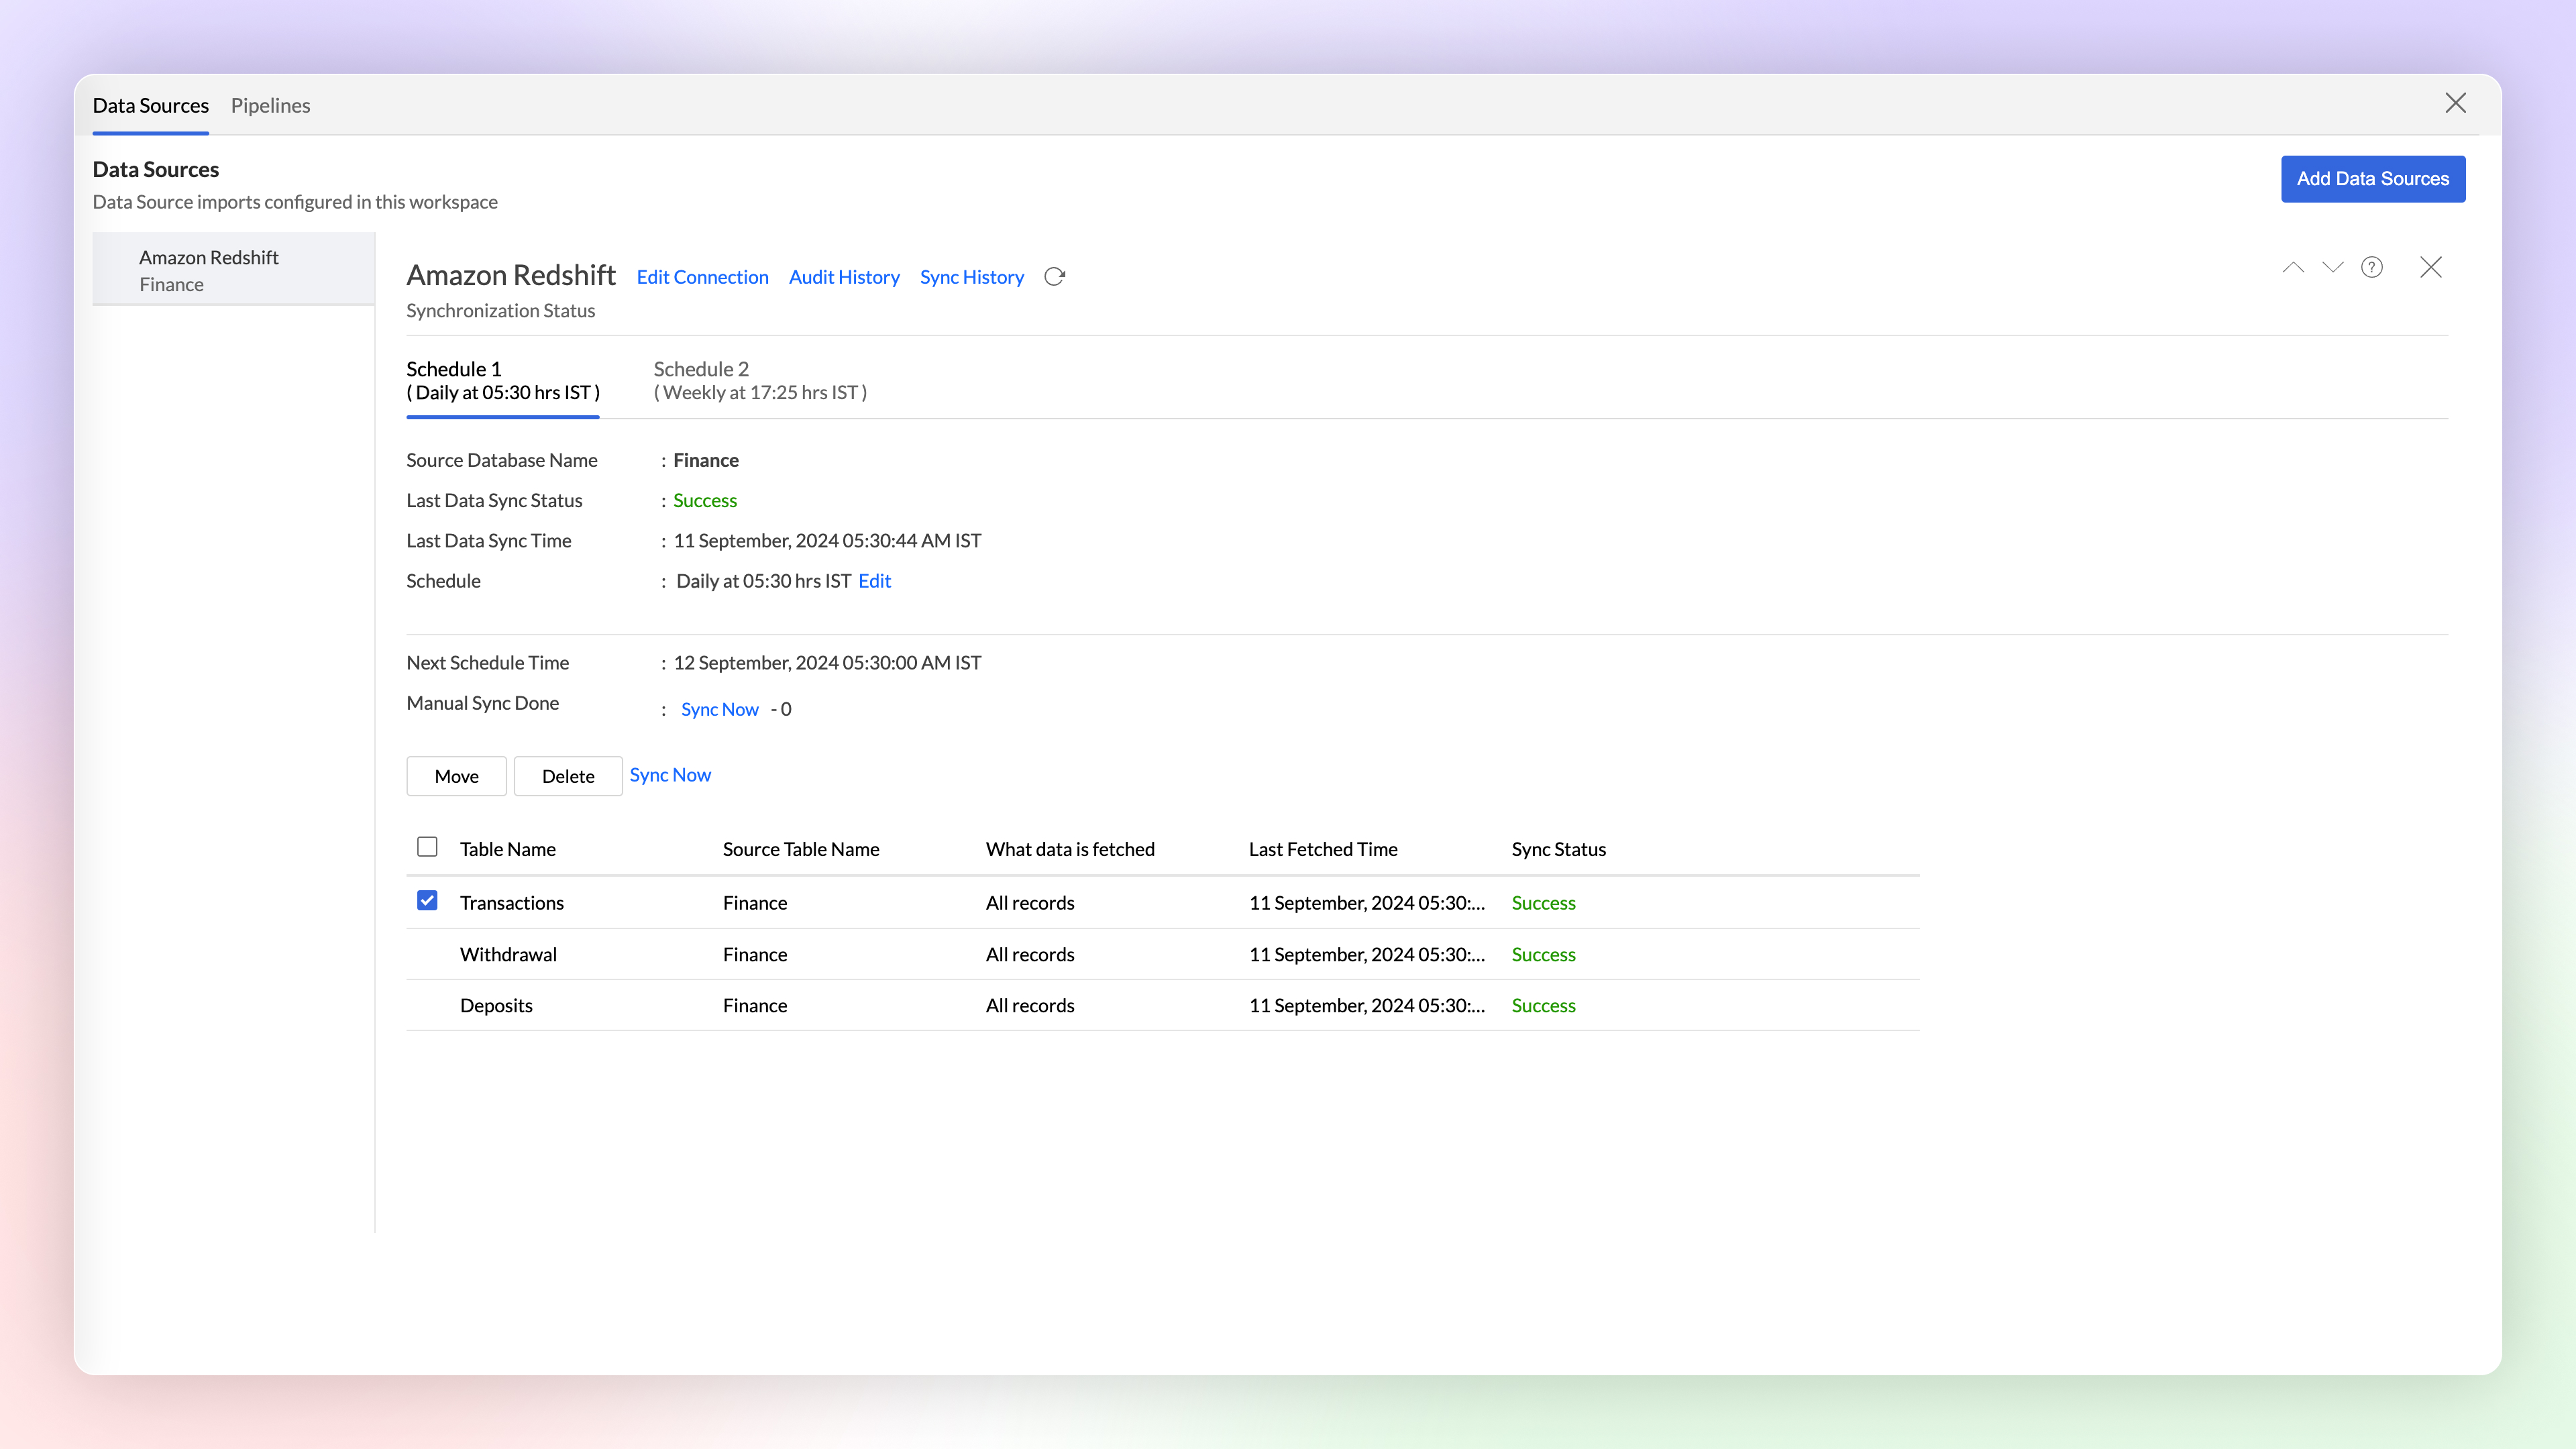
Sync History
Get a detailed overview of data synchronization activities using Sync history in Zoho Analytics. It helps administrators monitor the status of each sync easily, as successful syncs are highlighted in green, while failed syncs appear in red, along with reasons for the failure and required actions.
Click here to learn more.
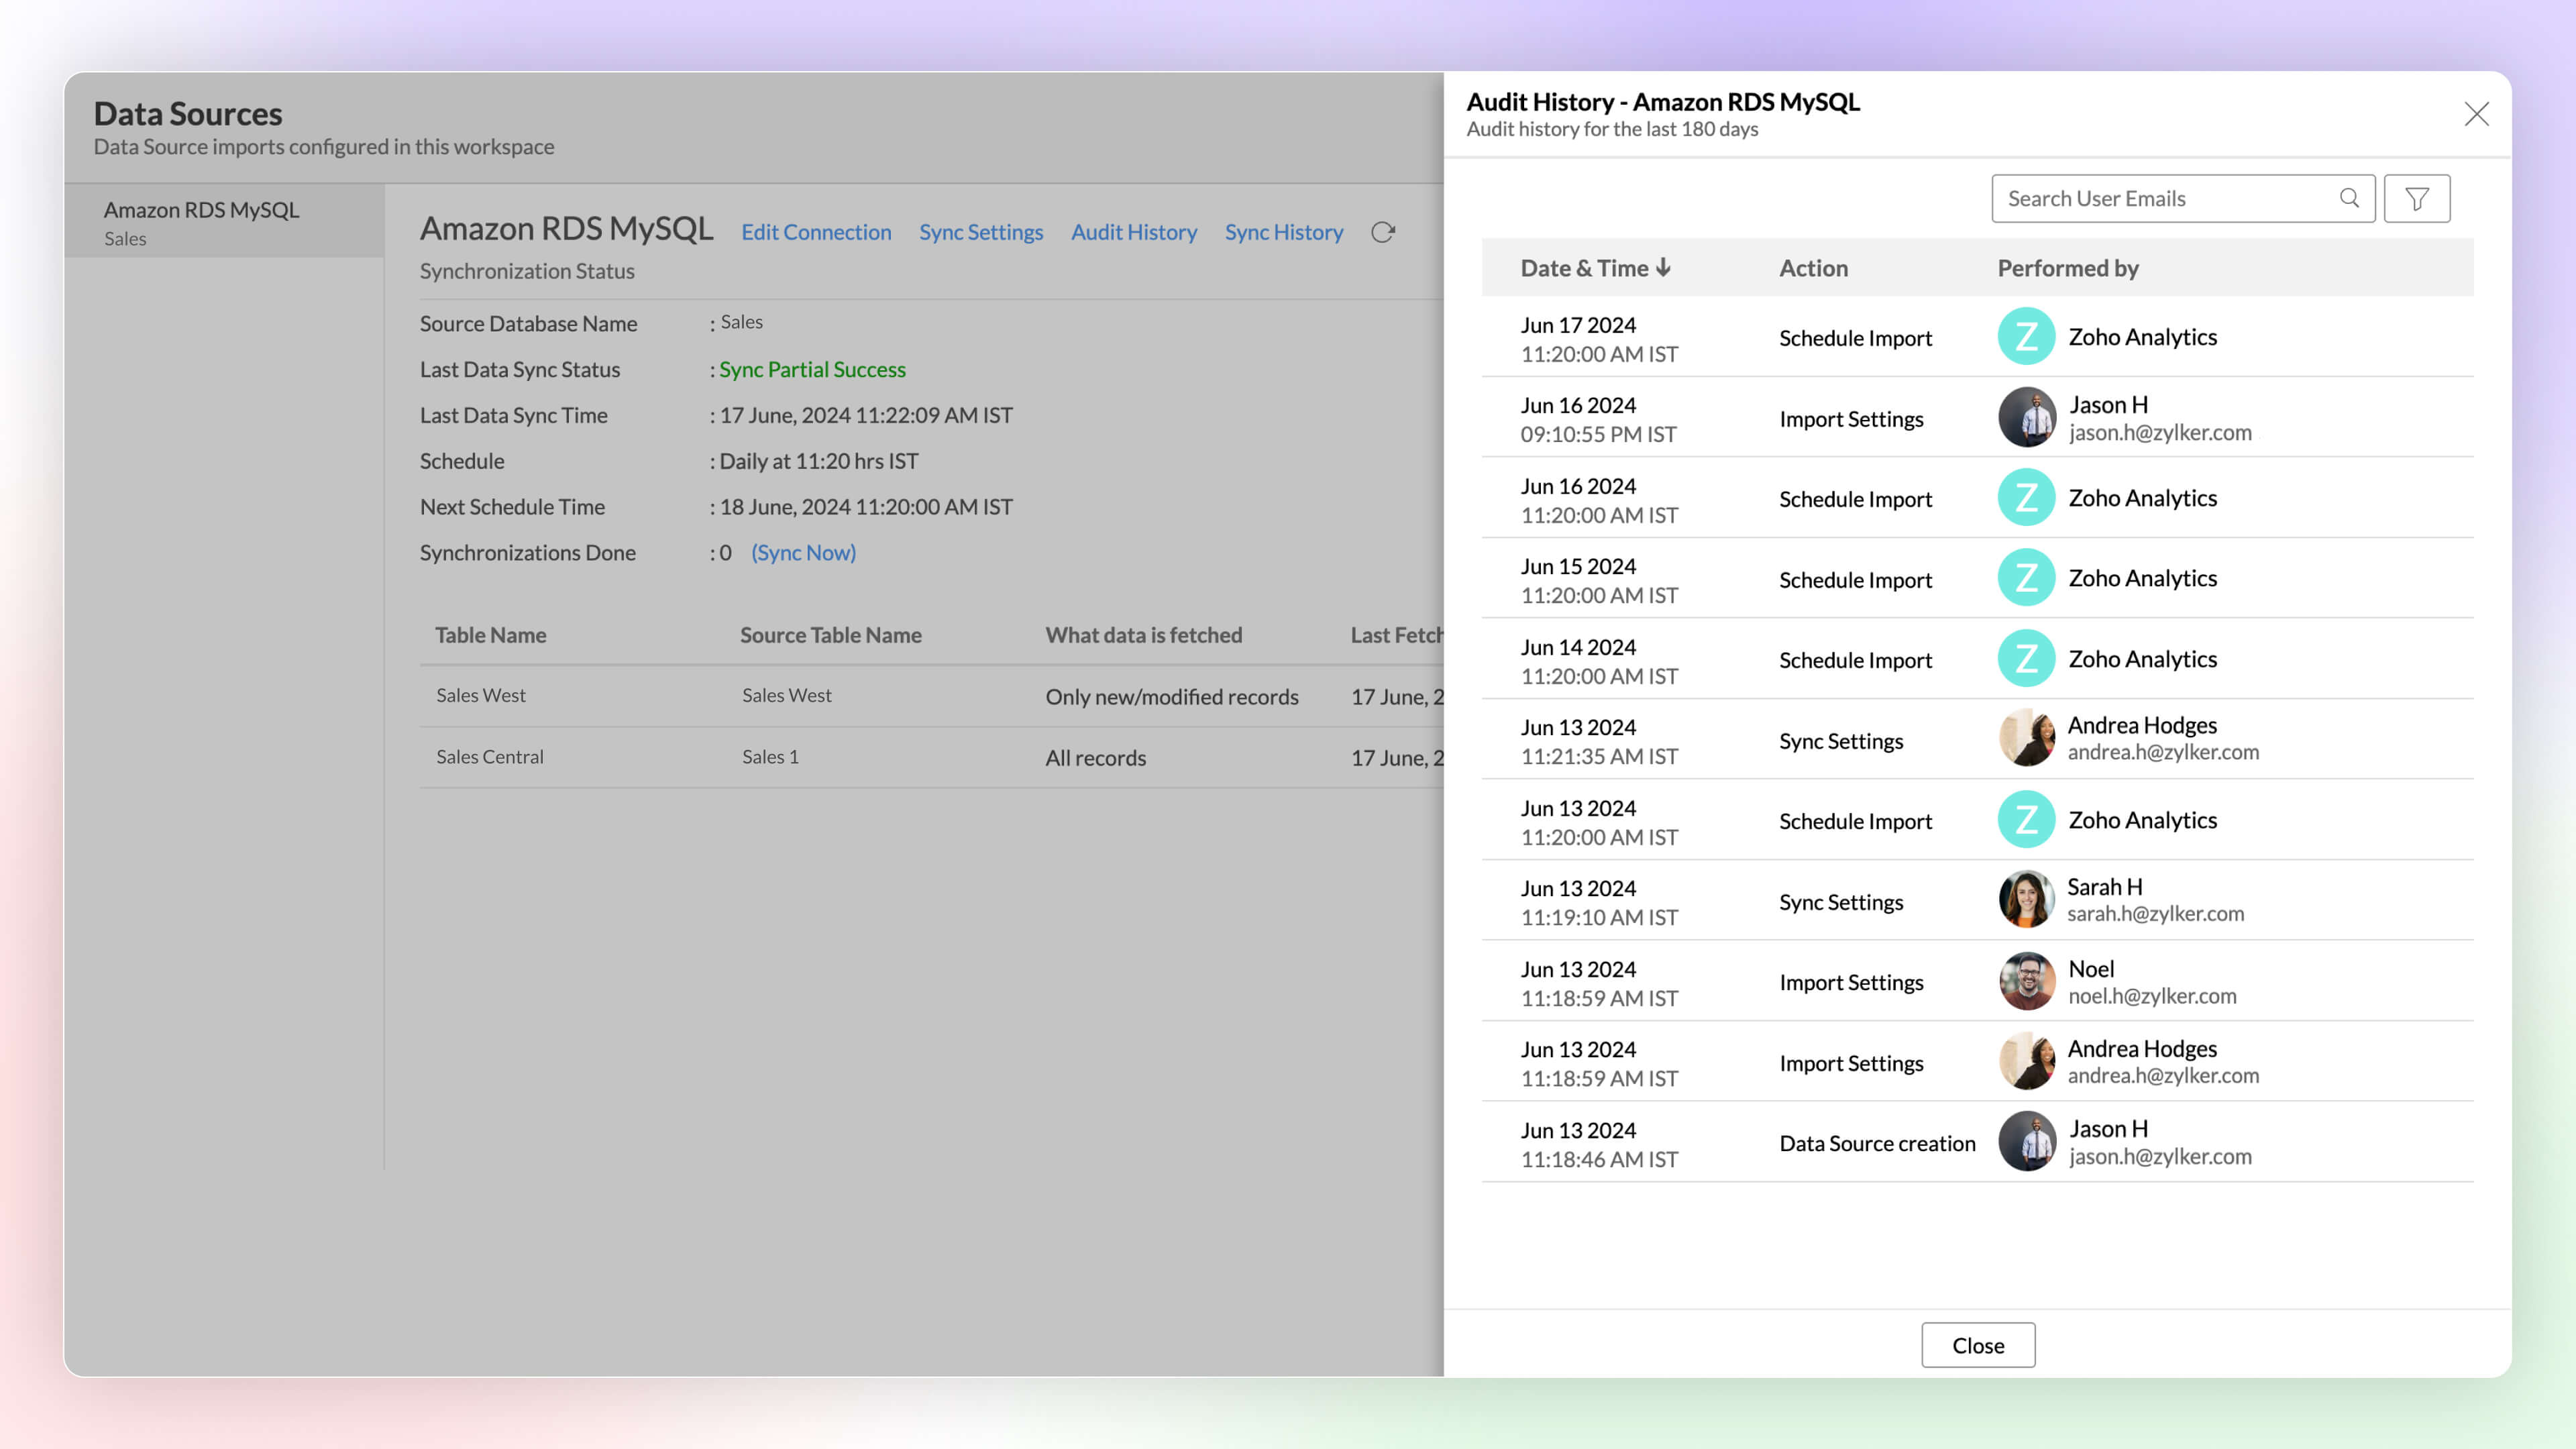
Audit History
Keep a full track of user and system activities using Audit History in Zoho Analytics. it helps you ensure security and resolve issues easily, using the timestamps and details of the administrator responsible for each action.
Click here to learn more.
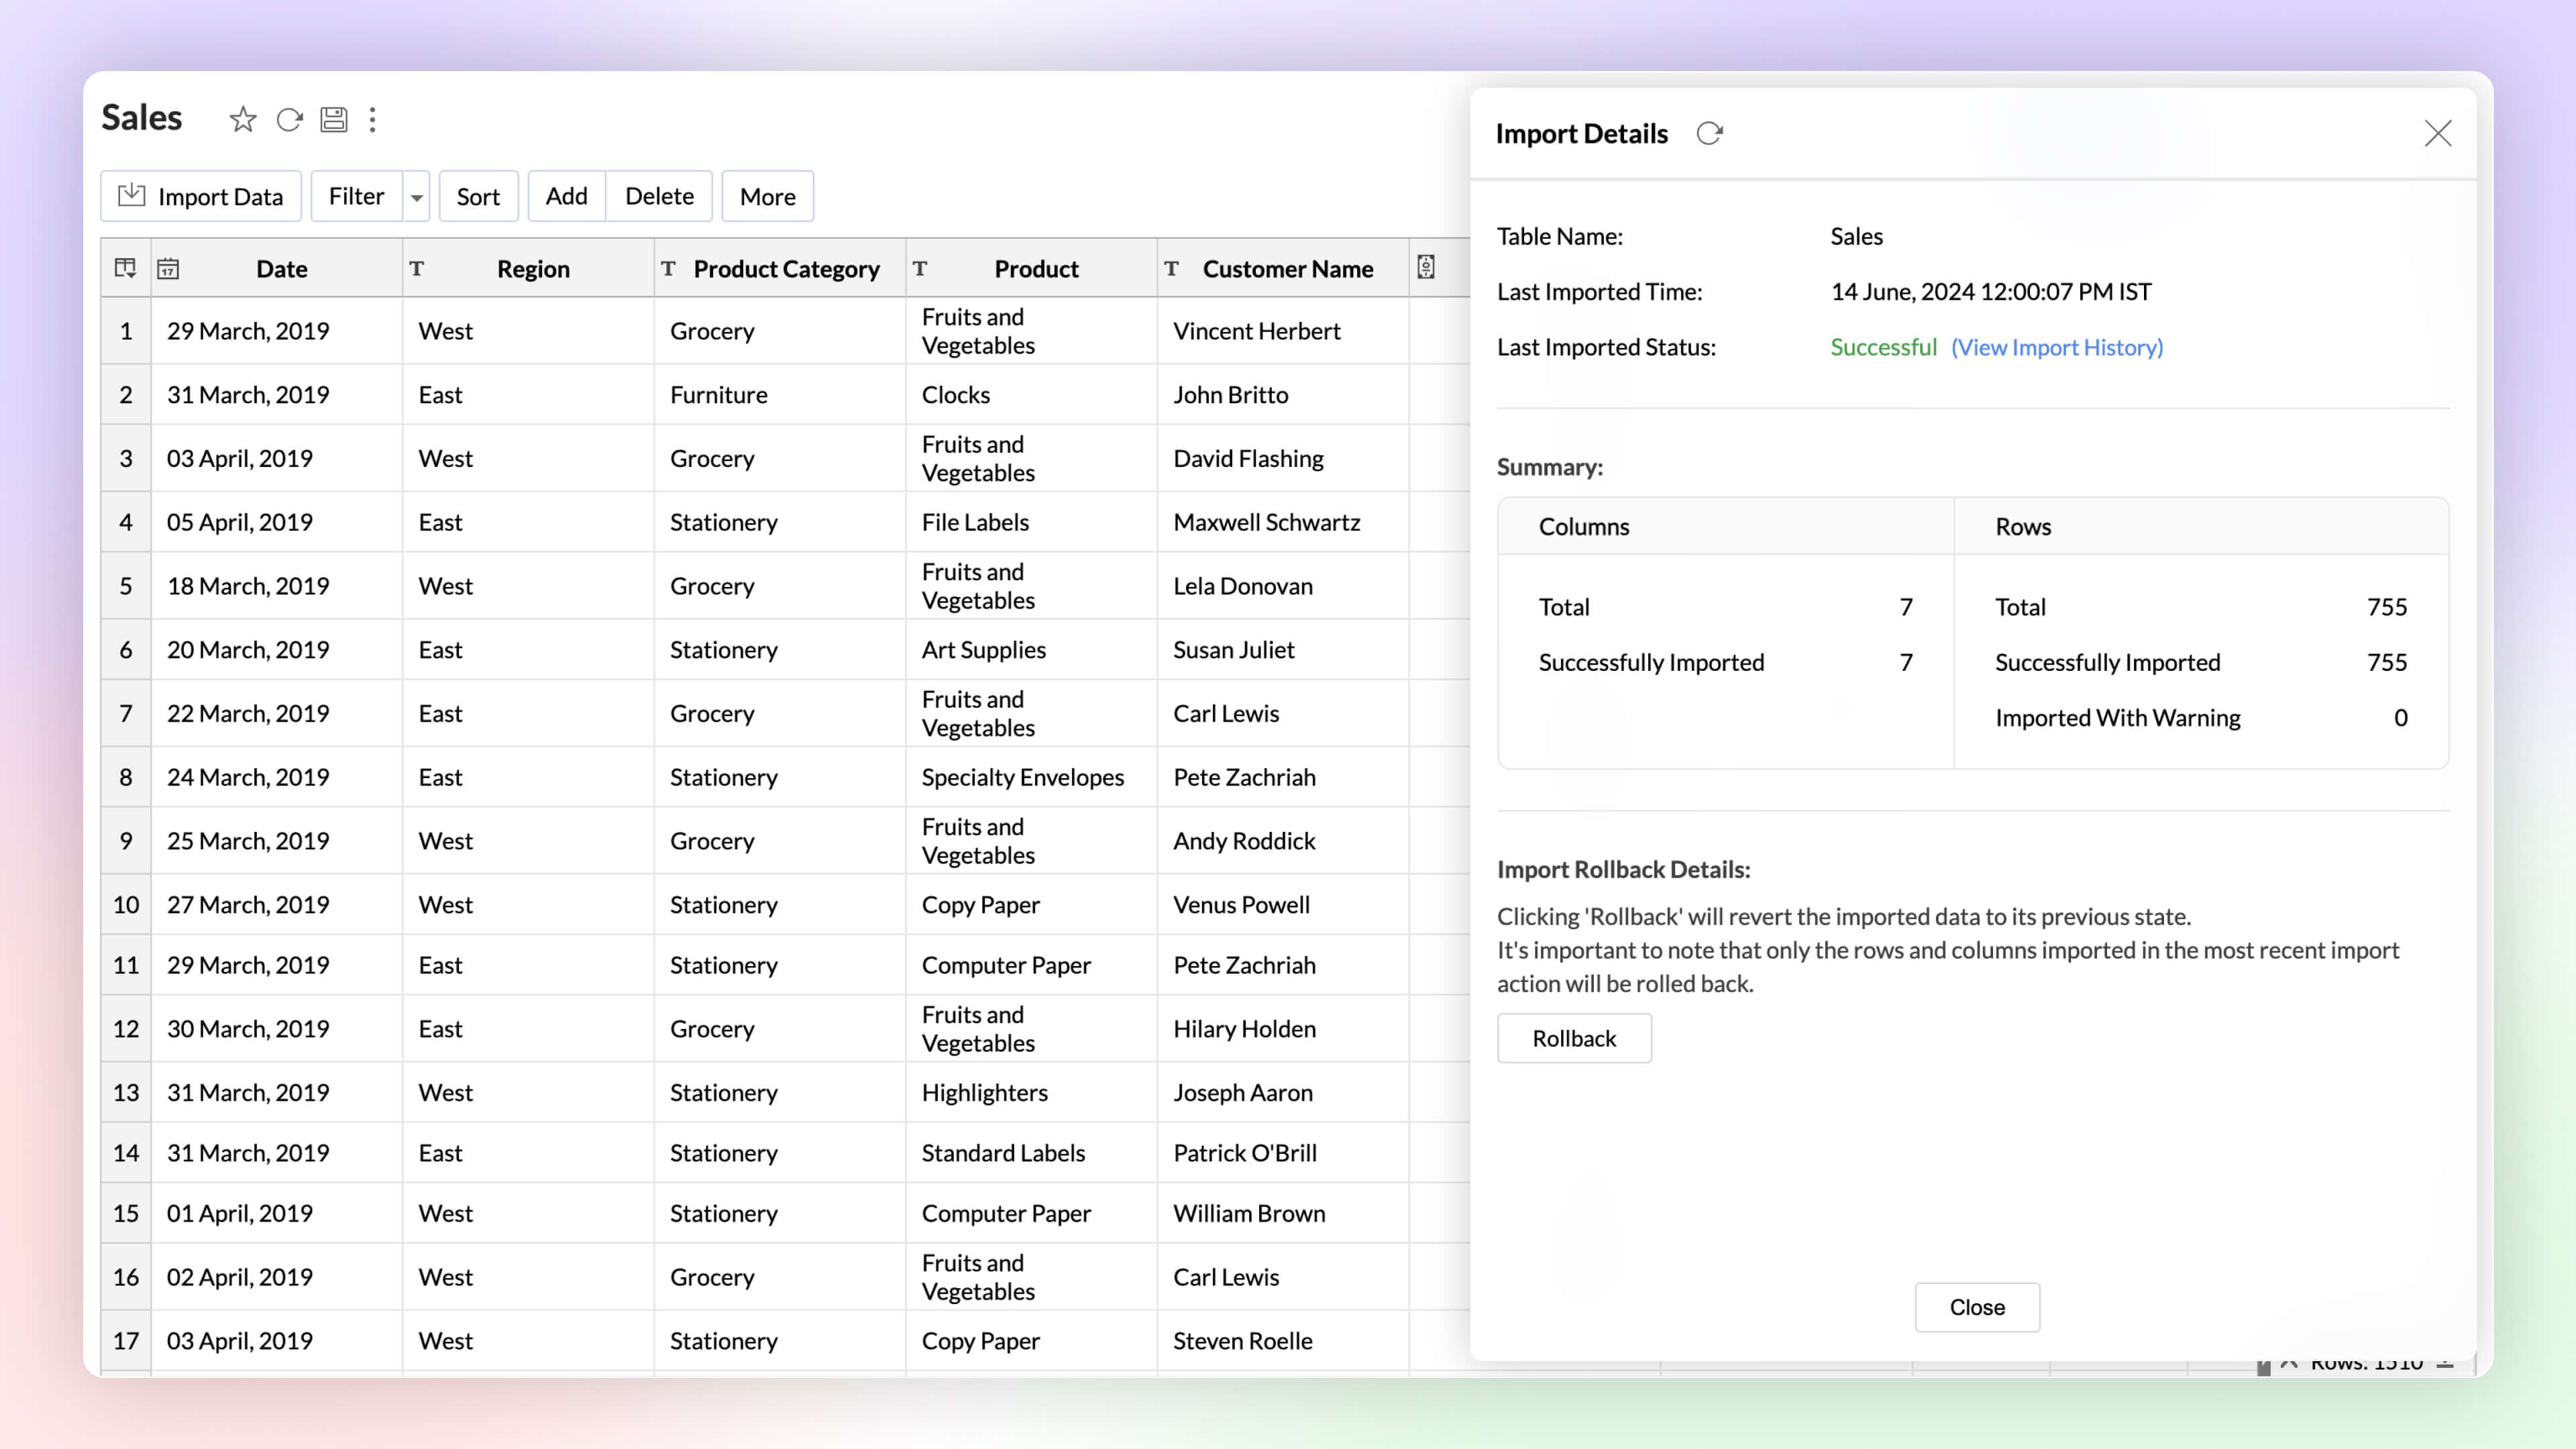
Undo Import Enterprise Plan
Automated imports can sometimes have errors and inconsistencies in data, and this can affect the data quality and the results. The import rollback capability reverts the current data import version to its previous version without affecting the existing data flow and analysis, ensuring data integrity.
Click here to learn more.
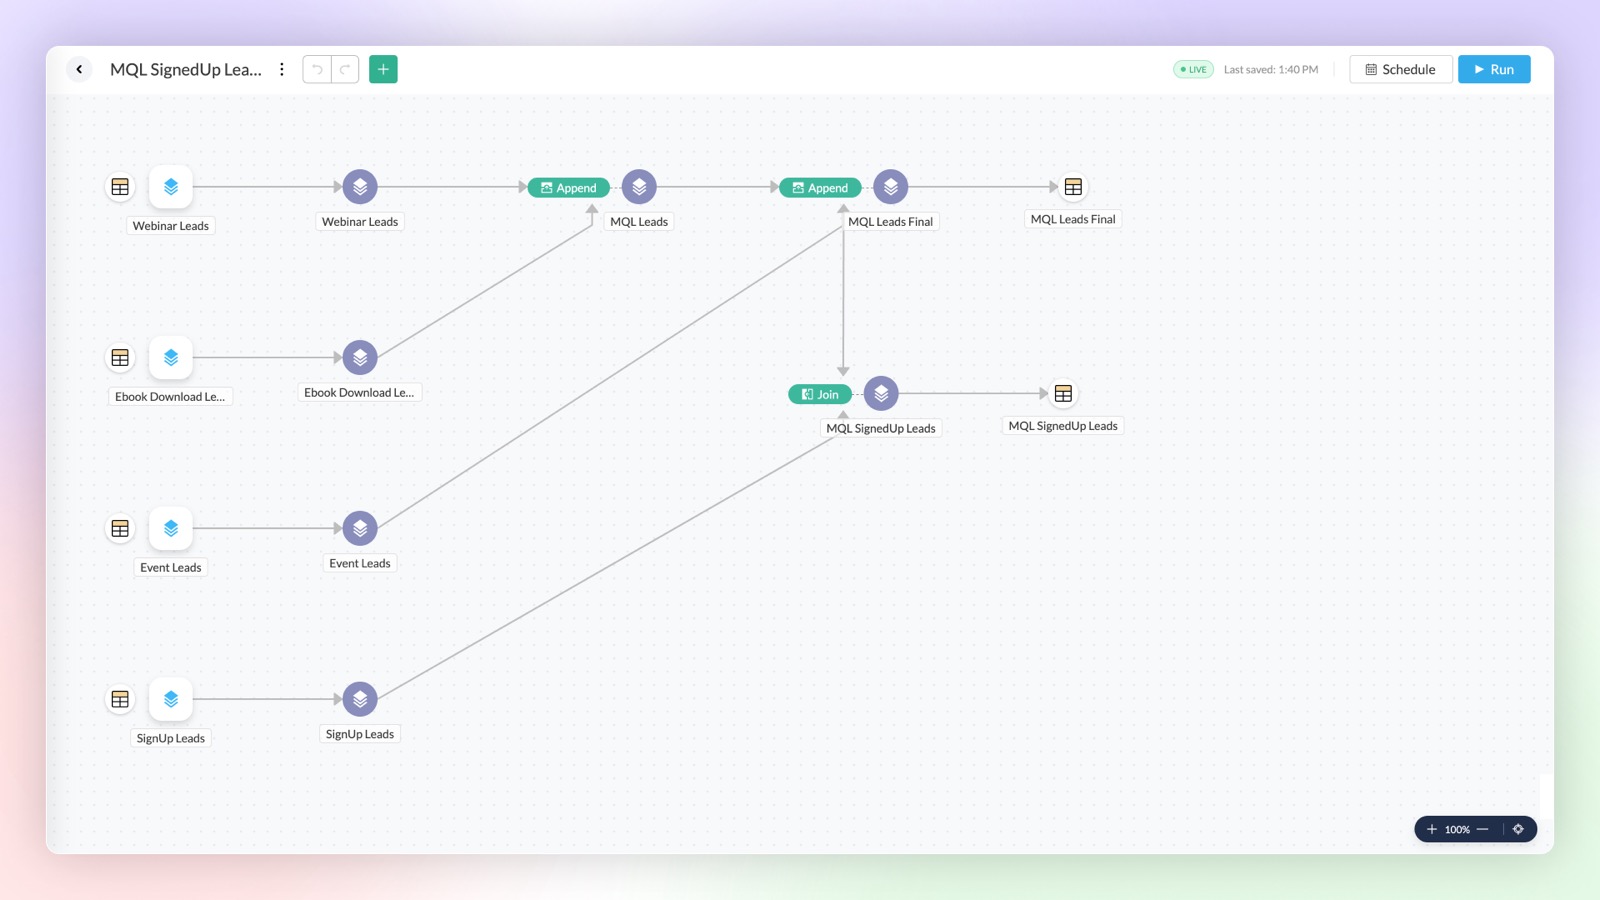
Data Pipelines Premium Plan
Set up and create data pipelines to setup powerful transformations on your datasets. You can create data pipelines with the no-code visual pipeline builder and perform various transforms on your data like join, append, pivot, and unpivot.
Click here to learn more.
Multiple Schedule Intervals for Tables
Syncing multiple tables at the same interval, just because they share a source, isn't always optimal. That's why we've introduced flexible scheduling options per connection. Now, each table can have its own unique sync interval, allowing you to better meet its specific requirements.
Click here to learn more.
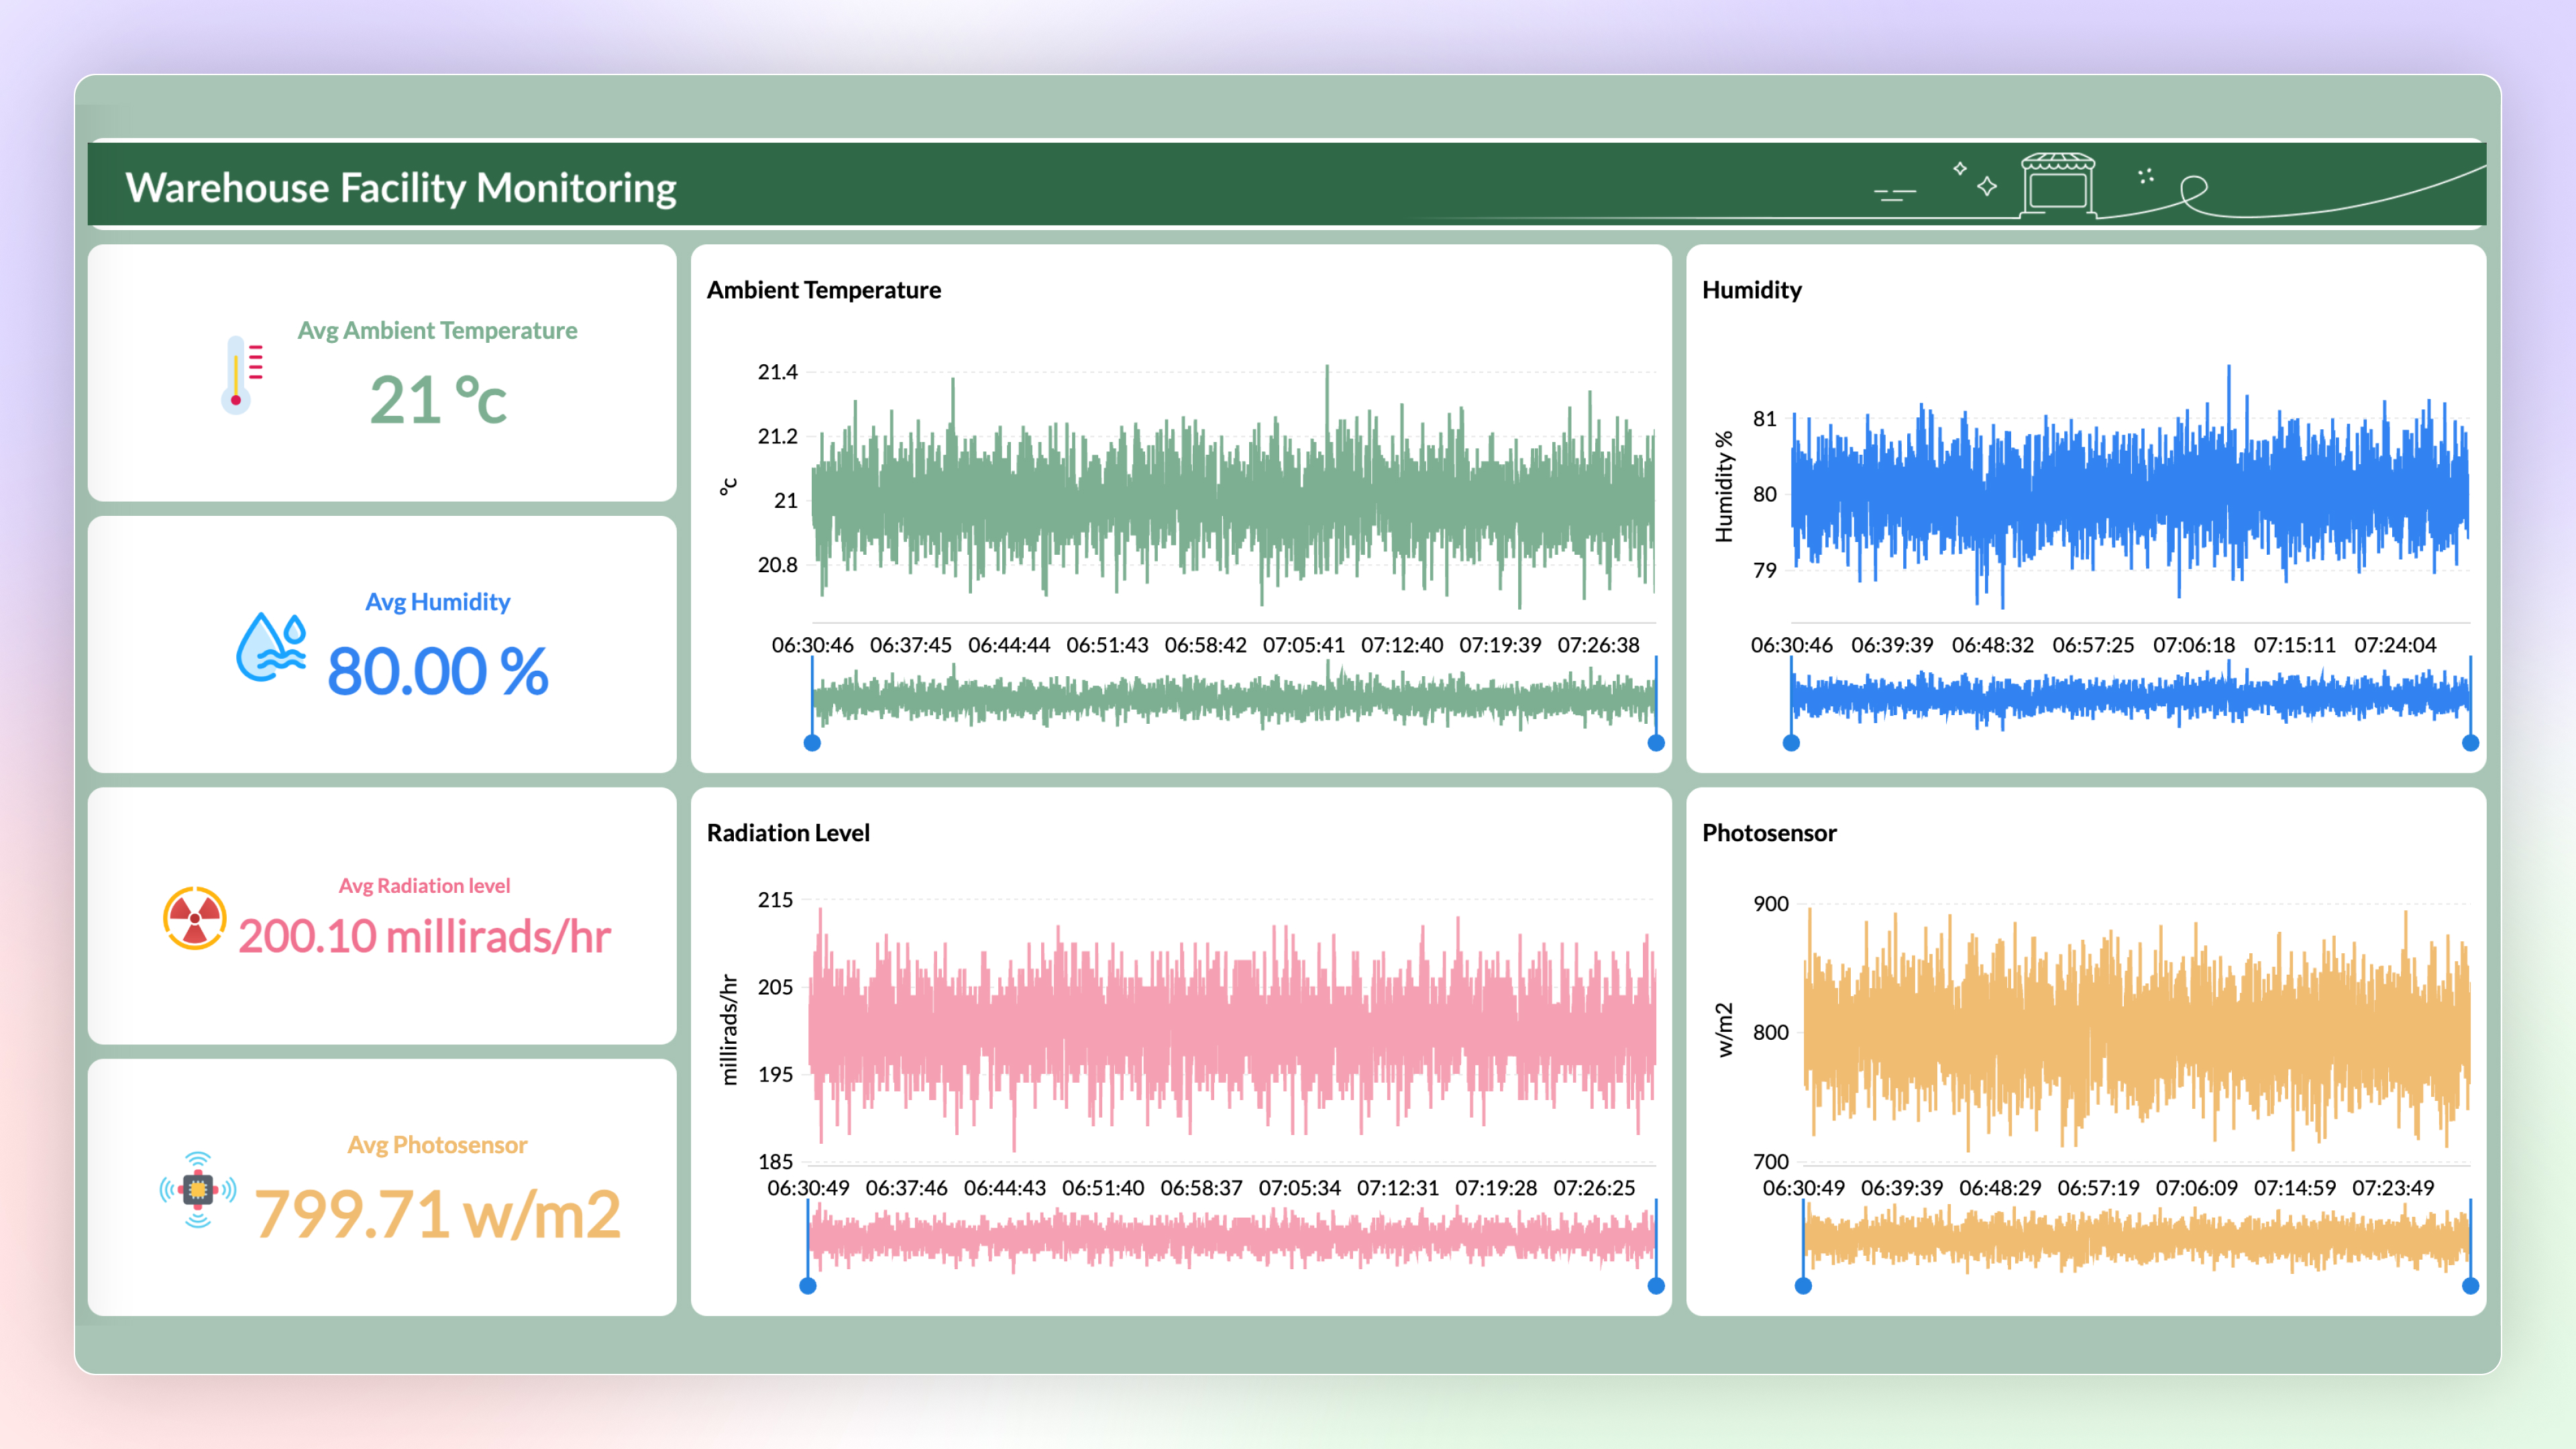
Stream Data Processing Premium Plan
Now you can use Stream Analytics to analyze the data from live streams. The data can be streamed into Zoho Analytics using API and Google Pub-Sub Push Subscription and can be visualized using Zoho Analytics to get real-time insights.
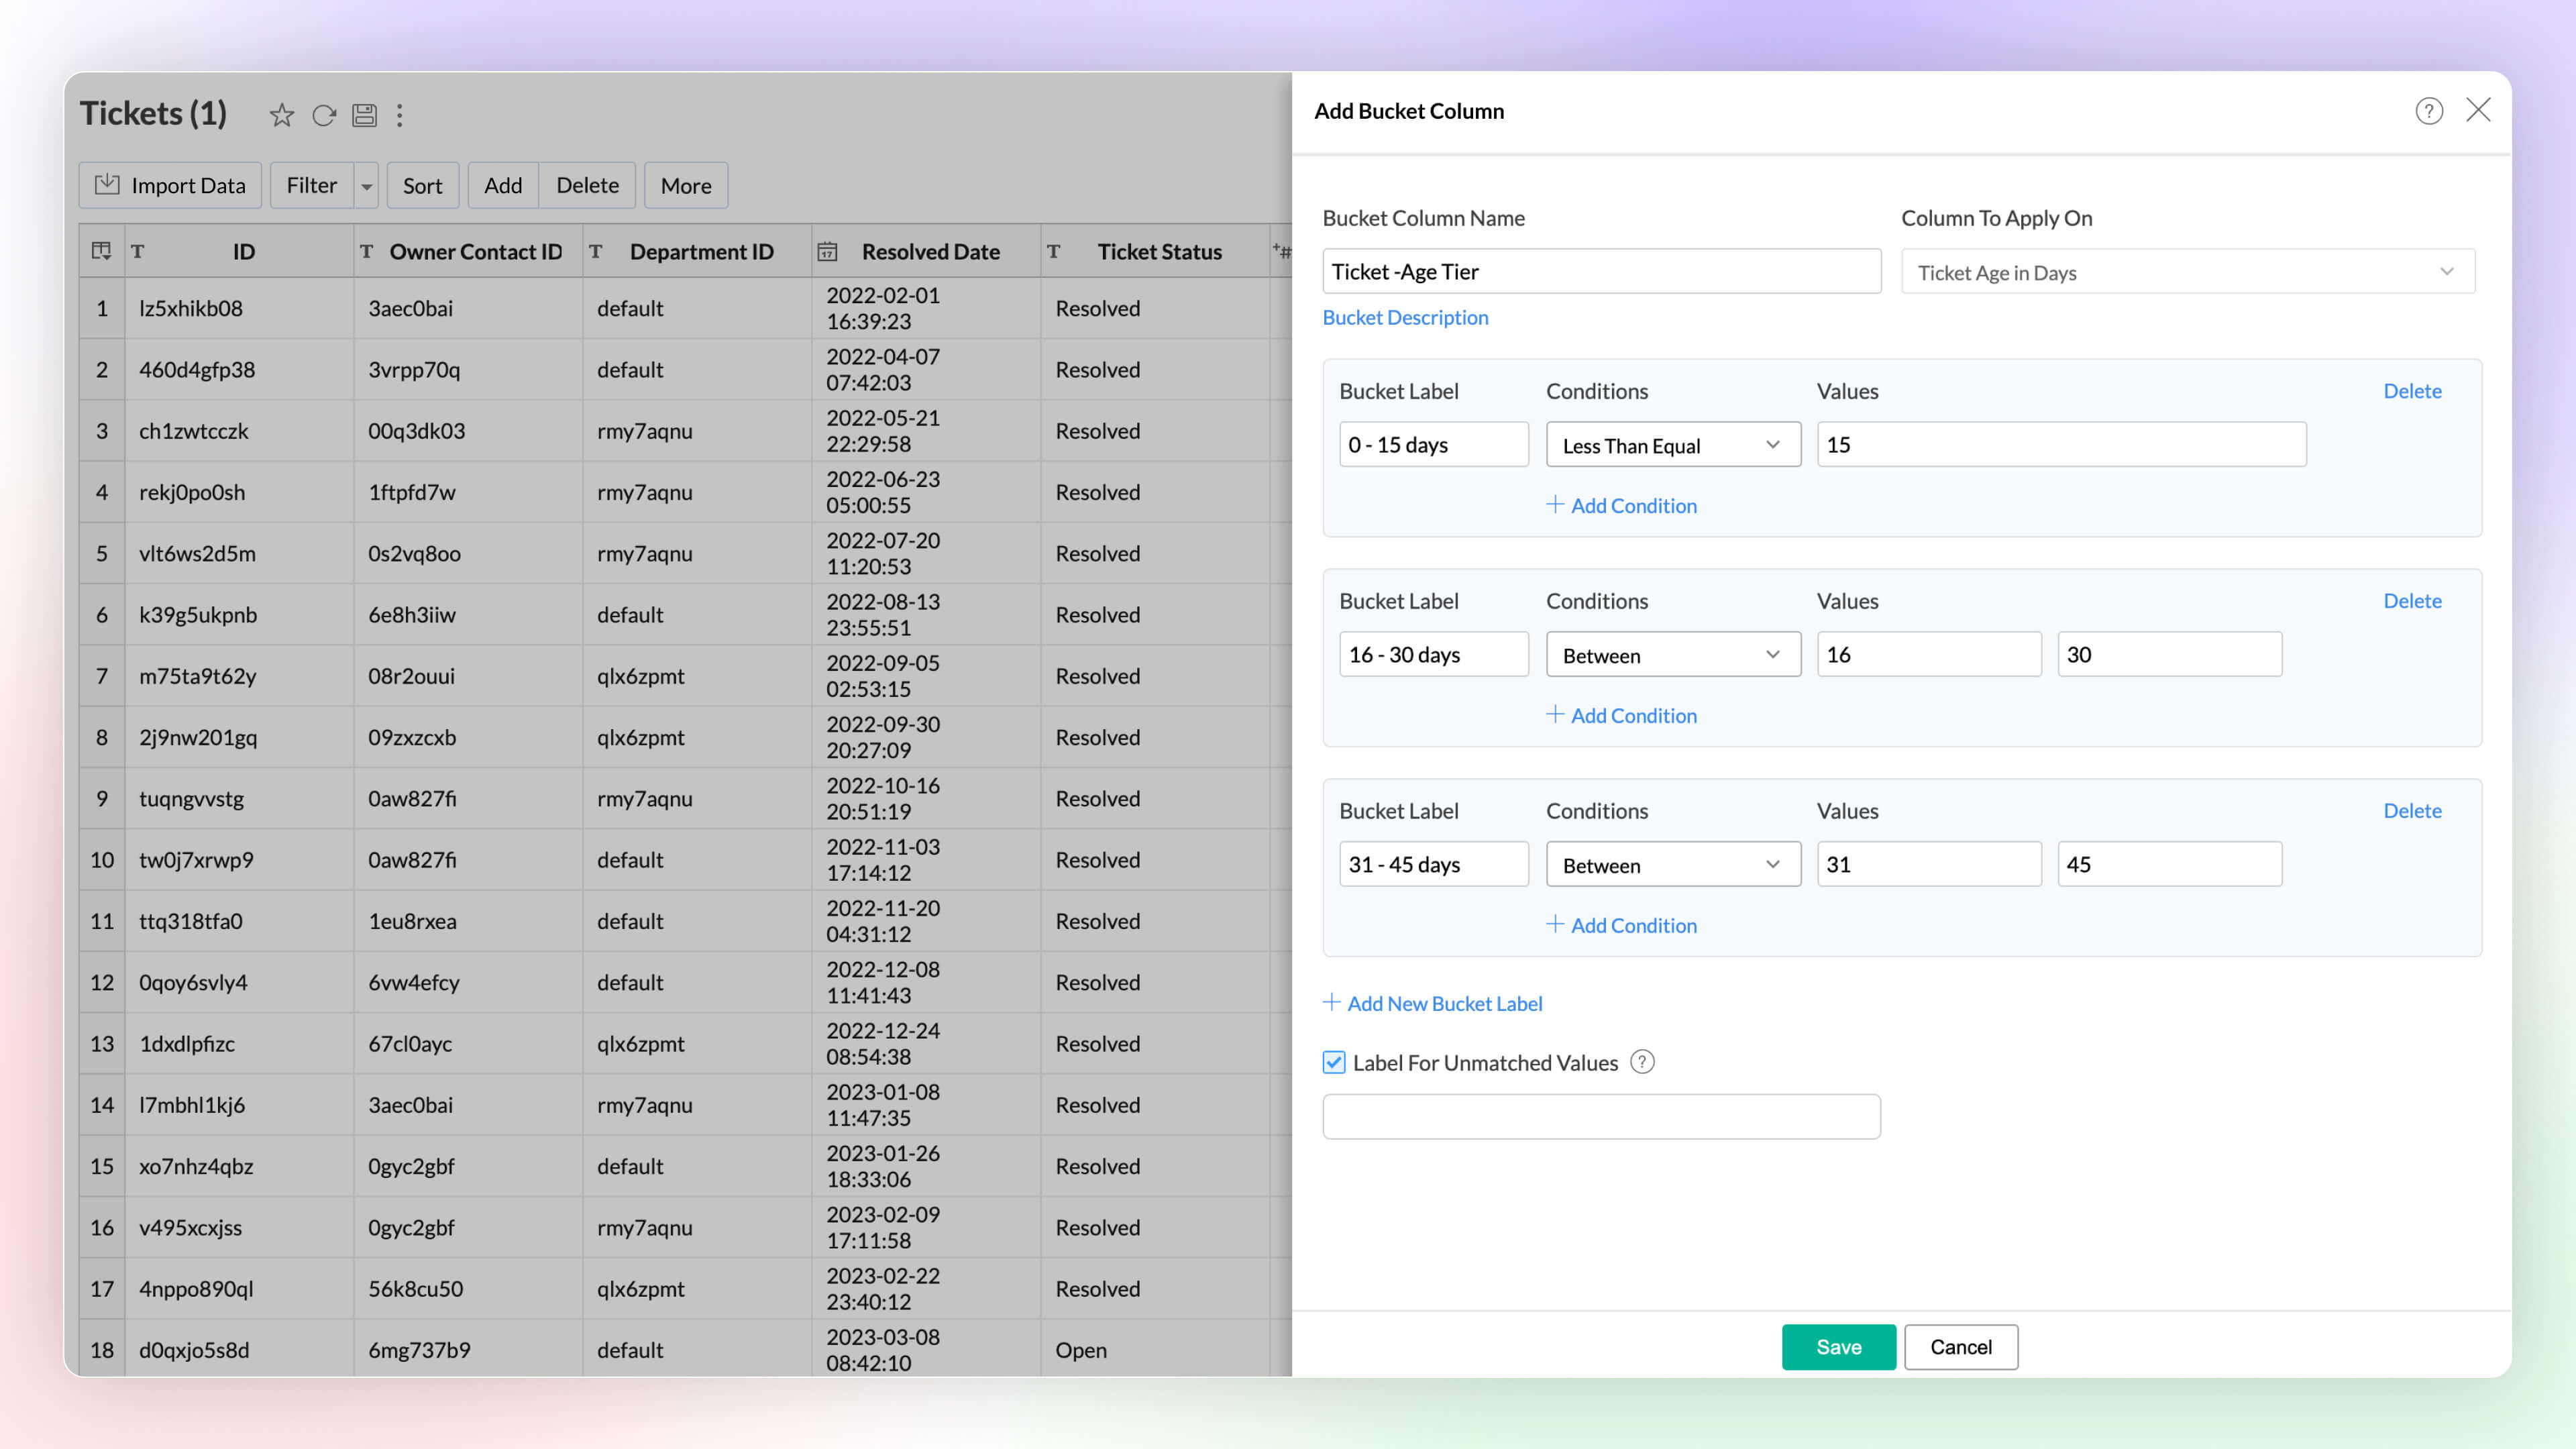
Data Bucketing
Data bucketing in Zoho Analytics allows you to transform your data into categorical bins, reducing distinct values and simplifying analysis. This feature, now built-in, replaces the need for complex formulas.
Click here to learn more.
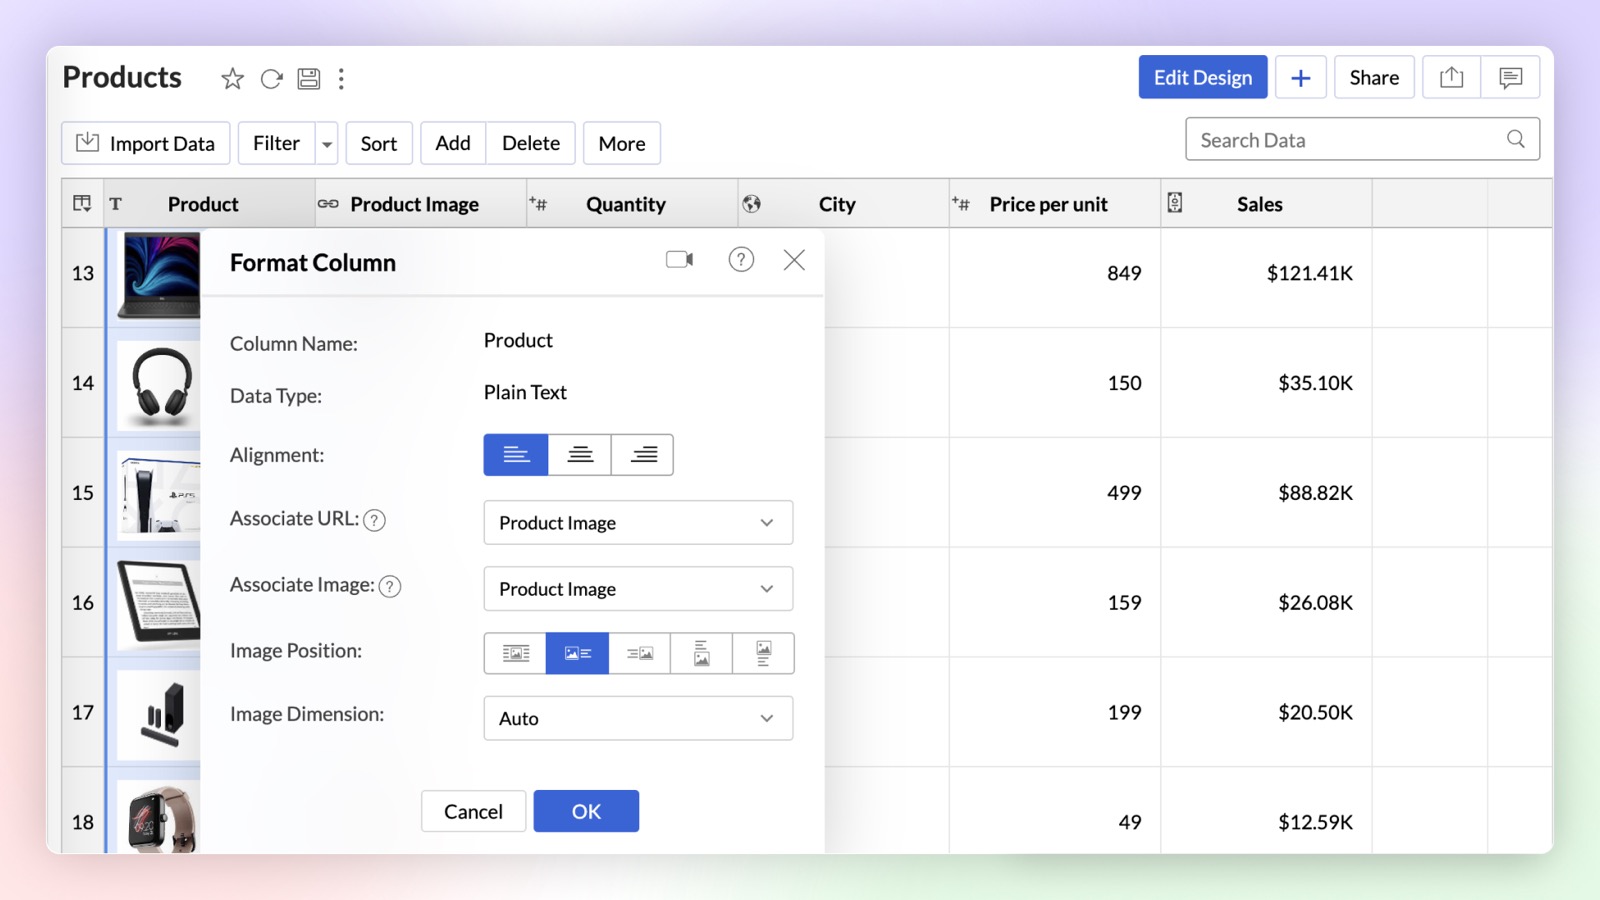
Dynamic Image / URL
You can now dynamically associate a URL column with a text column in Zoho Analytics. On associating URL as a link or image, the text column will be either hyperlinked or an image will be displayed alongside the text.
Click here to learn more.
Unified Metrics
Unified Metrics in Zoho Analytics consolidates and standardizes all the metrics (aggregates) from different data sources/tables in a workspace. Now you can promote consistency and avoid duplication of metrics across the tables with ease.
Click here to learn more.
Real-time data sync for Zoho CRM Enterprise Plan
You can now analyze up-to-the-minute CRM data in Zoho Analytics. Zoho CRM users can use the Advanced Analytic connector for Zoho CRM to analyze and visually present real-time data effortlessly.
Dataiku Plug-in
You can now analyze and visualize data in Dataiku ML models using the Zoho Analytics Plugin in Dataiku. Zoho Analytics plugin is now available in Dataiku Plugins page.
Enhancement in Live Connect
Zoho Analytics now allows data sources with Live Connect to be added to workspaces alongside other data sources. Previously, Live Connect sources could not be combined with other data sources in the same workspace.
Click here to learn more.
Visual Analytics
Chart Enhancements
New Chart Types
Zoho Analytics supports 7 new chart types (on top of 50+ existing ones) with extensive customization options to enhance the presentation and interpretation of the data.
- Sankey charts Sankey charts are ideal for visualizing data flow between nodes and tracking event movement through connected lines. In Zoho Analytics, you can customize node and link colors, adjusting them individually or globally, and set link colors based on source or target nodes. You can choose a basic Sankey chart for simple flows or an Alluvial Chart for complex, multi-stage flows.
- Racing charts are animated views that are best suited for visualizing the changes in the data over a period of time where the relative ranking of categories is important. They highlight and help comprehend the fluctuations and progression in the data. These types of charts grab the user's attention instantly, providing an immersive experience and helping craft a compelling story about the data.
- Spark lines are compact charts that show the trends and variations in the data without taking up much space. They are widely used alongside pivot tables and help grasp trends and allow quick comparison of metrics across different fields. Zoho Analytics supports three variations that includes line chart, area chart, and bar chart.
- Geo Map Layering, add multiple data layers to the geo map to visualize various dimensions of information. This feature includes interactive options for enhanced data exploration.
- Sunburst charts represent hierarchical data through a series of rings, or concentric circles. Each ring corresponds to a level in the hierarchy. The central or innermost circle represents the root node, or the top-level category. Moving outwards, each subsequent ring represents a subcategory, where the outermost ring is the leaf node. The size of each arc in the ring is proportional to the value of the data.
- Conversion bar charts show the connected stages of a process and the gradual decrease in data as it moves through different stages of the process. Each stage is represented by a bar, with a step or stair case pattern indicating the shift in values (along with conversion percentage) at each stage.
-
Tree Map is a visualization composed of differently-sized rectangles that represent your data values. This is beneficial when you want to depict the part to whole relationship among various categories.

Interactive Chart Customizations
Experience real-time updates as you customize your chart with the new Chart Settings interface, now available on the right side pane. It provides enhanced customization options with live visual feedback.
Click here to learn more.
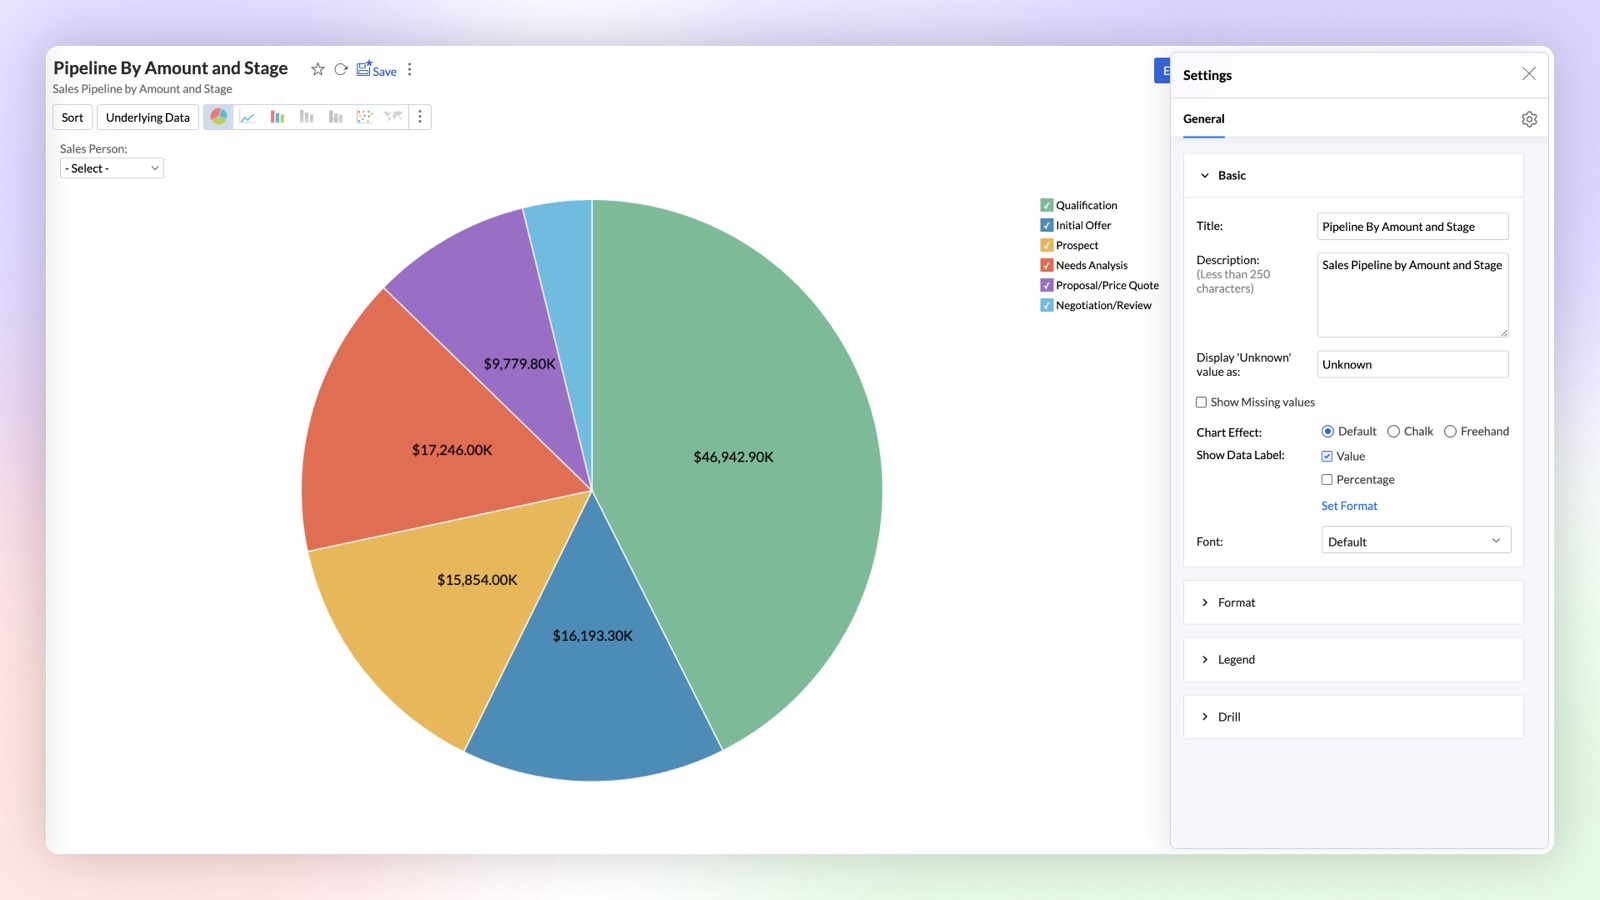
Chart Creation as API
Chart creation APIs in Zoho Analytics allow you to programmatically generate various types of charts by customizing data inputs, applying filters, and configuring chart properties. These APIs offer flexibility to create dynamic visual reports directly through code.
Pivot enhancements
Conditional Formatting over other columns in Pivot
This enhancement empowers you to create more dynamic and insightful Pivot Tables by allowing you to apply conditional formatting rules over any column based on the values of another column.
Click here to learn more.
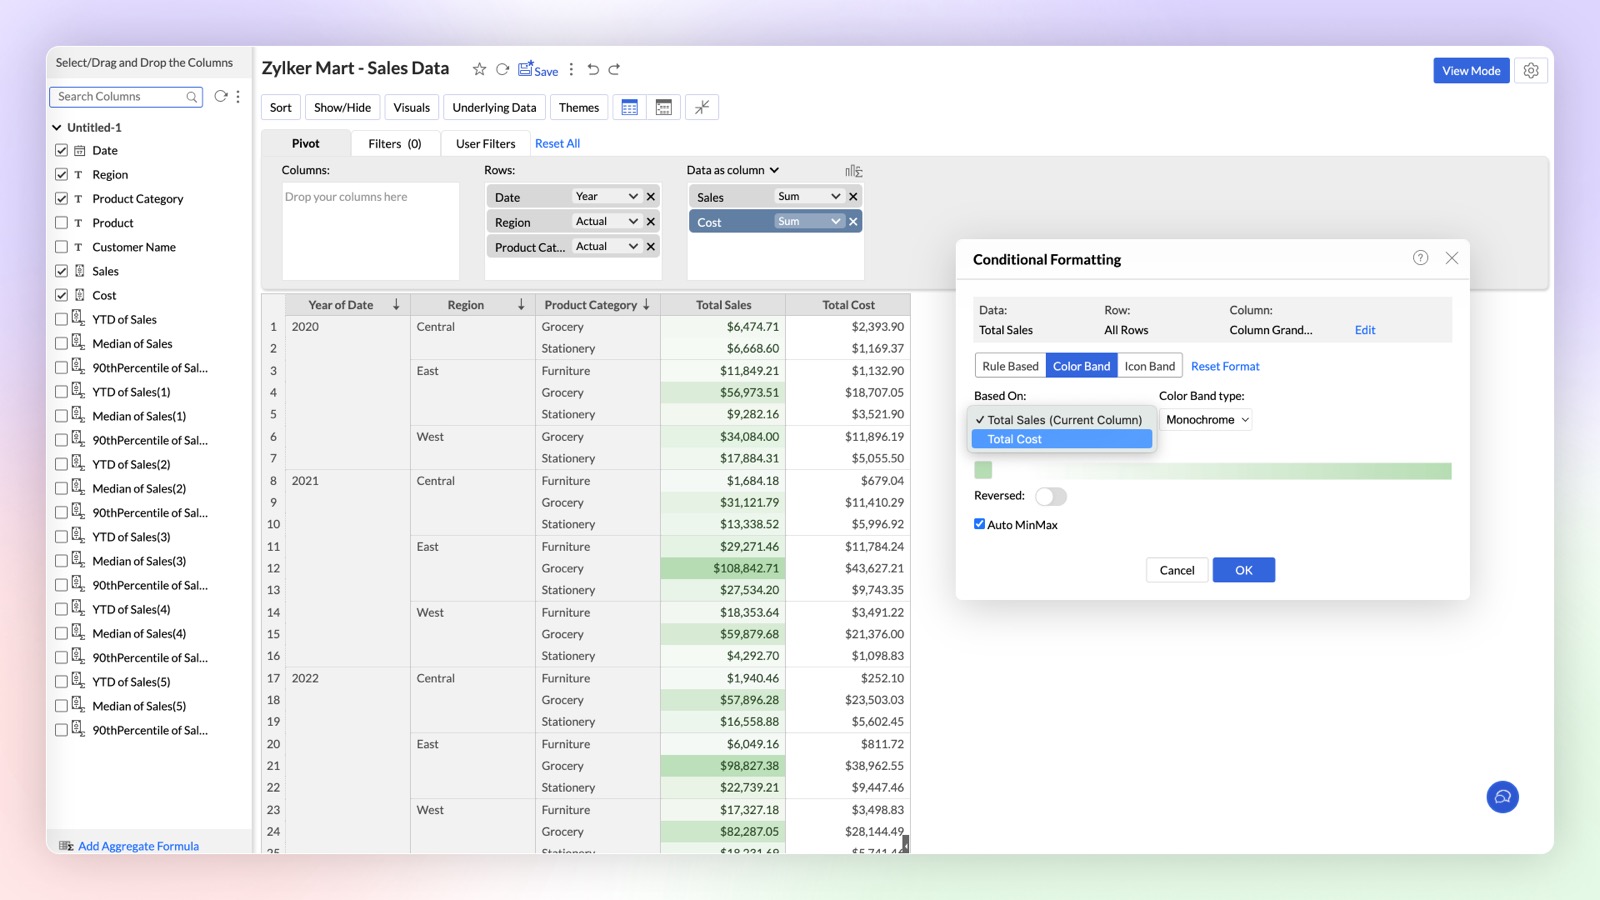
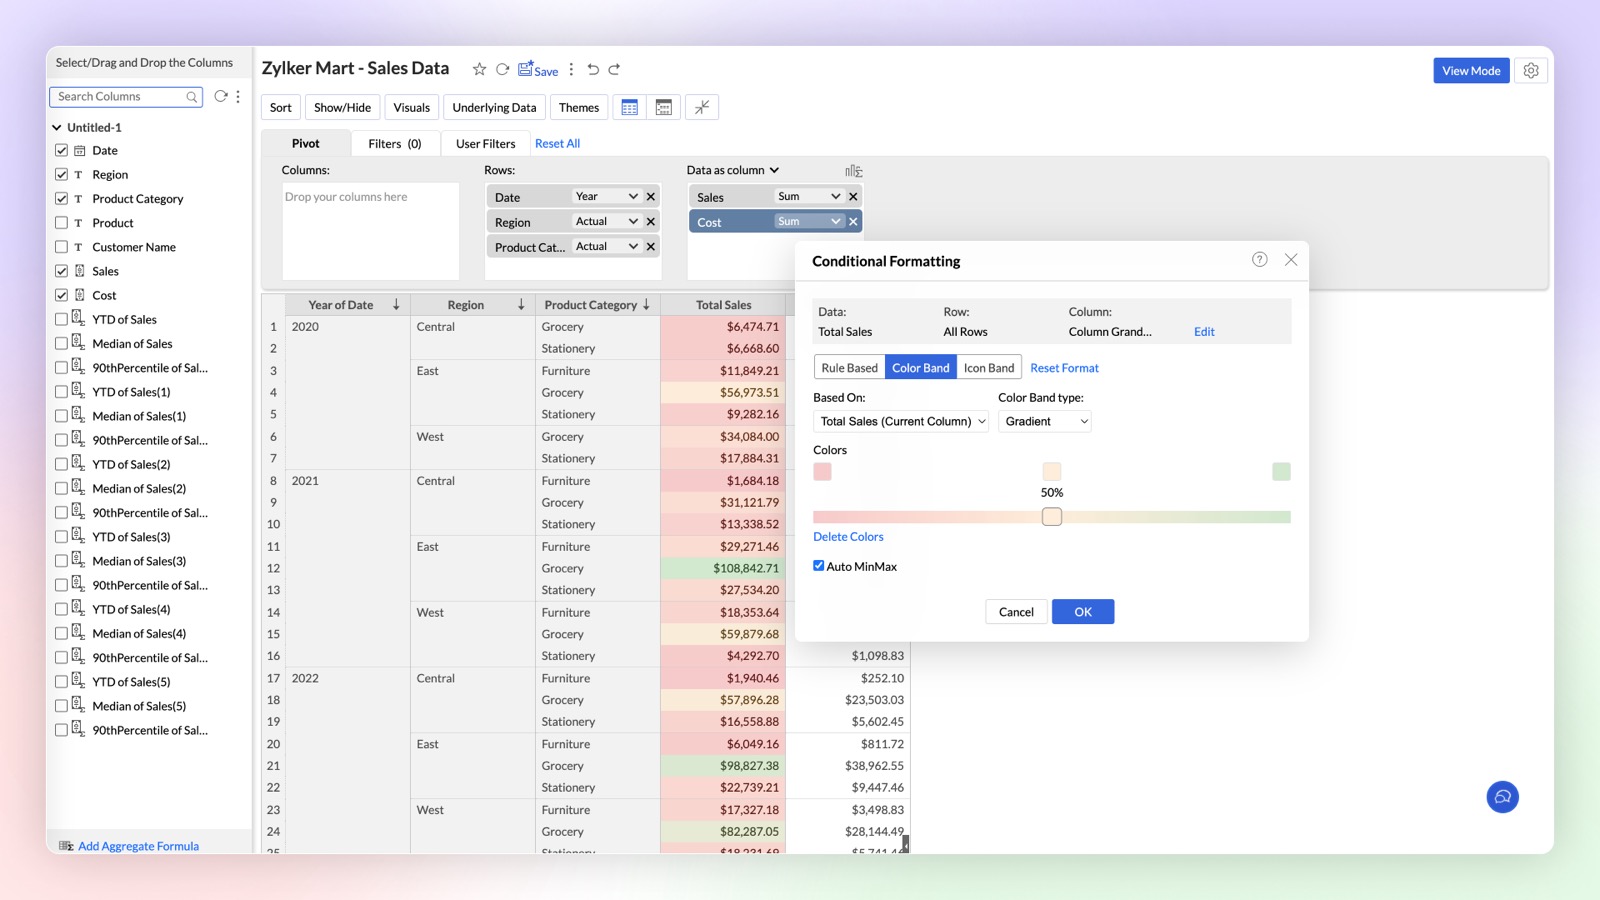
New Conditional Formatting: Color & Icon Bands
Zoho Analytics introduces enhanced Conditional Formatting with Color and Icon Bands in Pivot Tables. This update brings a new level of visual customization, allowing you to highlight critical data points and enhance data comprehension directly within your Pivot Tables.
Click here to learn more.
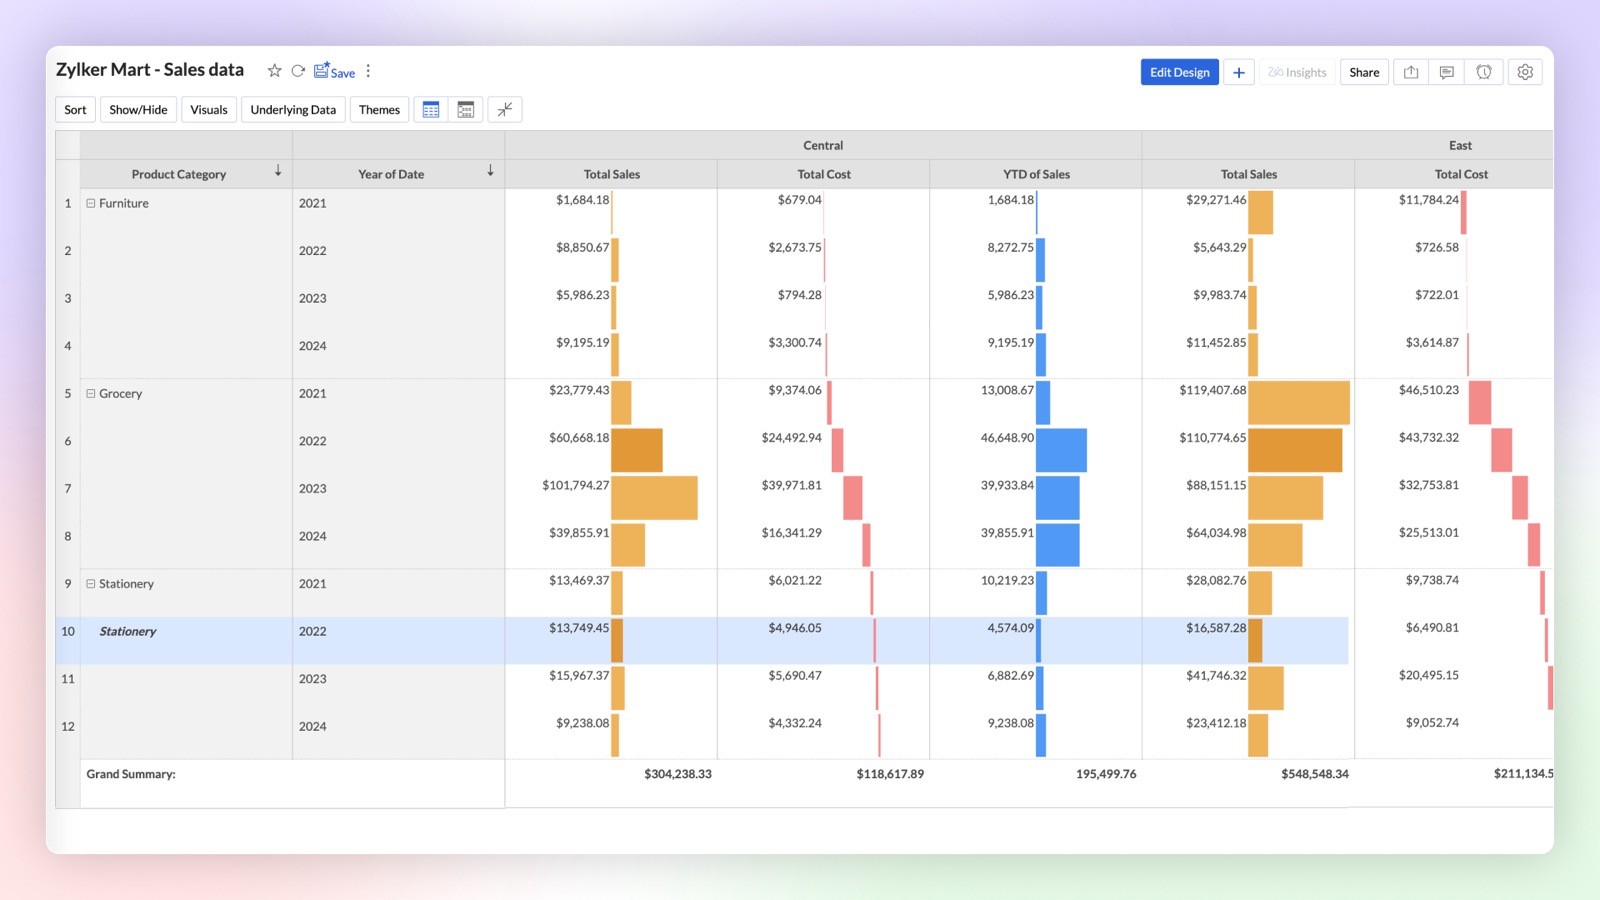
Data Bars & Waterfall Charts in Pivot
Introducing Data Bars and Waterfall (Bar Range) Charts in pivot tables to analyze complex data sets and highlight key insights directly within your pivot tables. Upgrade your data visualization game with Data Bars and Waterfall Charts in Zoho Analytics. Start transforming your Pivot Tables into powerful storytelling tools today!
Dashboard Enhancements
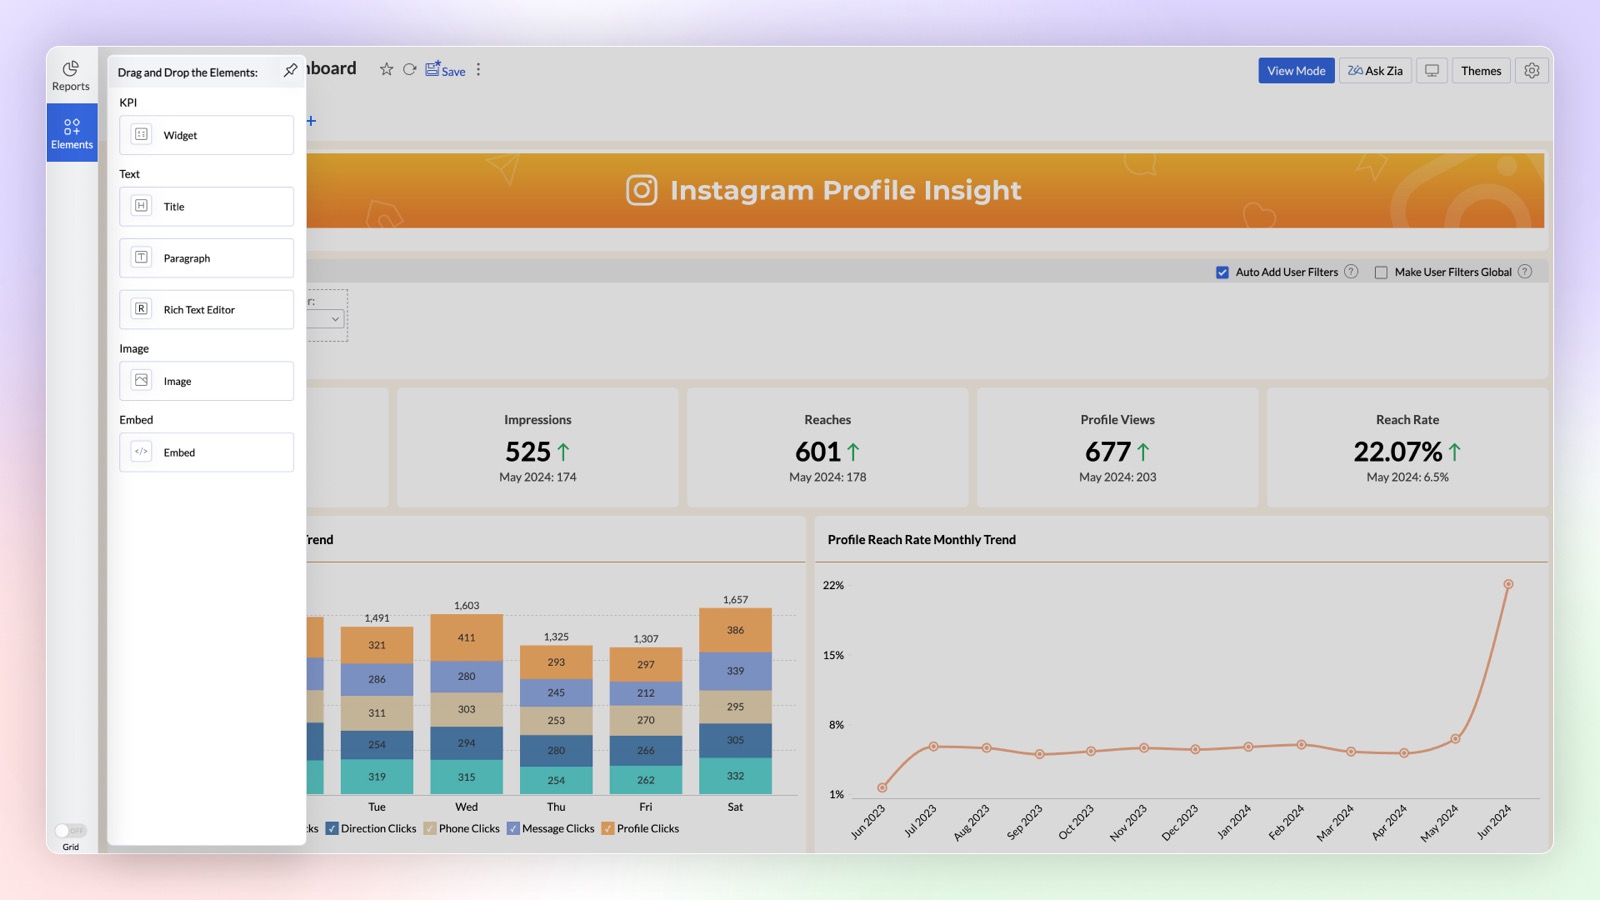
Add Elements in Dashboard
The Dashboard Designer interface now includes an "Add Elements" section for easily incorporating widgets, text, images, and embedded URLs into your dashboard. Simply drag and drop these elements to add them. The Text element offers enhanced formatting options, while the Image element features a built-in editor for direct image customization.
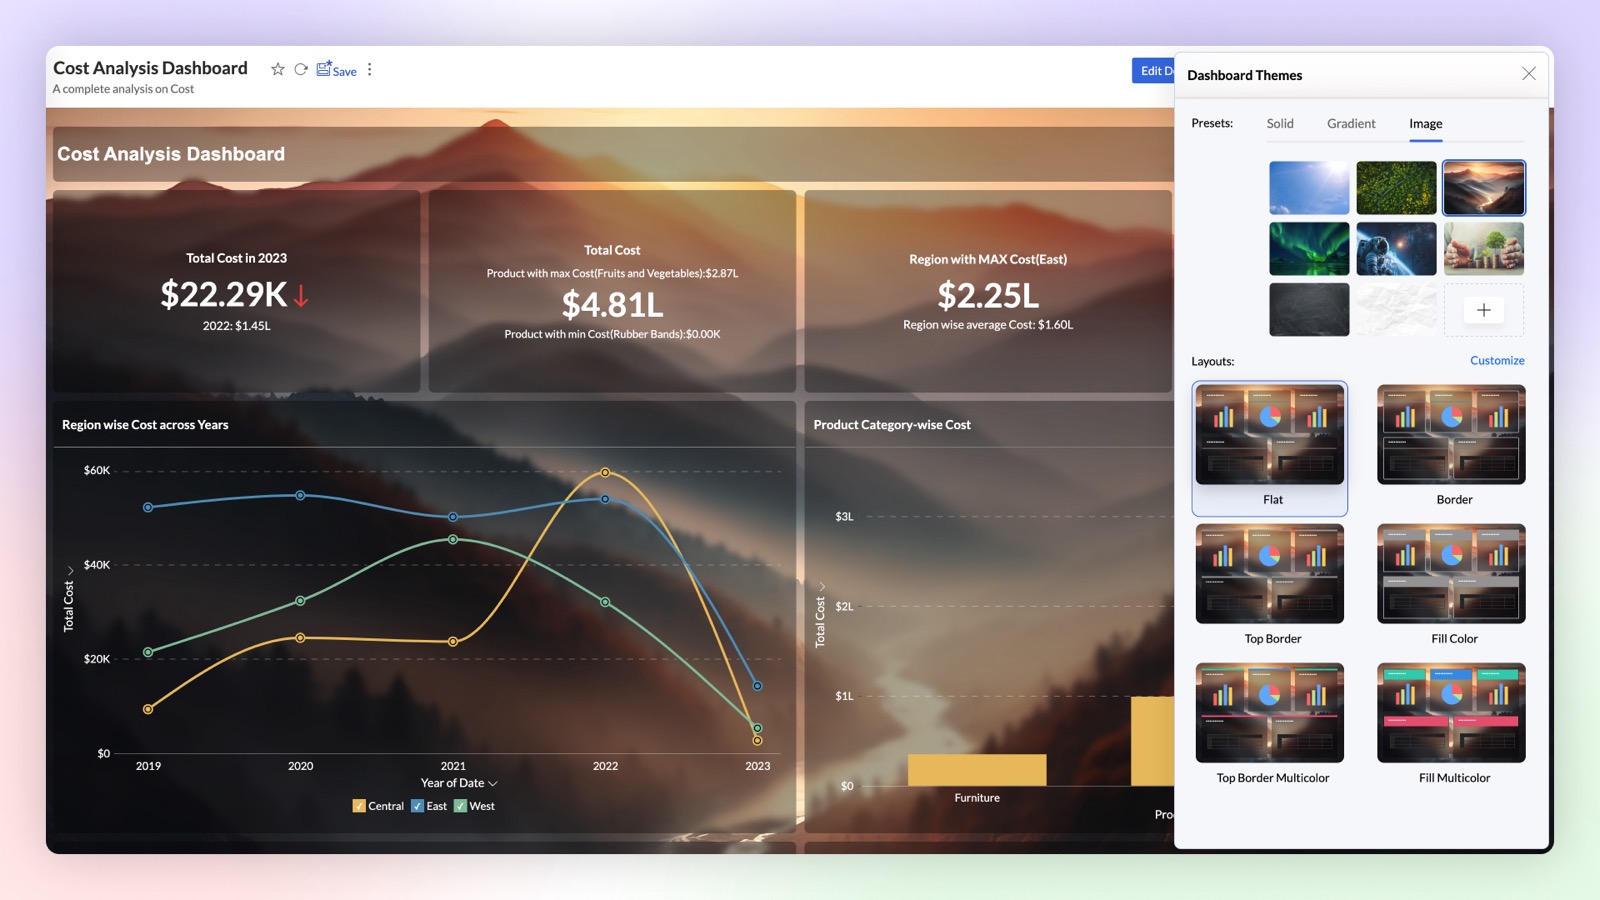
Enhanced Themes and Background in Dashboard
Want to create stunning dashboards with reports over transparent cards and image as background? Try our new themes and background card effect feature. With wide customization options to improve the visual aesthetics, this helps enhance the clarity of the reports and widgets.
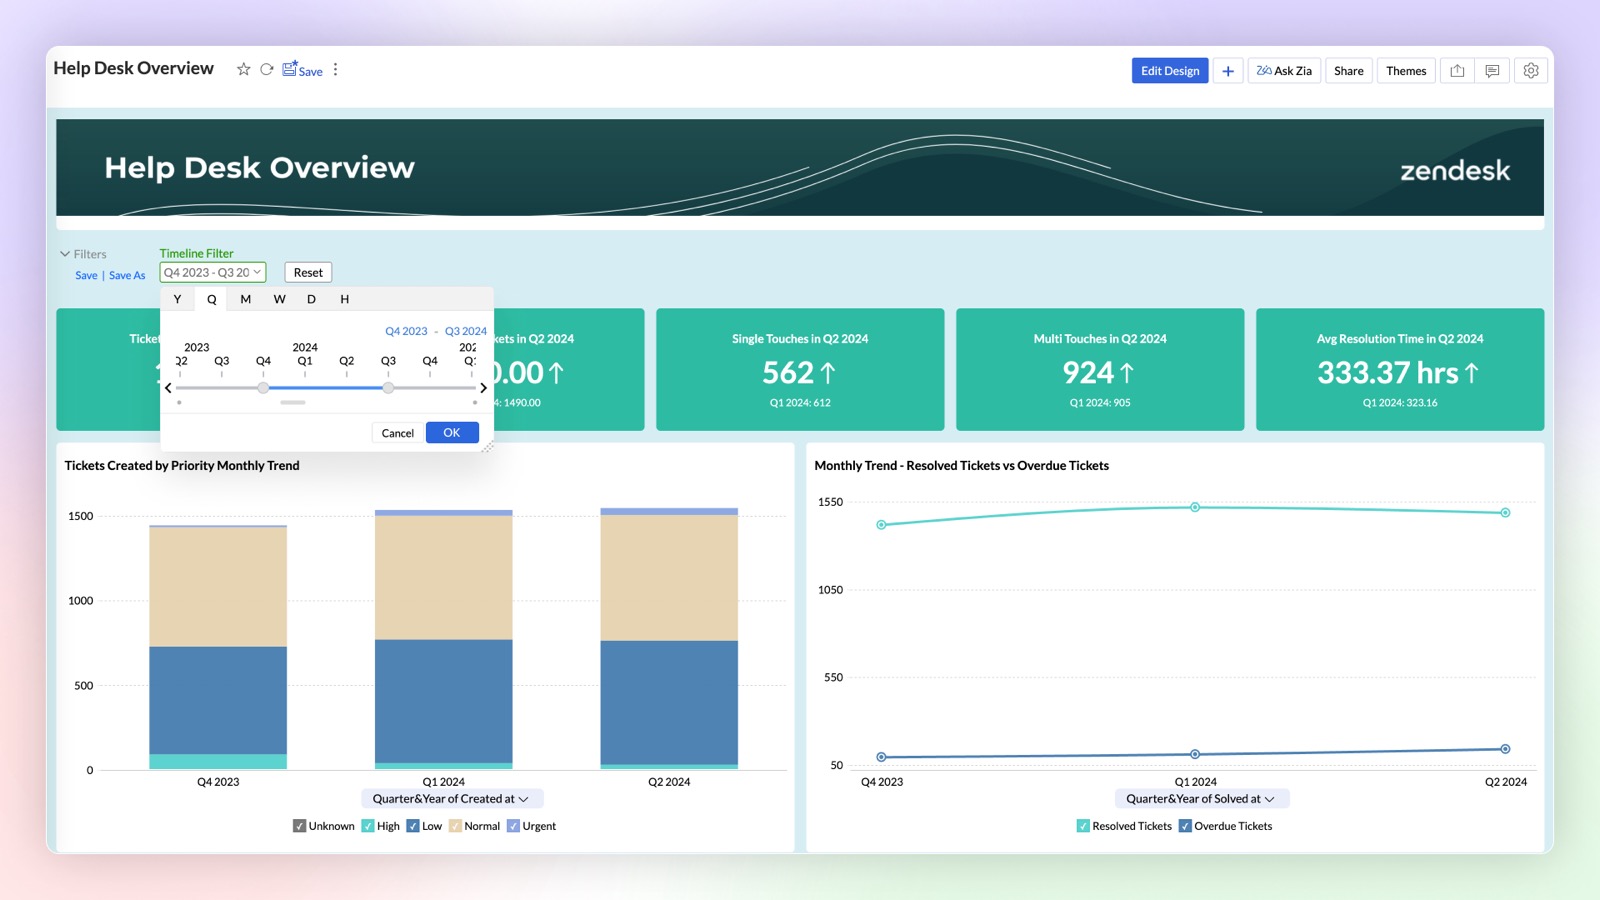
Changing date functions based on Time Slicer
Enhance user interaction on your dashboard by dynamically adjusting the date functions of reports based on the applied Time Slicer. The selected date function and interval in the Time Slicer will automatically update the date functions across all reports within the dashboard.
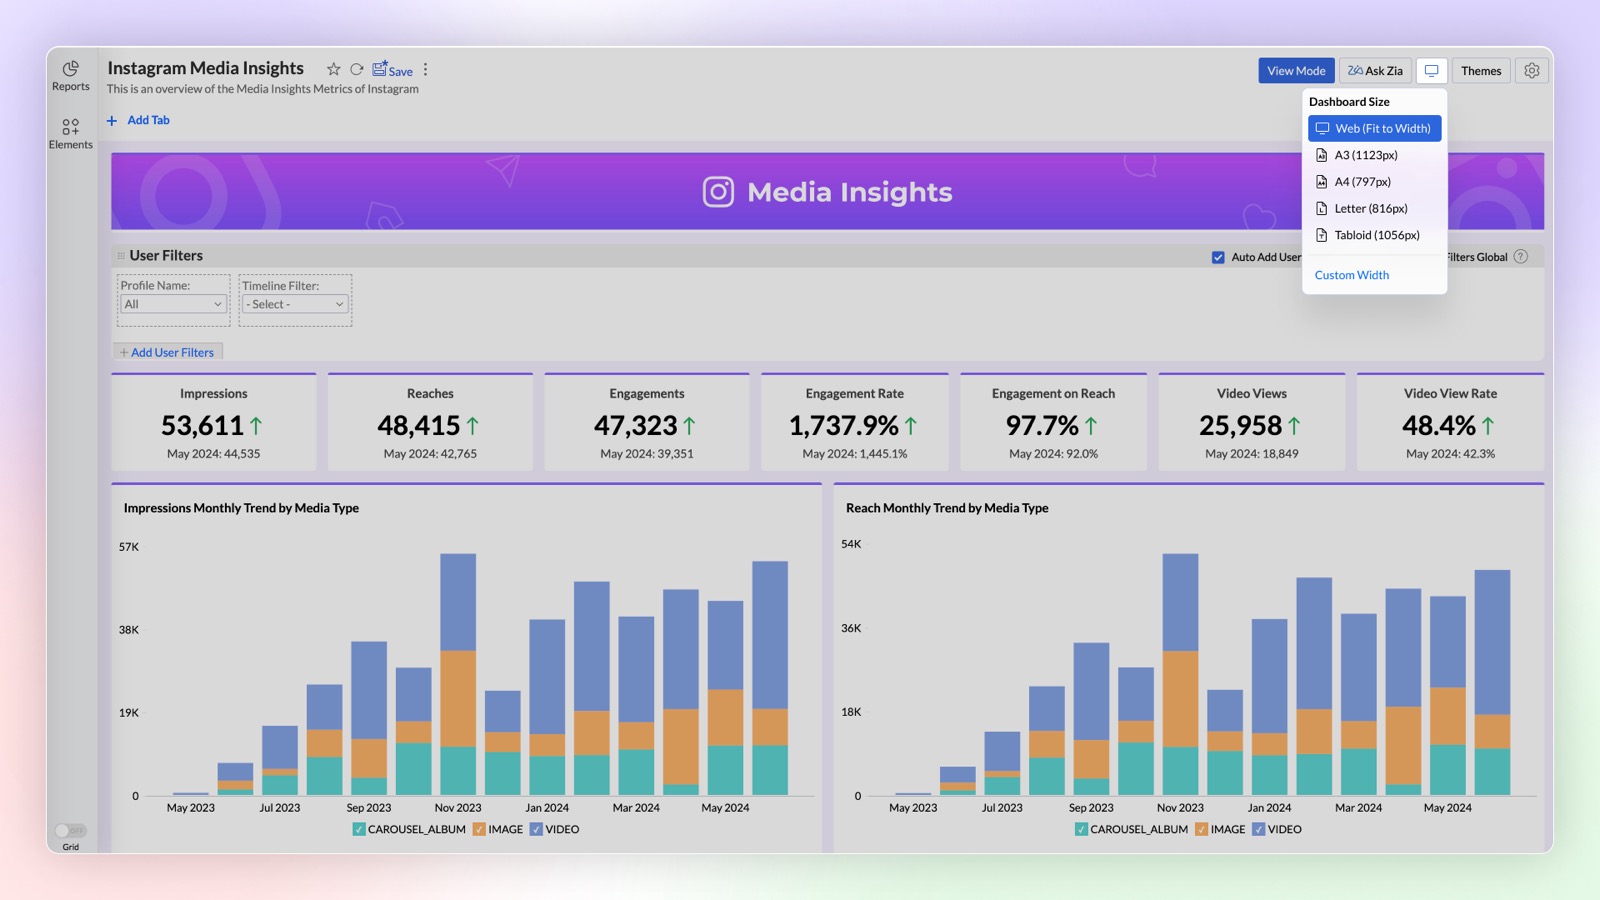
Customizing the width of Dashboard Designer Area
You can now customize the width of the Dashboard layout to suit your specific design needs. By setting the desired width, you can also design dashboards that could fit in applications where you are embedding them, ensuring a visually appealing layout.
Widget Enhancements
- Image support in widgets: Enhance your dashboard’s visual appeal and user engagement by adding custom icons to KPI widgets to convey information at a glance, without lengthy descriptions. You can use the in-built image customization options like changing color, cropping, etc., to cater your needs.
- Widgets with forecast: Based on your current data trend, get a better understanding of how close you are to your goals by adding forecast value to your widgets.
Export as PPT
You can now export a dashboard as a Microsoft PowerPoint file. The snapshot of each view in the dashboard will be exported as an individual slide.
Copy and Paste Reports in Dashboard
Now you can easily copy and paste the reports in your dashboard from one tab to another.
Interactive Customizations
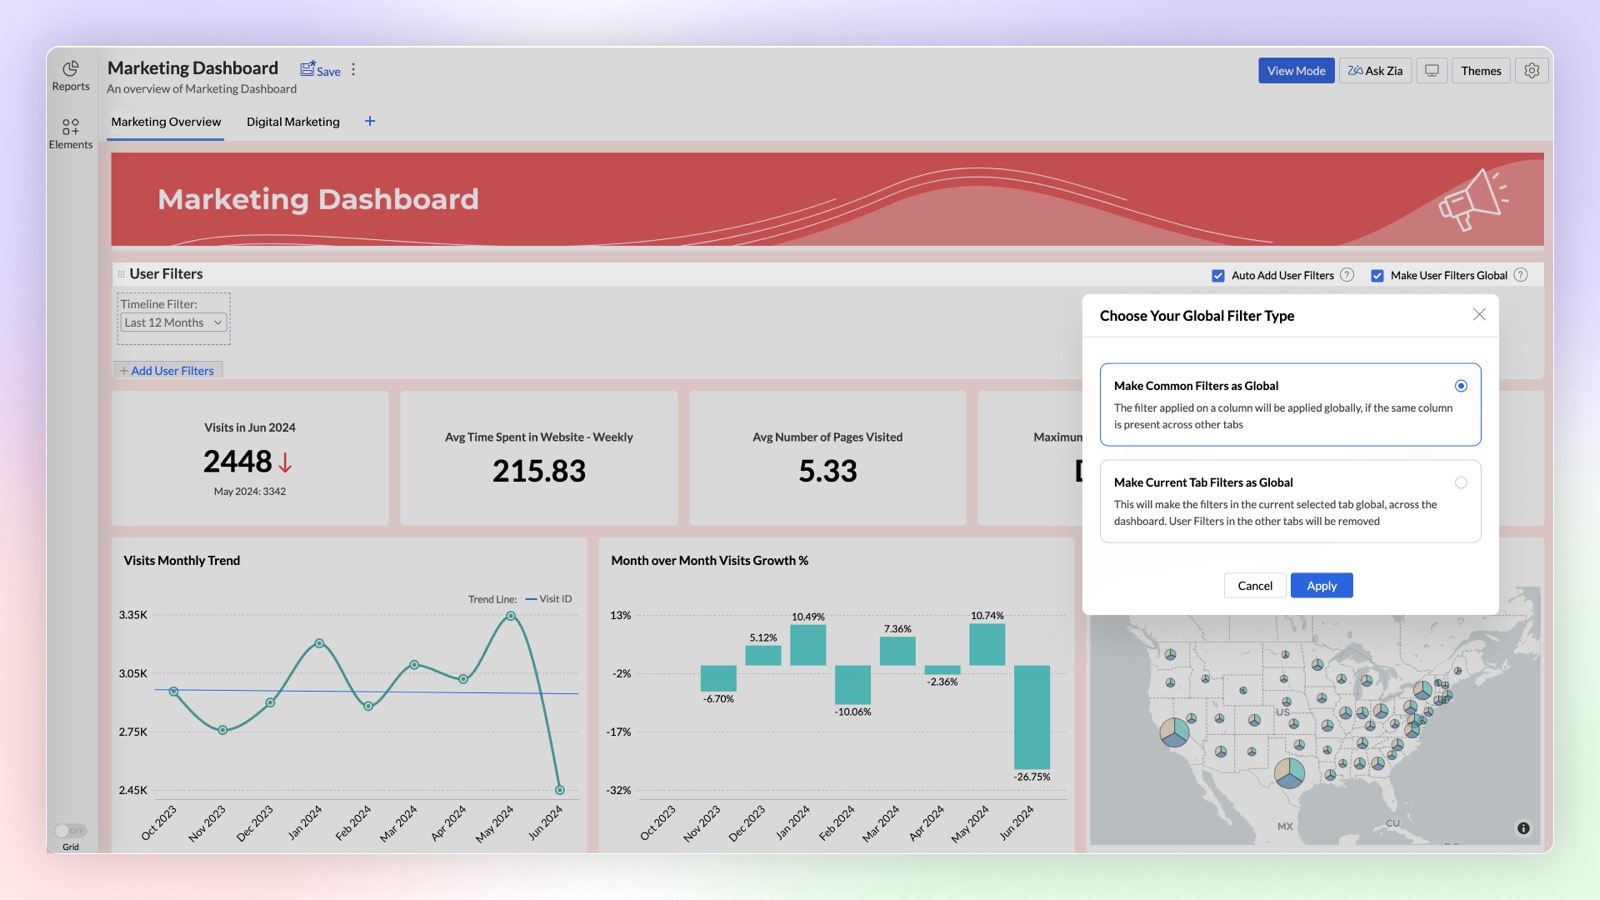
Global User Filters
Expand the functionality of Global User Filters in your dashboard for deeper analysis with our latest enhancement. You can either select common filters across tabs as global filters or apply the same filter to all tabs when they share the same base data.
Click here to learn more.
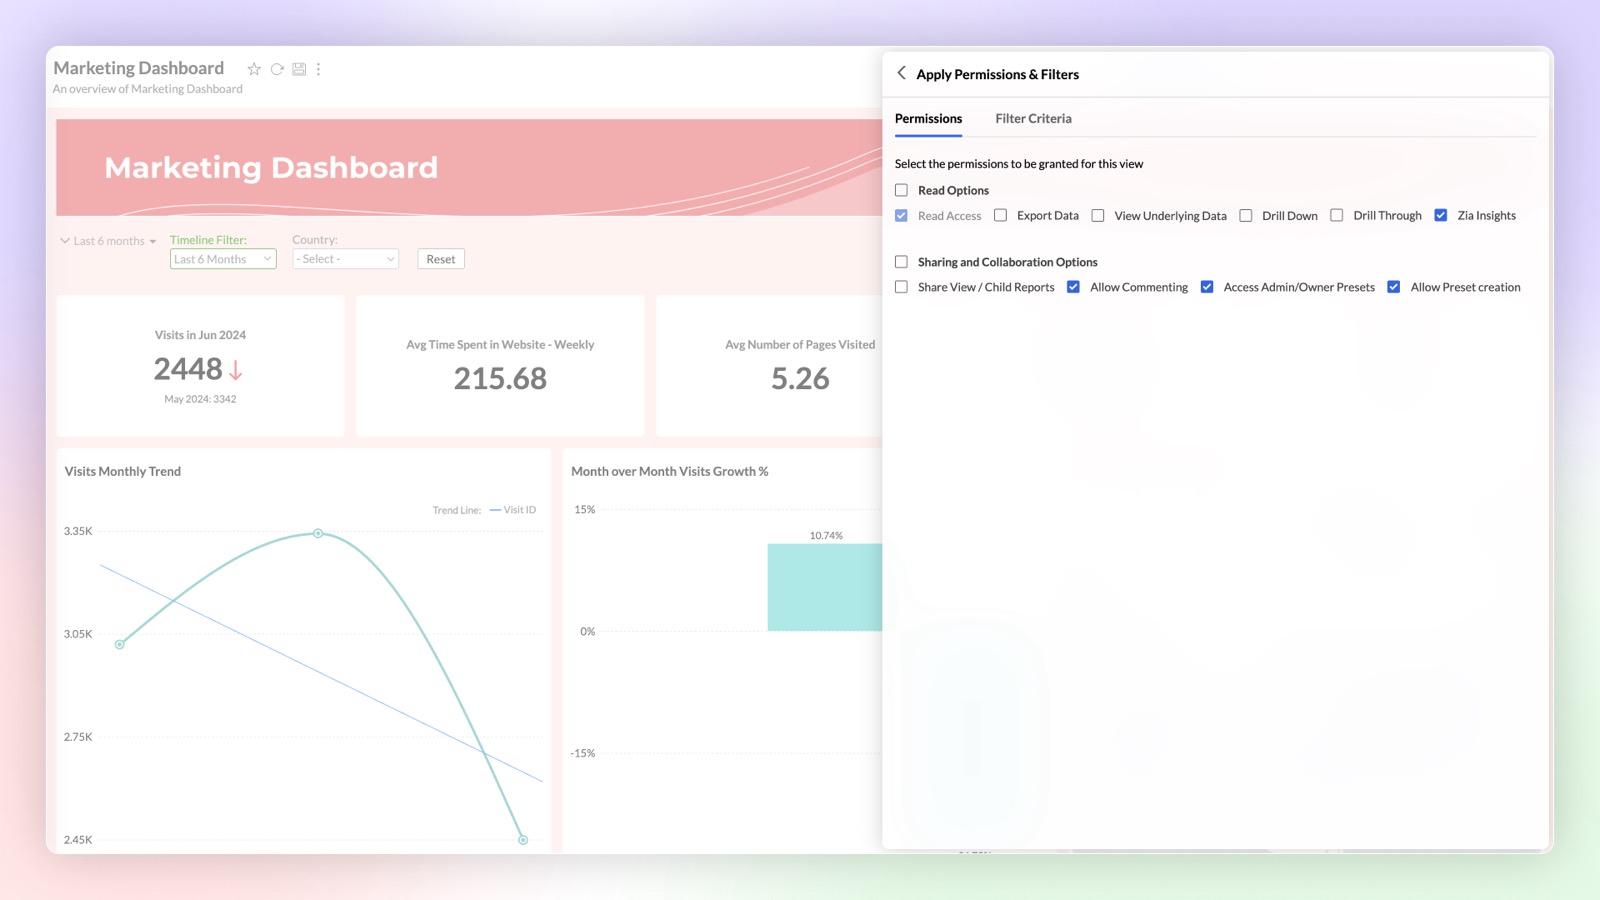
Sharing User Filter Presets
You can now share saved user filter presets with other users. Dashboard users can utilize the shared presets or create their own custom presets.
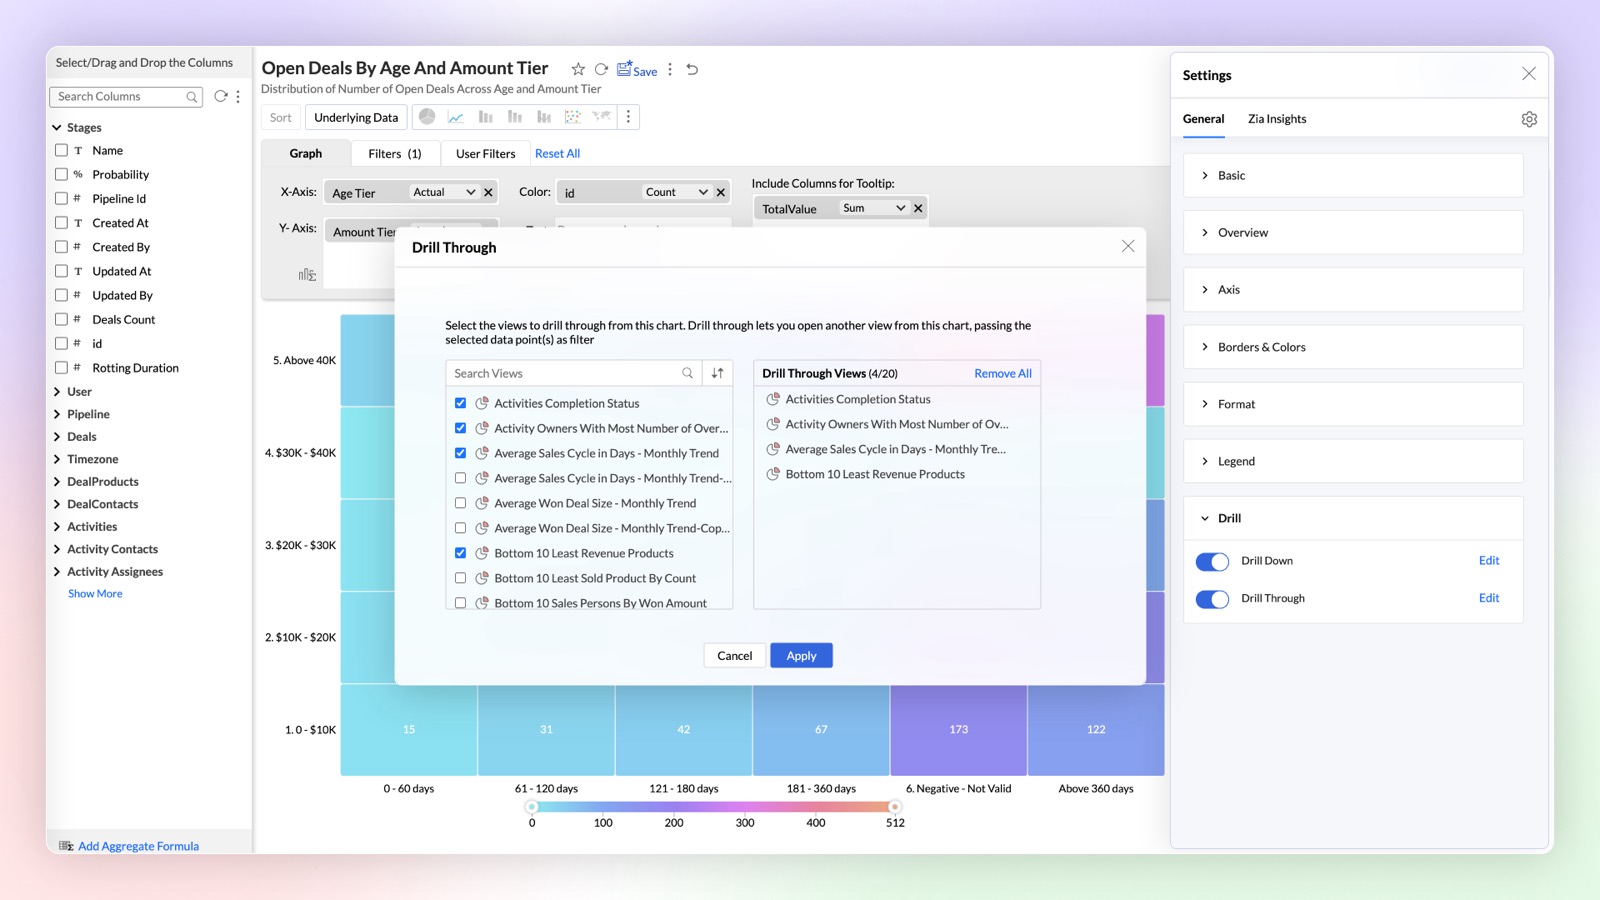
Drill Through
Navigate and view the reports related to the specific data points using the drill through function. You can easily link all the related reports specific to a metric or dimension.
Click here to learn more.
Generative AI Infused Analytics
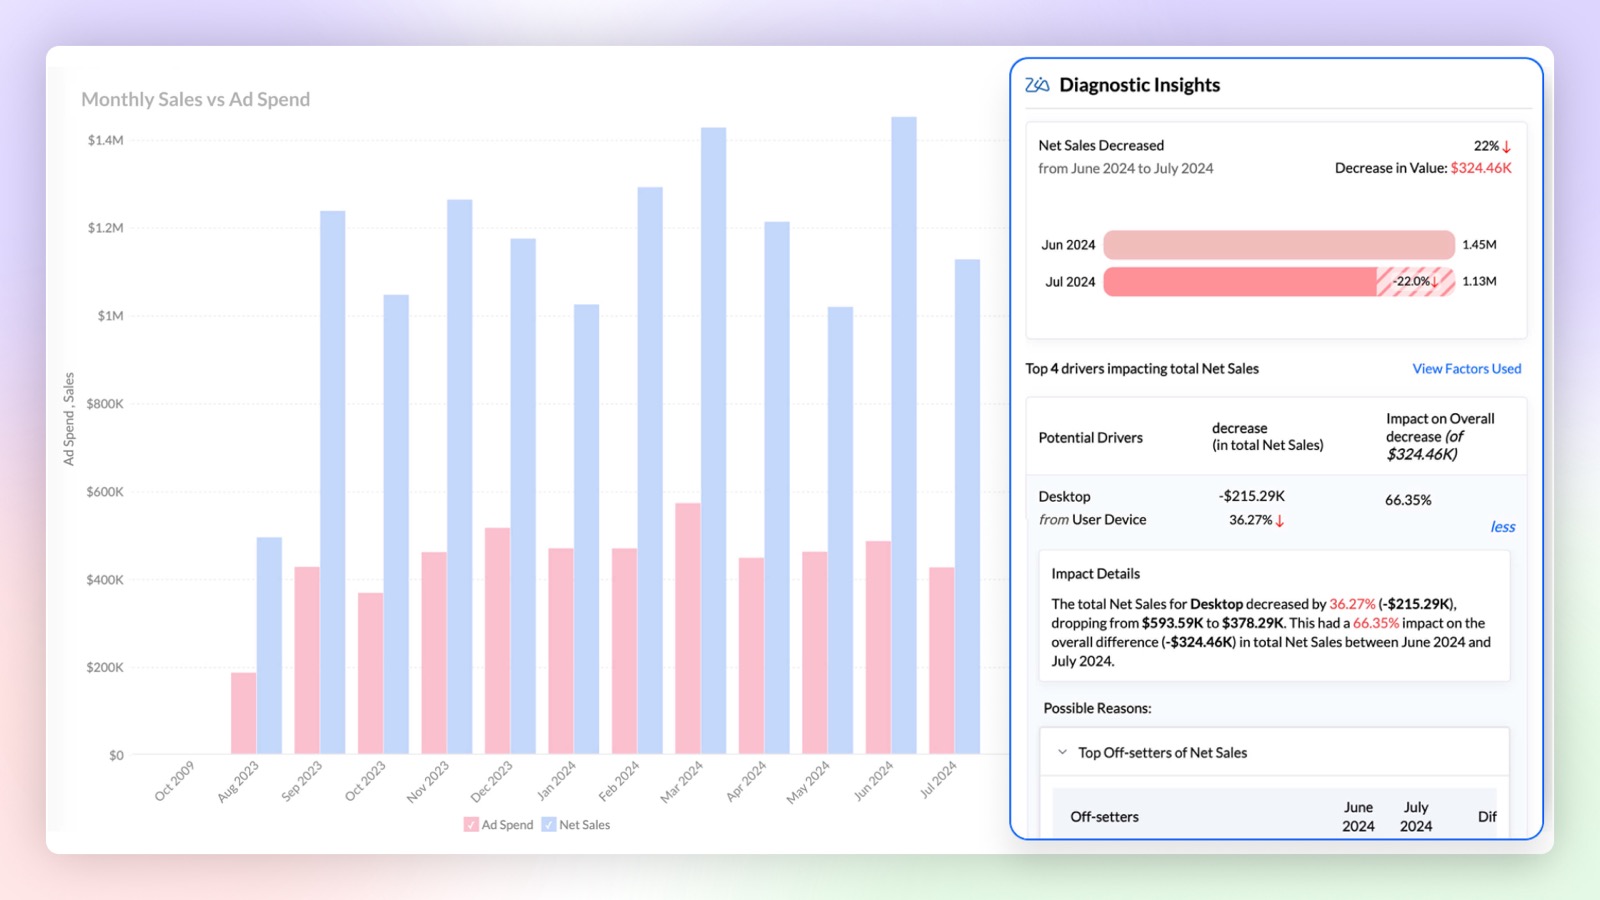
Diagnostics Insights
Find out the reason 'Why' behind any insight with diagnostic insights. Analyze the key drivers with significant impact and take informed actions based on these insights.
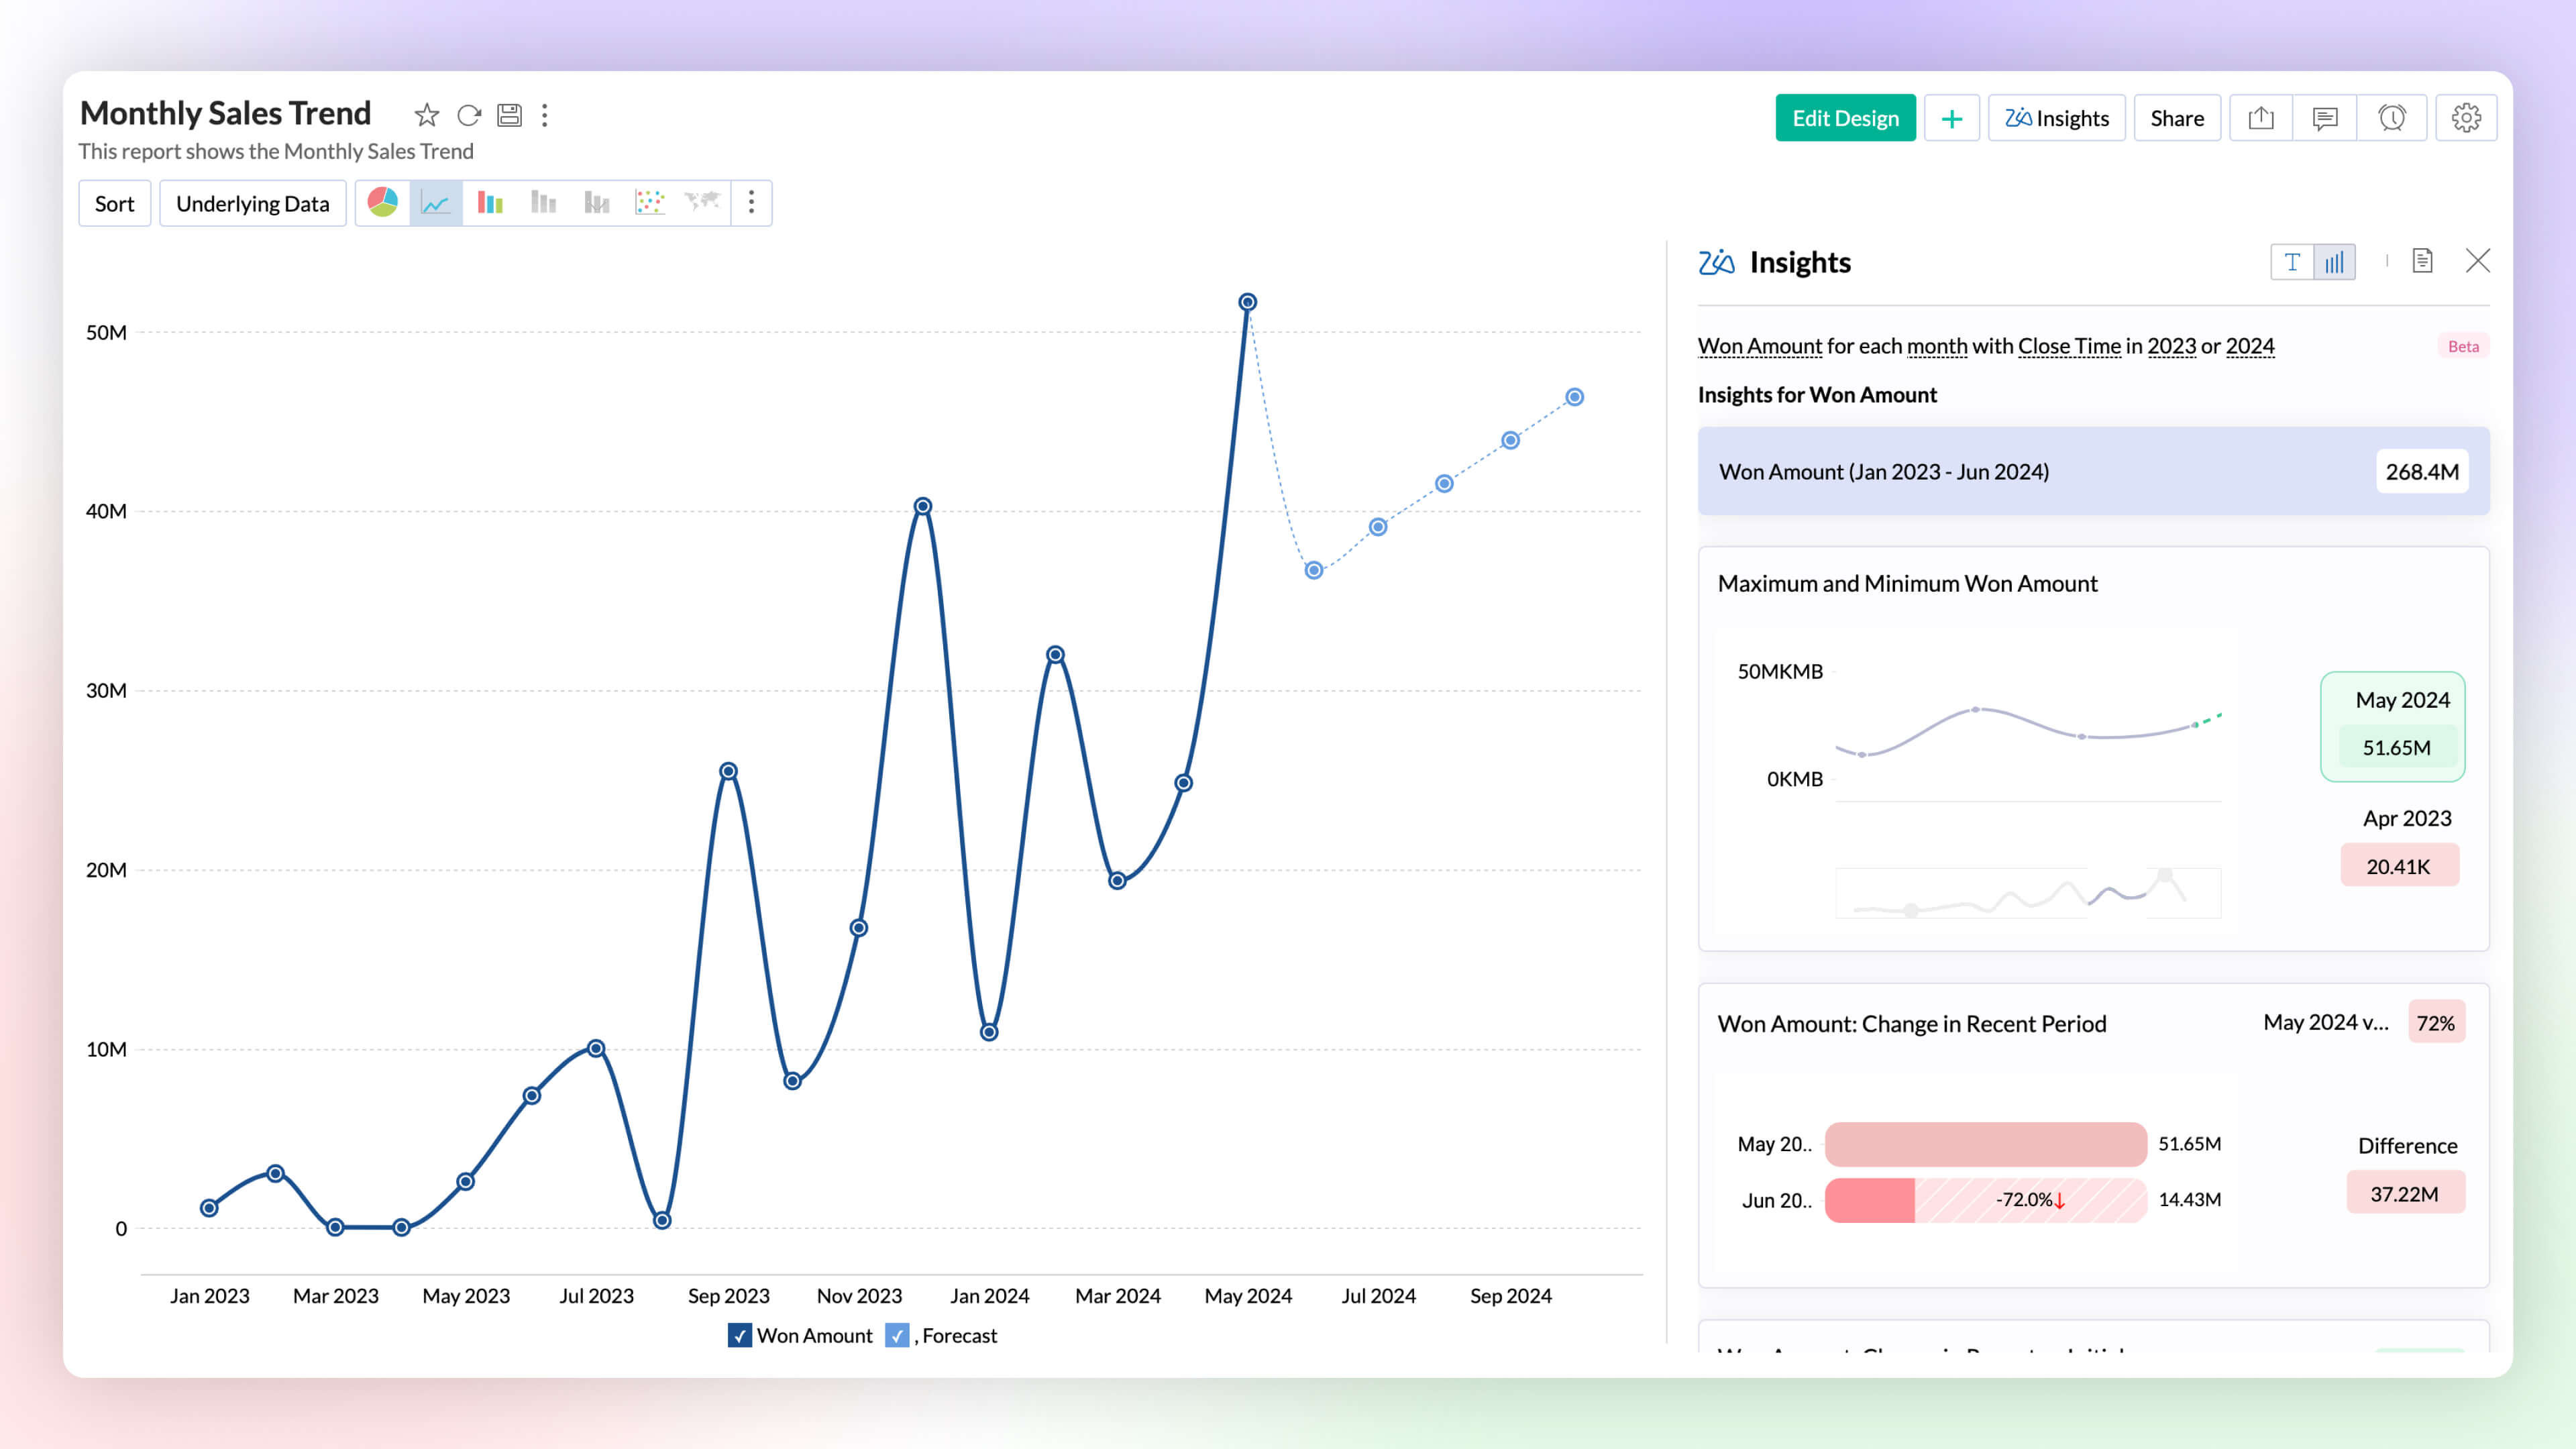
Visual Zia Insights
Zia Insights now provides visual narratives! Visuals help process information far more efficiently than lengthy text descriptions. These visuals facilitate multi-dimensional interpretations like comparison, contribution, distribution, trends and proportions.
Click here to learn more.
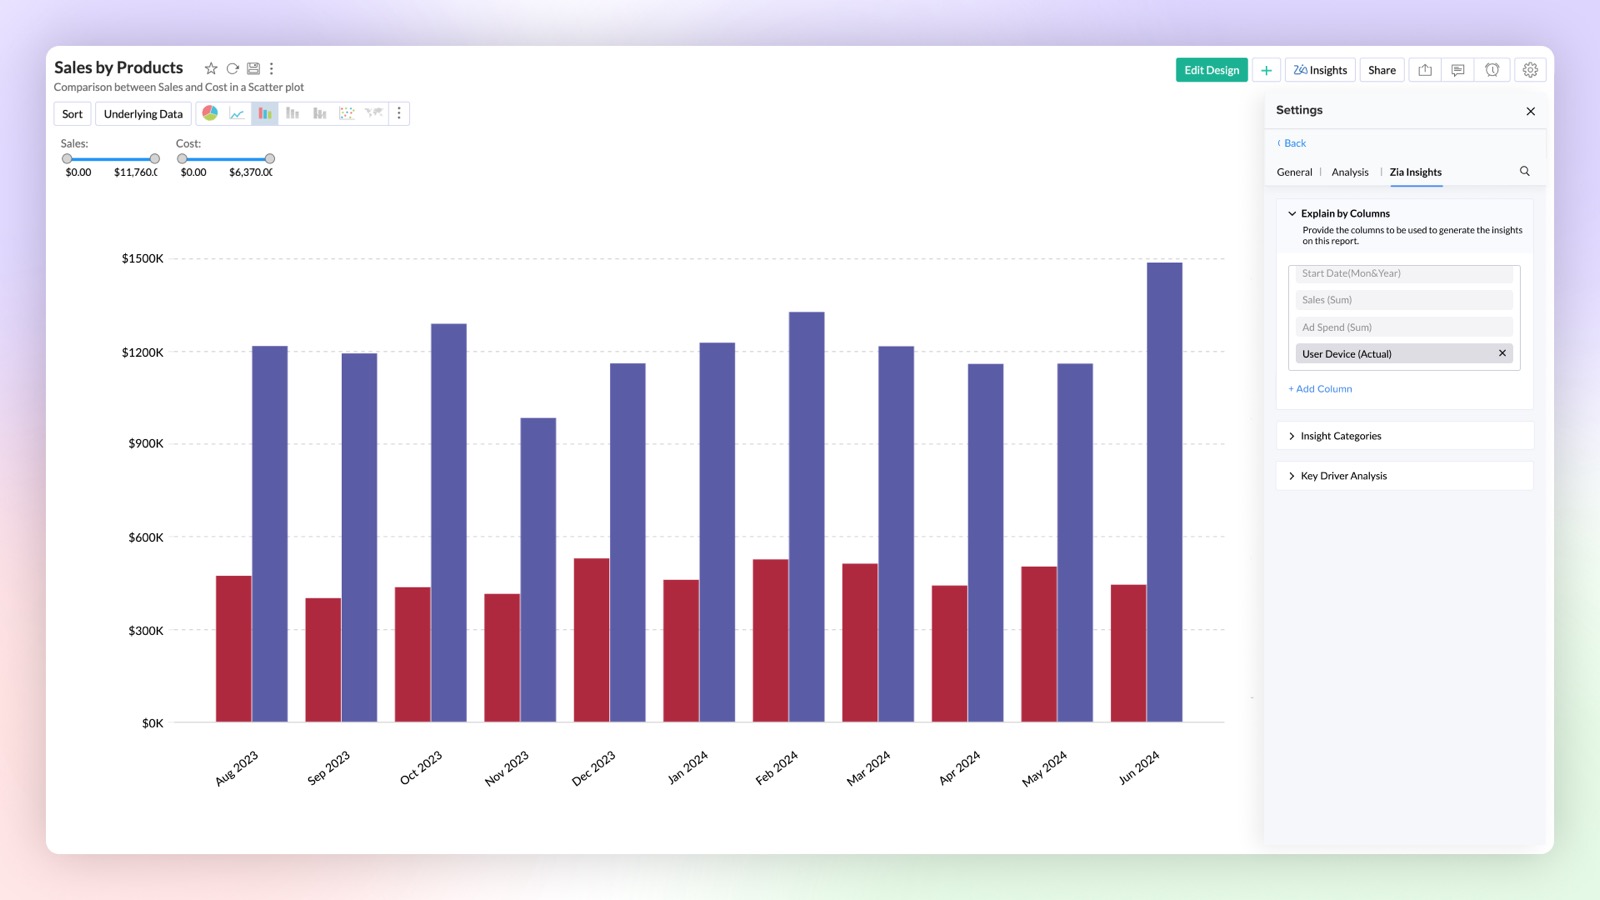
Configurable Insights
Customize the insights generated by Ask Zia to focus on the columns of your choice. This feature provides configurable insights tailored to your selected data.
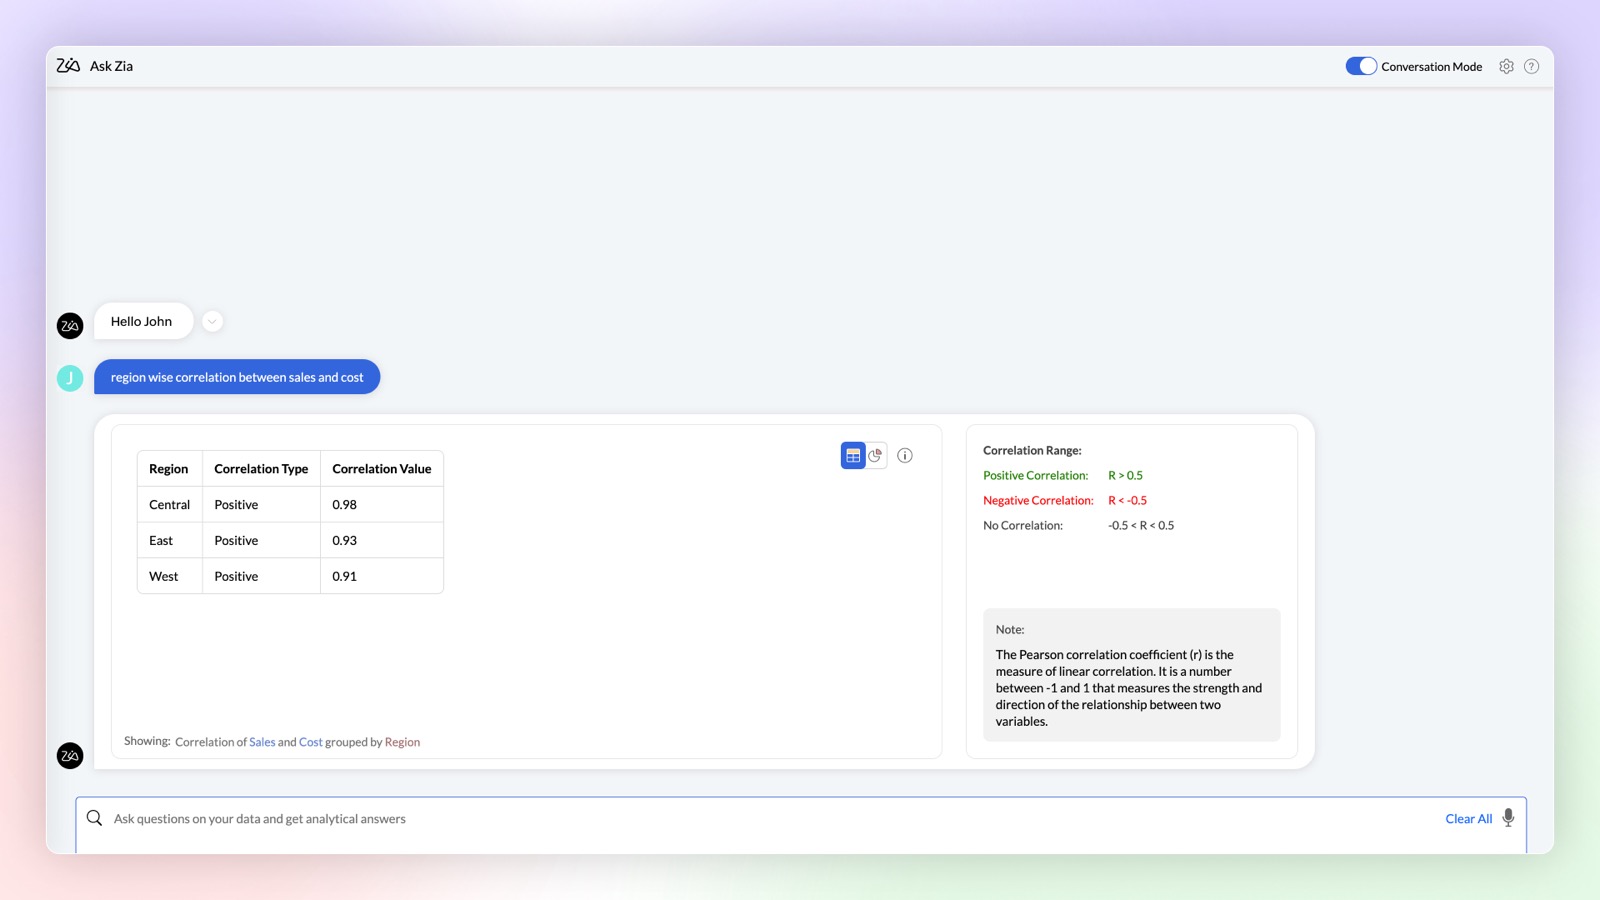
Complex Queries
Ask Zia in conversation mode can now provide you with results for complex mathematical queries to find correlation and trend strength in your data.
Click here to learn more.
Enhancements in OpenAI Integration
- Increase the accuracy of your OpenAI results in Ask Zia by using your workspace metadata. This can be done by enabling the OpenAI RAG (Retrieval-Augmented Generation) feature in Organization Settings.
- You can now use OpenAI in Ask Zia conversation mode to create formulas and make data preparation easier by helping you build complex queries. Type your needs in simple language and get answers instantly.
- Workspace Admins can also use OpenAI integration in Ask Zia.
Ask Zia Bot in Microsoft Teams
Combine the generative AI capabilities of Zoho Analytics' Ask Zia with Microsoft Teams. Get answers to your data queries, access key business insights quickly, predict future trends, and build reports right from within Microsoft Teams with Ask Zia bot.
Click here to learn more.
Auto Analyze 2.0
Zoho Analytics offers enhanced control over auto-generated reports and dashboards. You can choose from a list of generated reports and dashboards before adding them, and also select which columns should be auto-analyzed.
Click here to learn more.
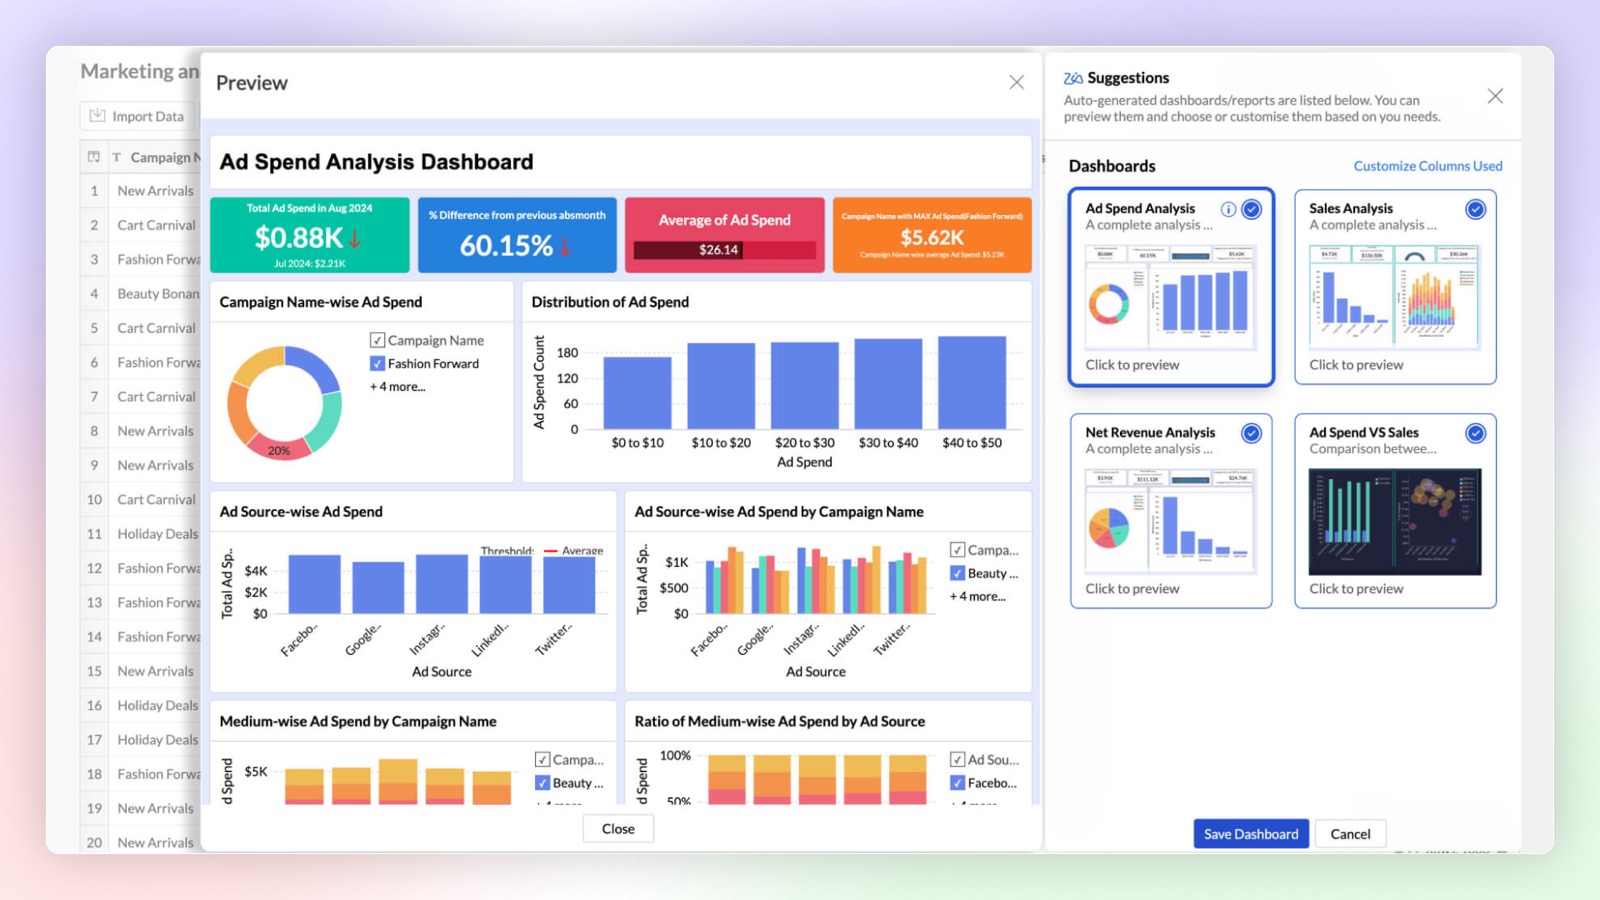
Zia Suggestions
Introducing the new Zia Suggestions, where you can receive smart chart recommendations during the creation process. Zia provides tailored chart options based on your data, allowing you to preview and apply them with a single click.
Click here to learn more.
Predictive AI
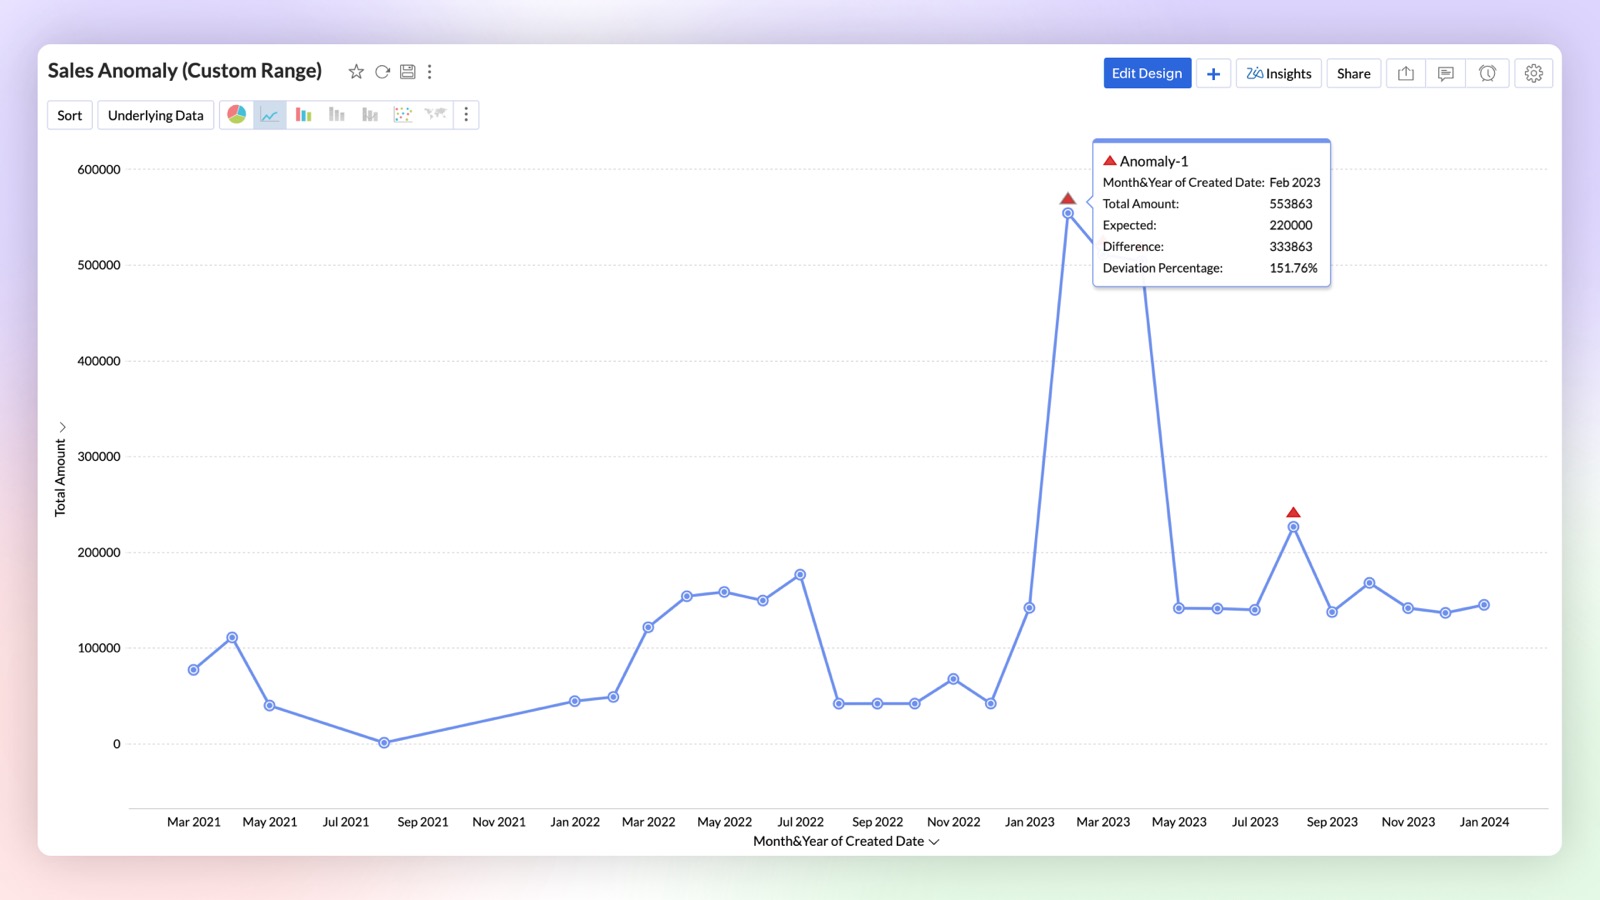
Anomaly Detection
Anomaly detection allows you to easily identify outliers in your data or metrics. You can now create charts that visually highlight these anomalies for quick attention and action. Zoho Analytics uses advanced machine learning algorithms and statistical models to detect outliers. You can also set data alerts based on anomalies to ensure timely identification of vital change in the key business metrics and potential issues.
Click here to learn more.
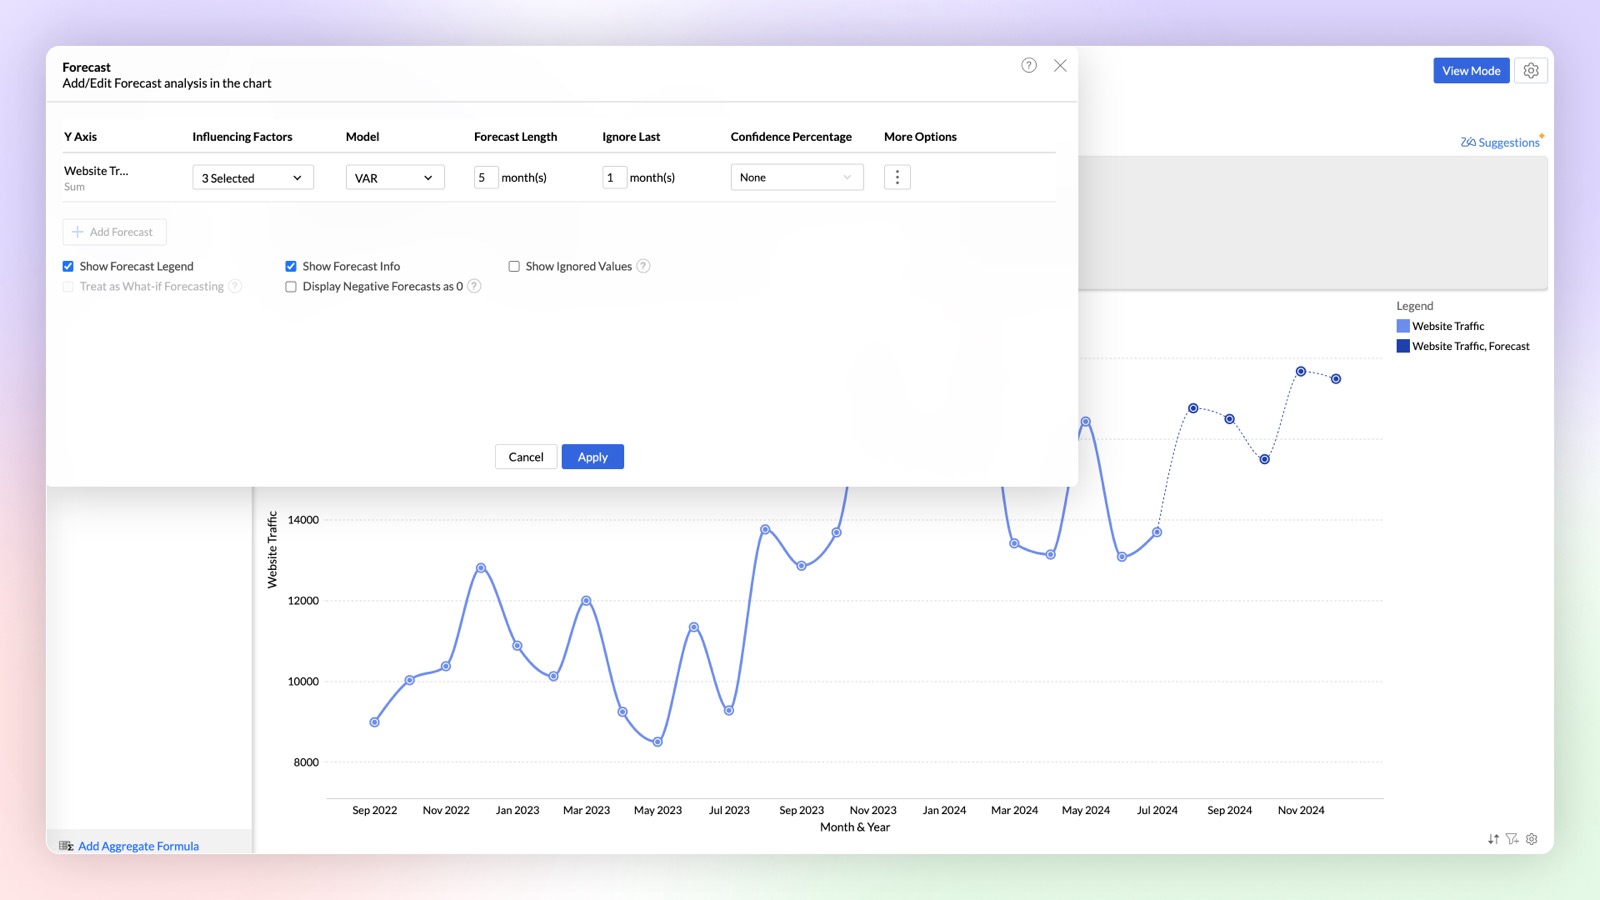
Influencing Factors in Forecasting (Multi-variate forecasting)
Try our new influencing factors option in forecasting, that enables you to provide dependent factors for accurate prediction of outcomes. For example, when you forecast a sales metric it will just predict purely based on historical data, but you can get more accurate predictions in forecast by considering influencing (dependent) factors like marketing spending, sign ups, etc.,
Click here to learn more.
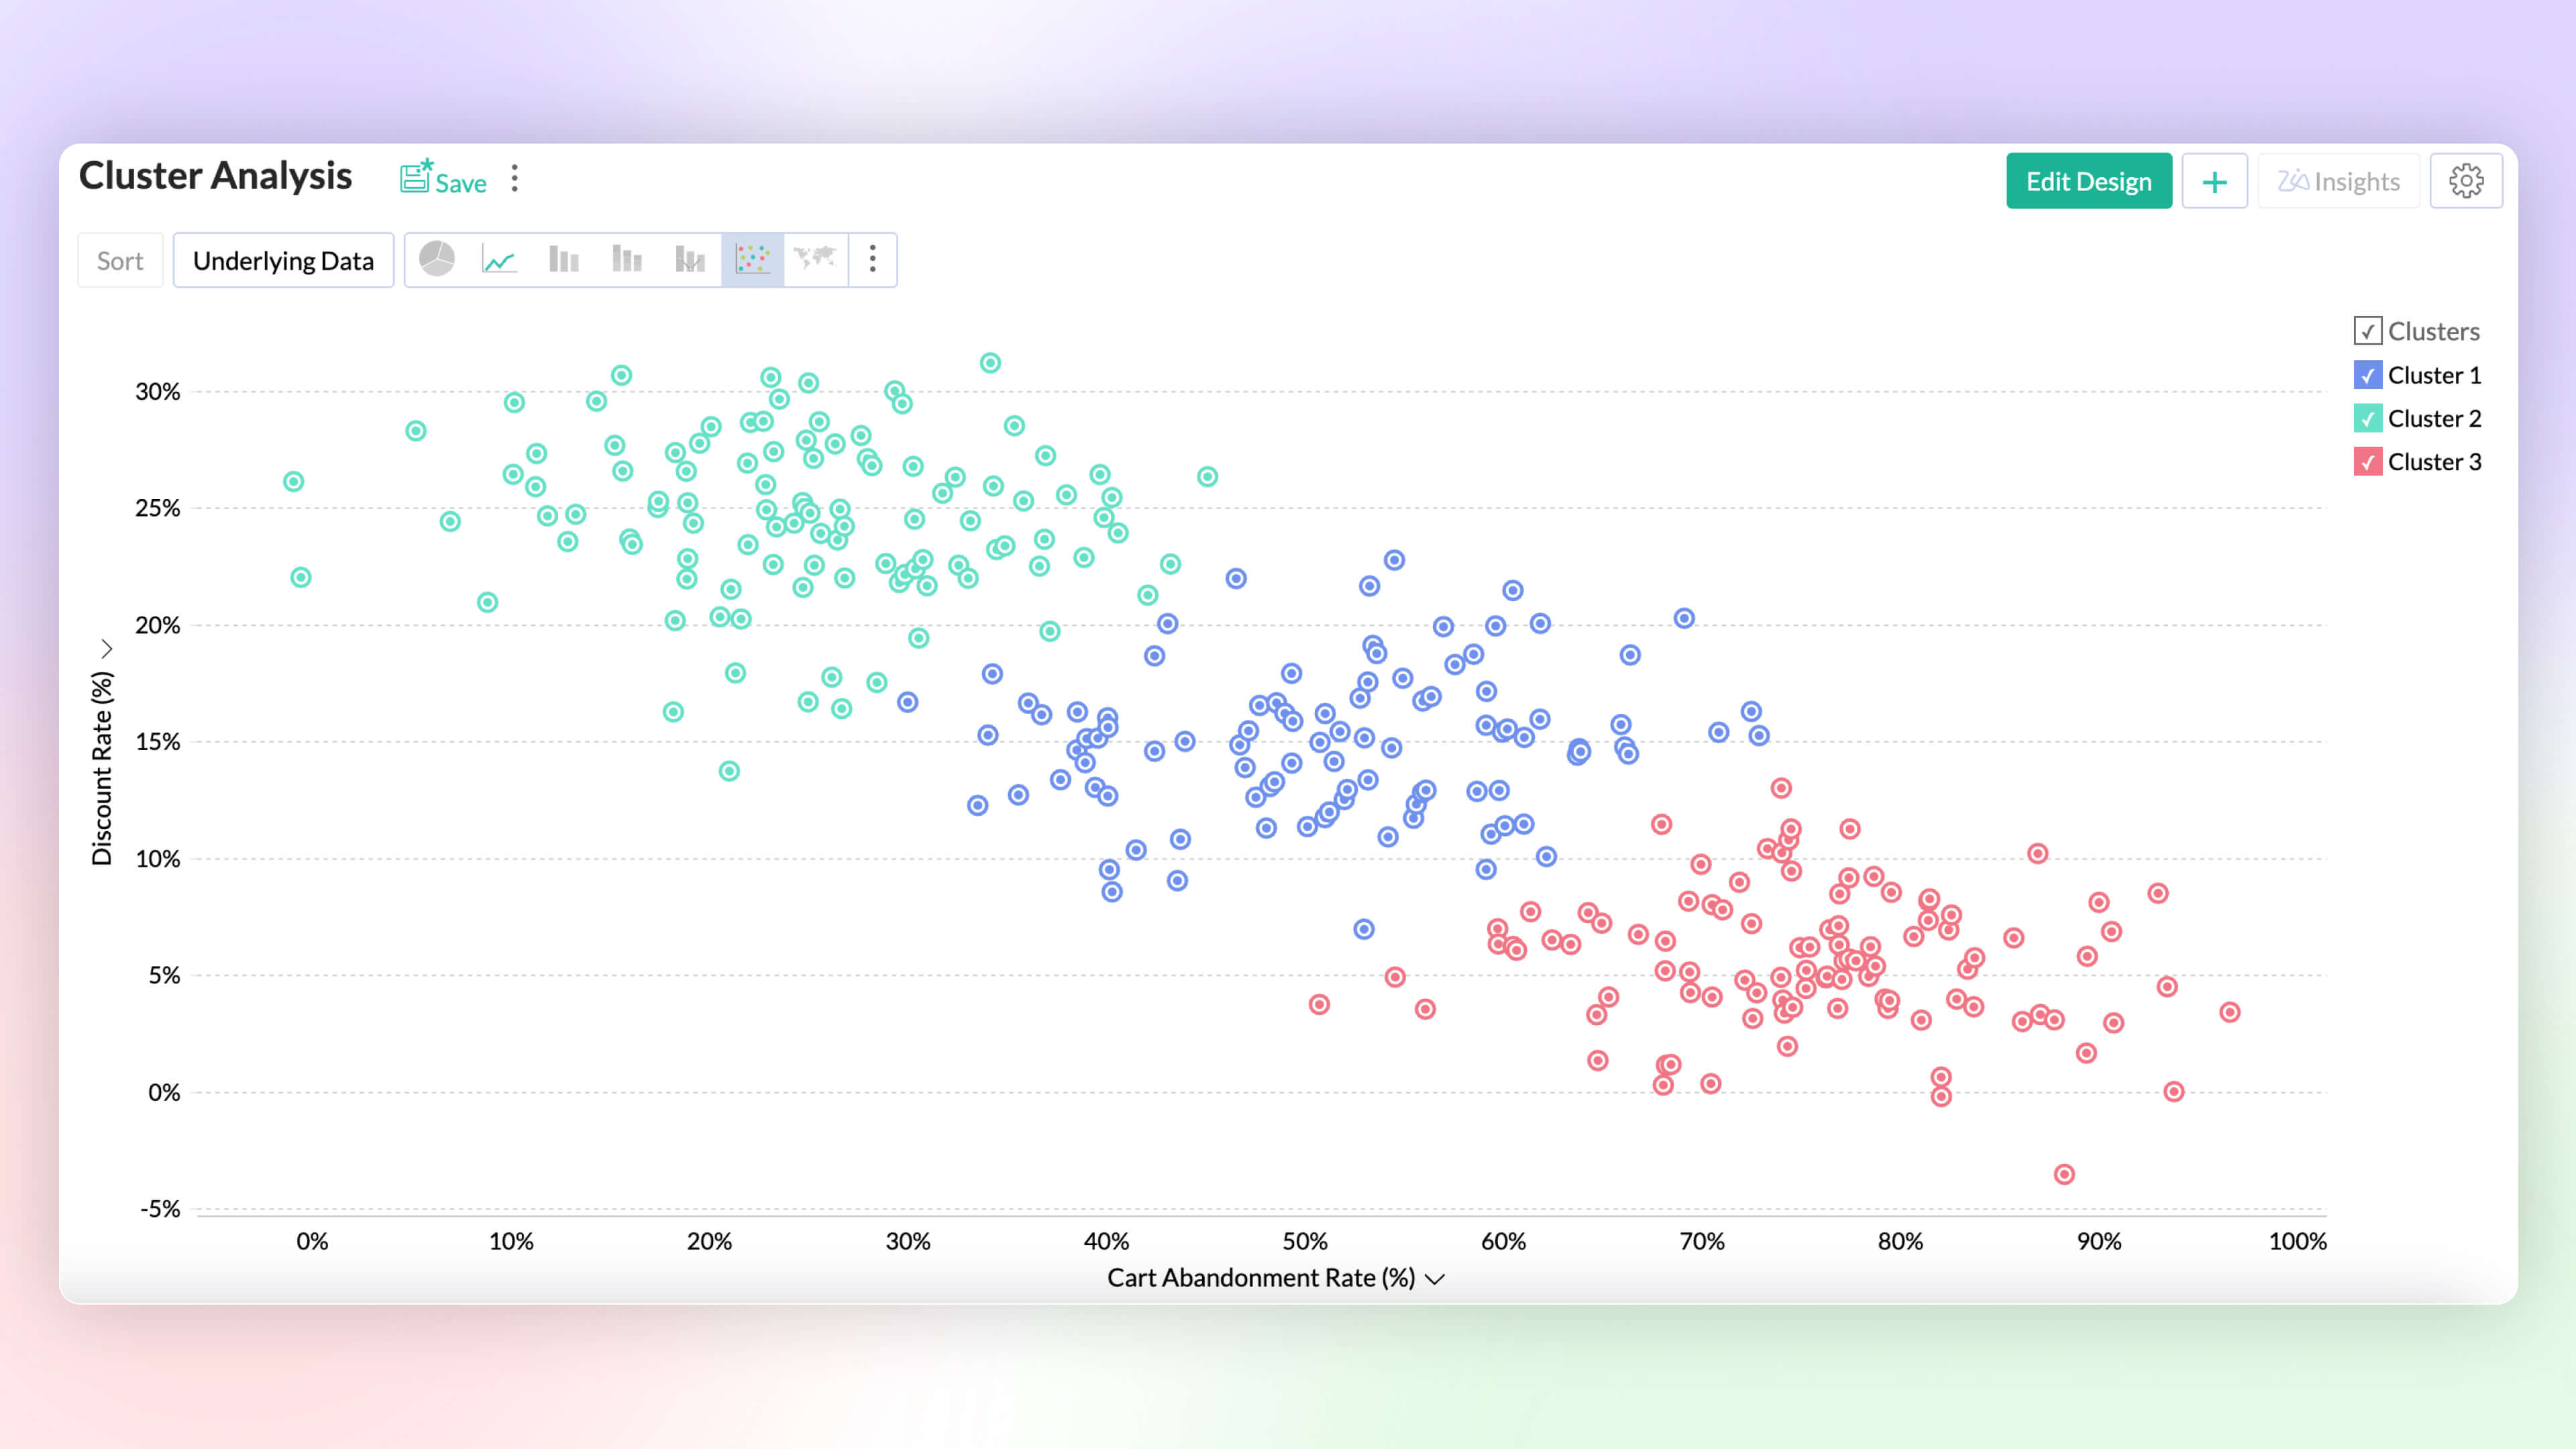
Cluster Analysis Premium Plan
Visualize data grouped as clusters using a variety of ML models (k-mean, k-mode, and k-prototype). Intuitively segment and analyze data groups, for common patterns and affinity.
Click here to learn more.
Data Science & Machine Learning Studio
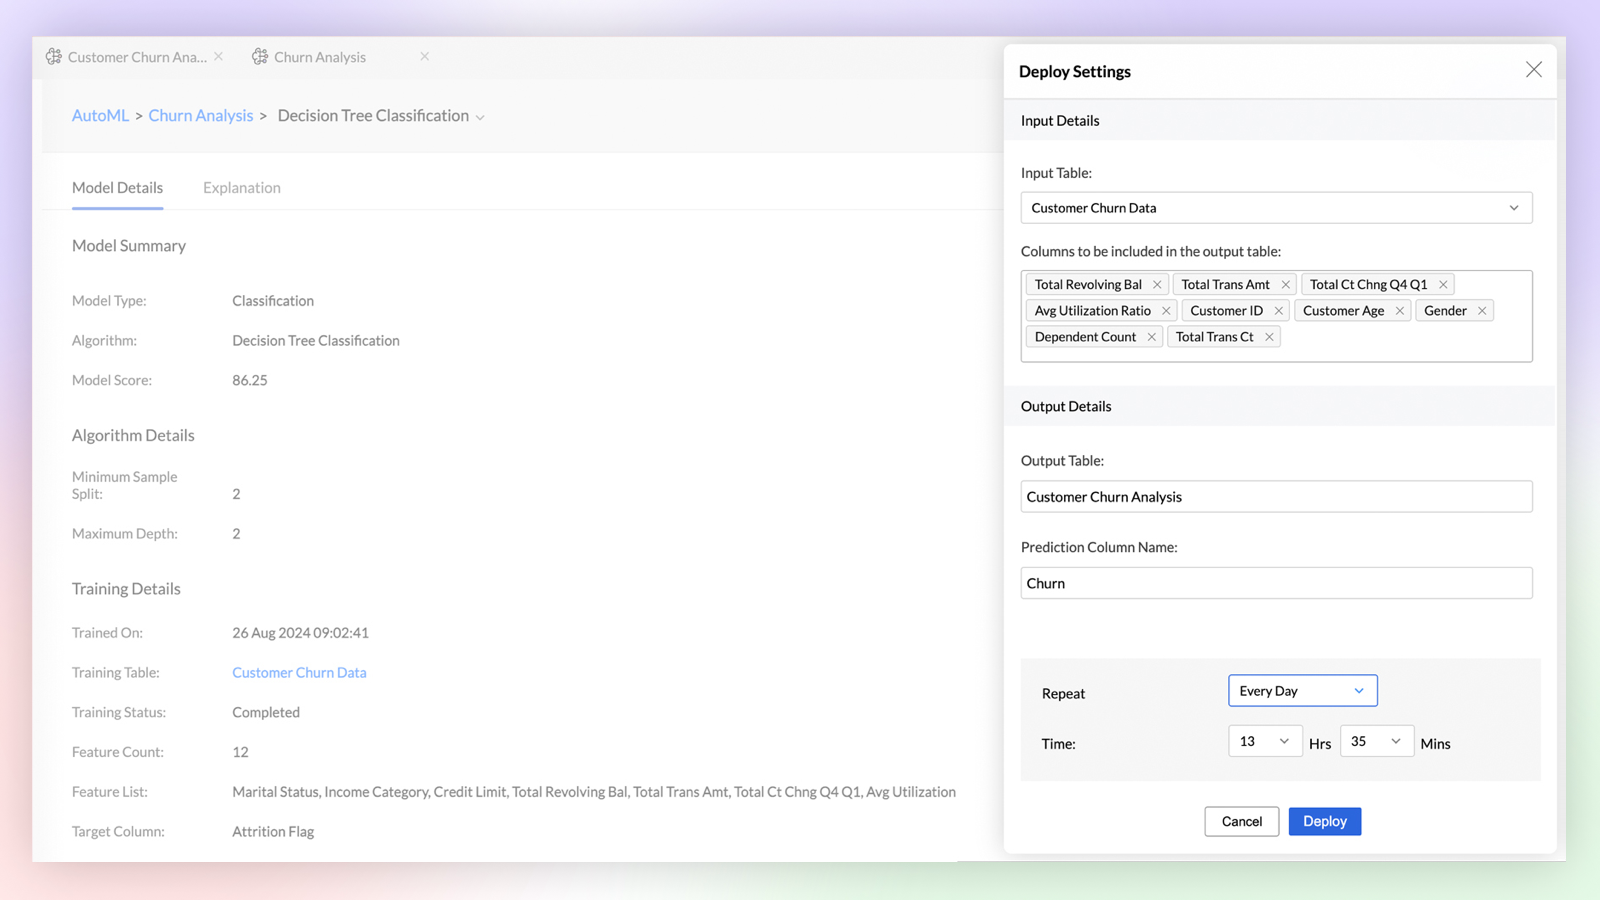
Auto ML Enterprise Plan
Build custom machine learning models with No-code assistant. Easily train, test, compare, deploy and manage models. Perform feature engineering, parameter tuning and model analysis as you build models.
Click here to learn more.
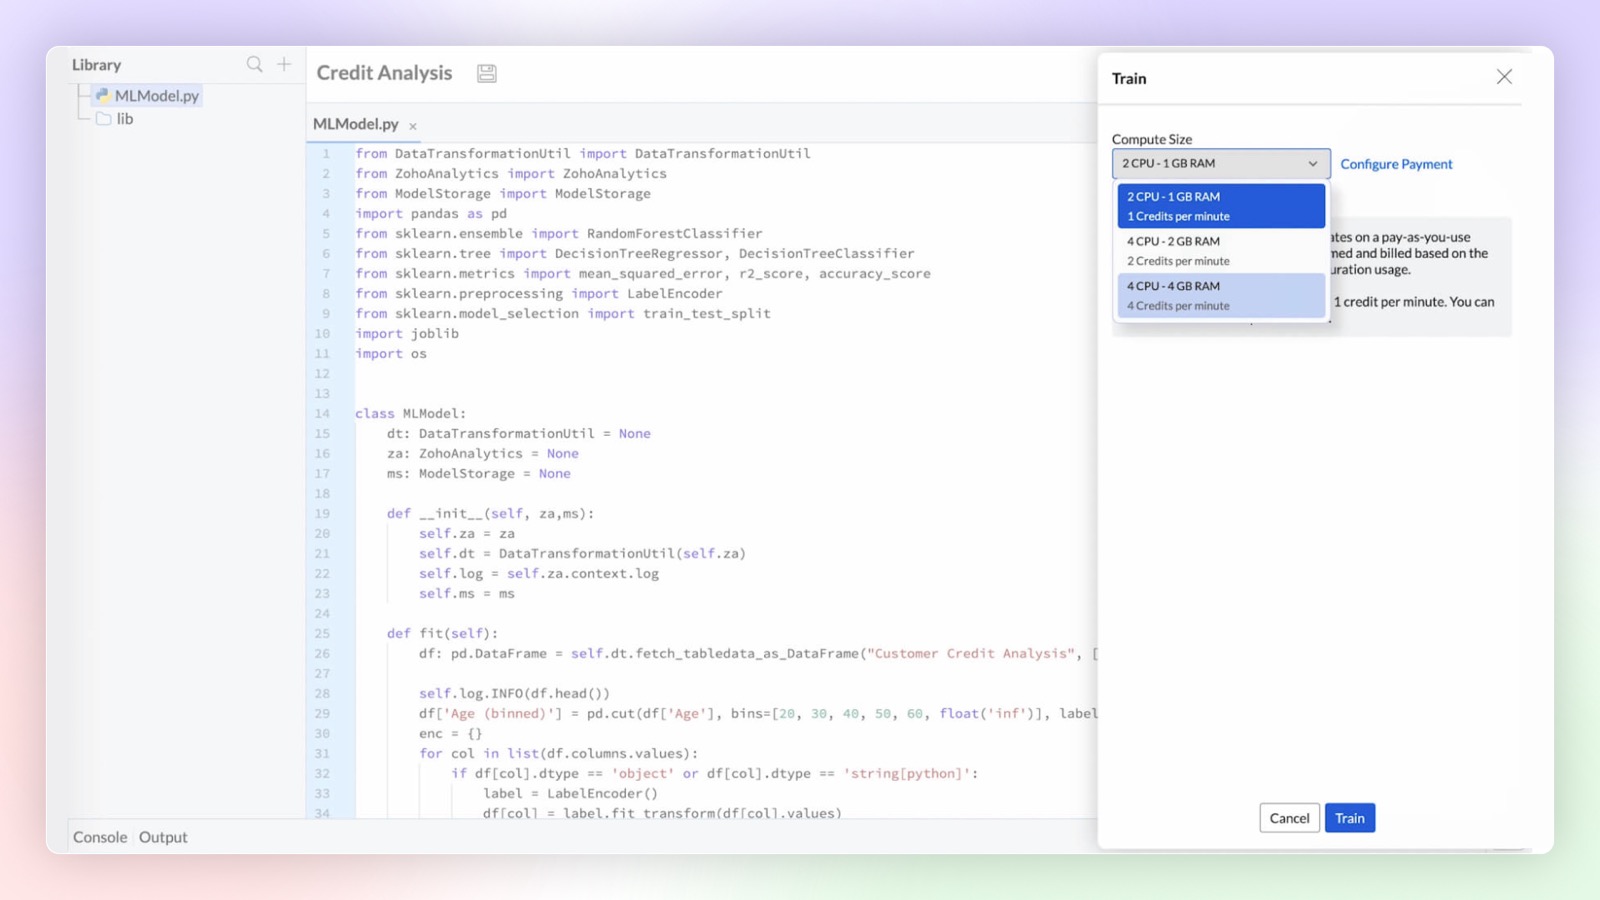
Code Studio Enterprise Plan
Develop custom models and data transformations using Python code studio. Build them from scratch or import them from other sources. Integrated Python development environment with Zia code suggester for accelerated development.
Click here to learn more.
Platform Extensibility
Linked Workspaces
Linked Workspaces in Zoho Analytics establishes a connection between two distinct workspaces, allowing them to push views from one workspace to another. In this connection, one acts as a primary workspace and the other acts as a child workspace. The views from a primary workspace can be effortlessly pushed to multiple child workspaces with a single click or set to synchronize periodically for automatic updates.
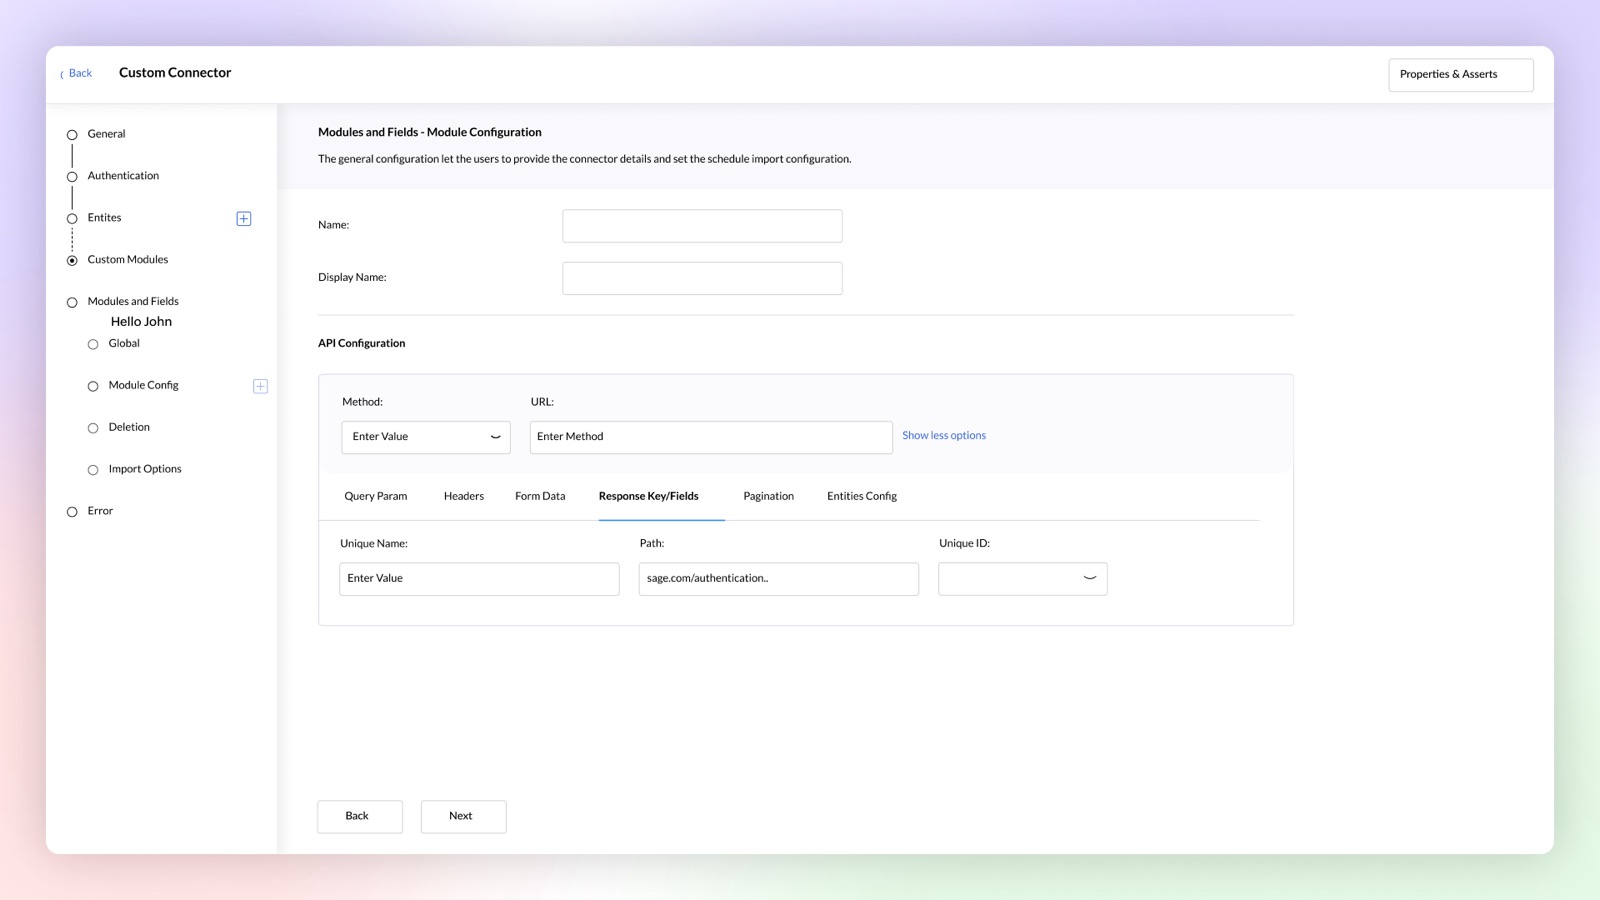
Custom Connector Premium Plan
Build your own data connector for any application using a no-code connector builder. Publish and sell your custom connectors on Zoho Marketplace, if required.
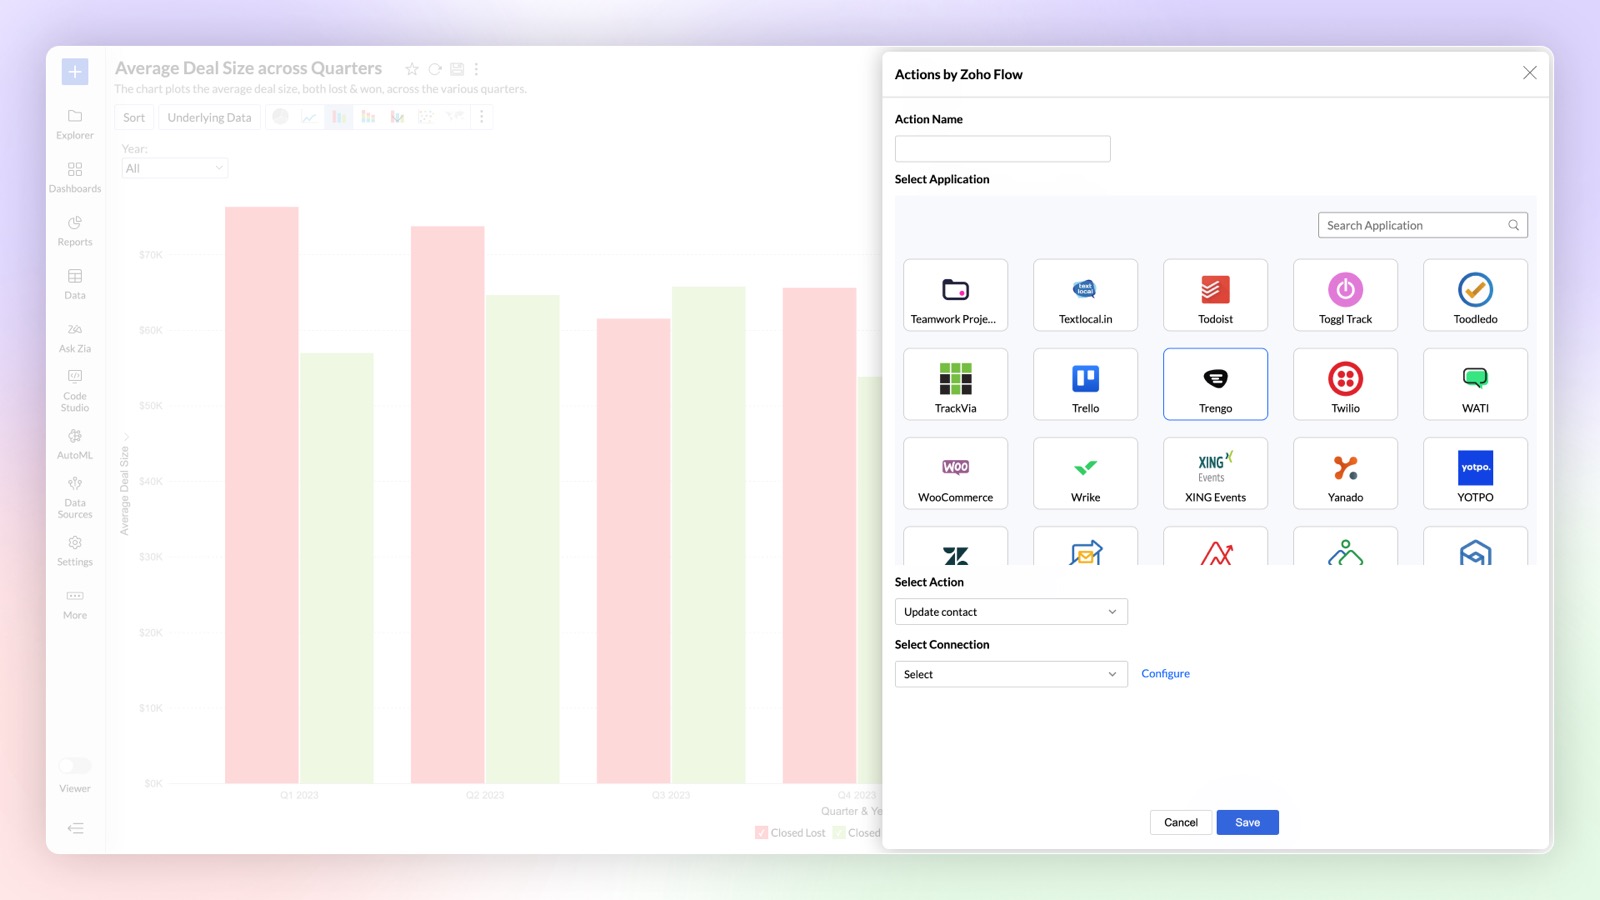
Zoho Flow in Alerts Premium Plan
You can now use Zoho Flow to perform actions in other applications whenever an alert is triggered in Zoho Analytics using Zoho Flow. For example, a ticket can be created in Zendesk based on the alert triggered in Zoho Analytics.
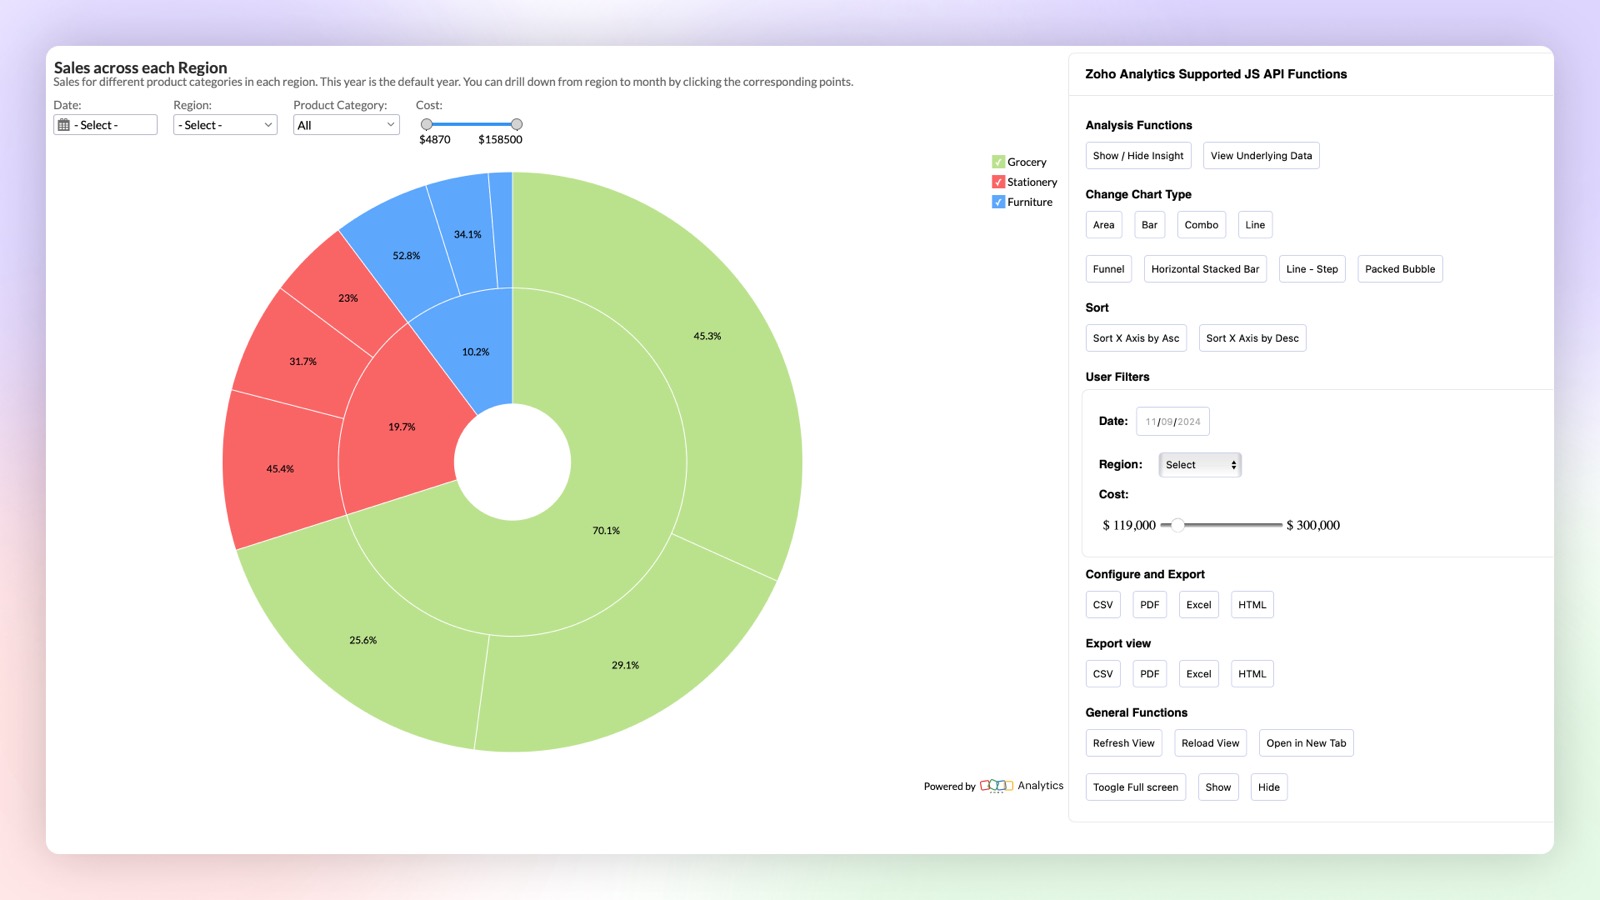
Client SDK
New Javascript based Client SDK to extend & customize the user experience of reports within embedded applications. You can control interactions like sort, export, user filters, change chart type and other actions with the JS API.
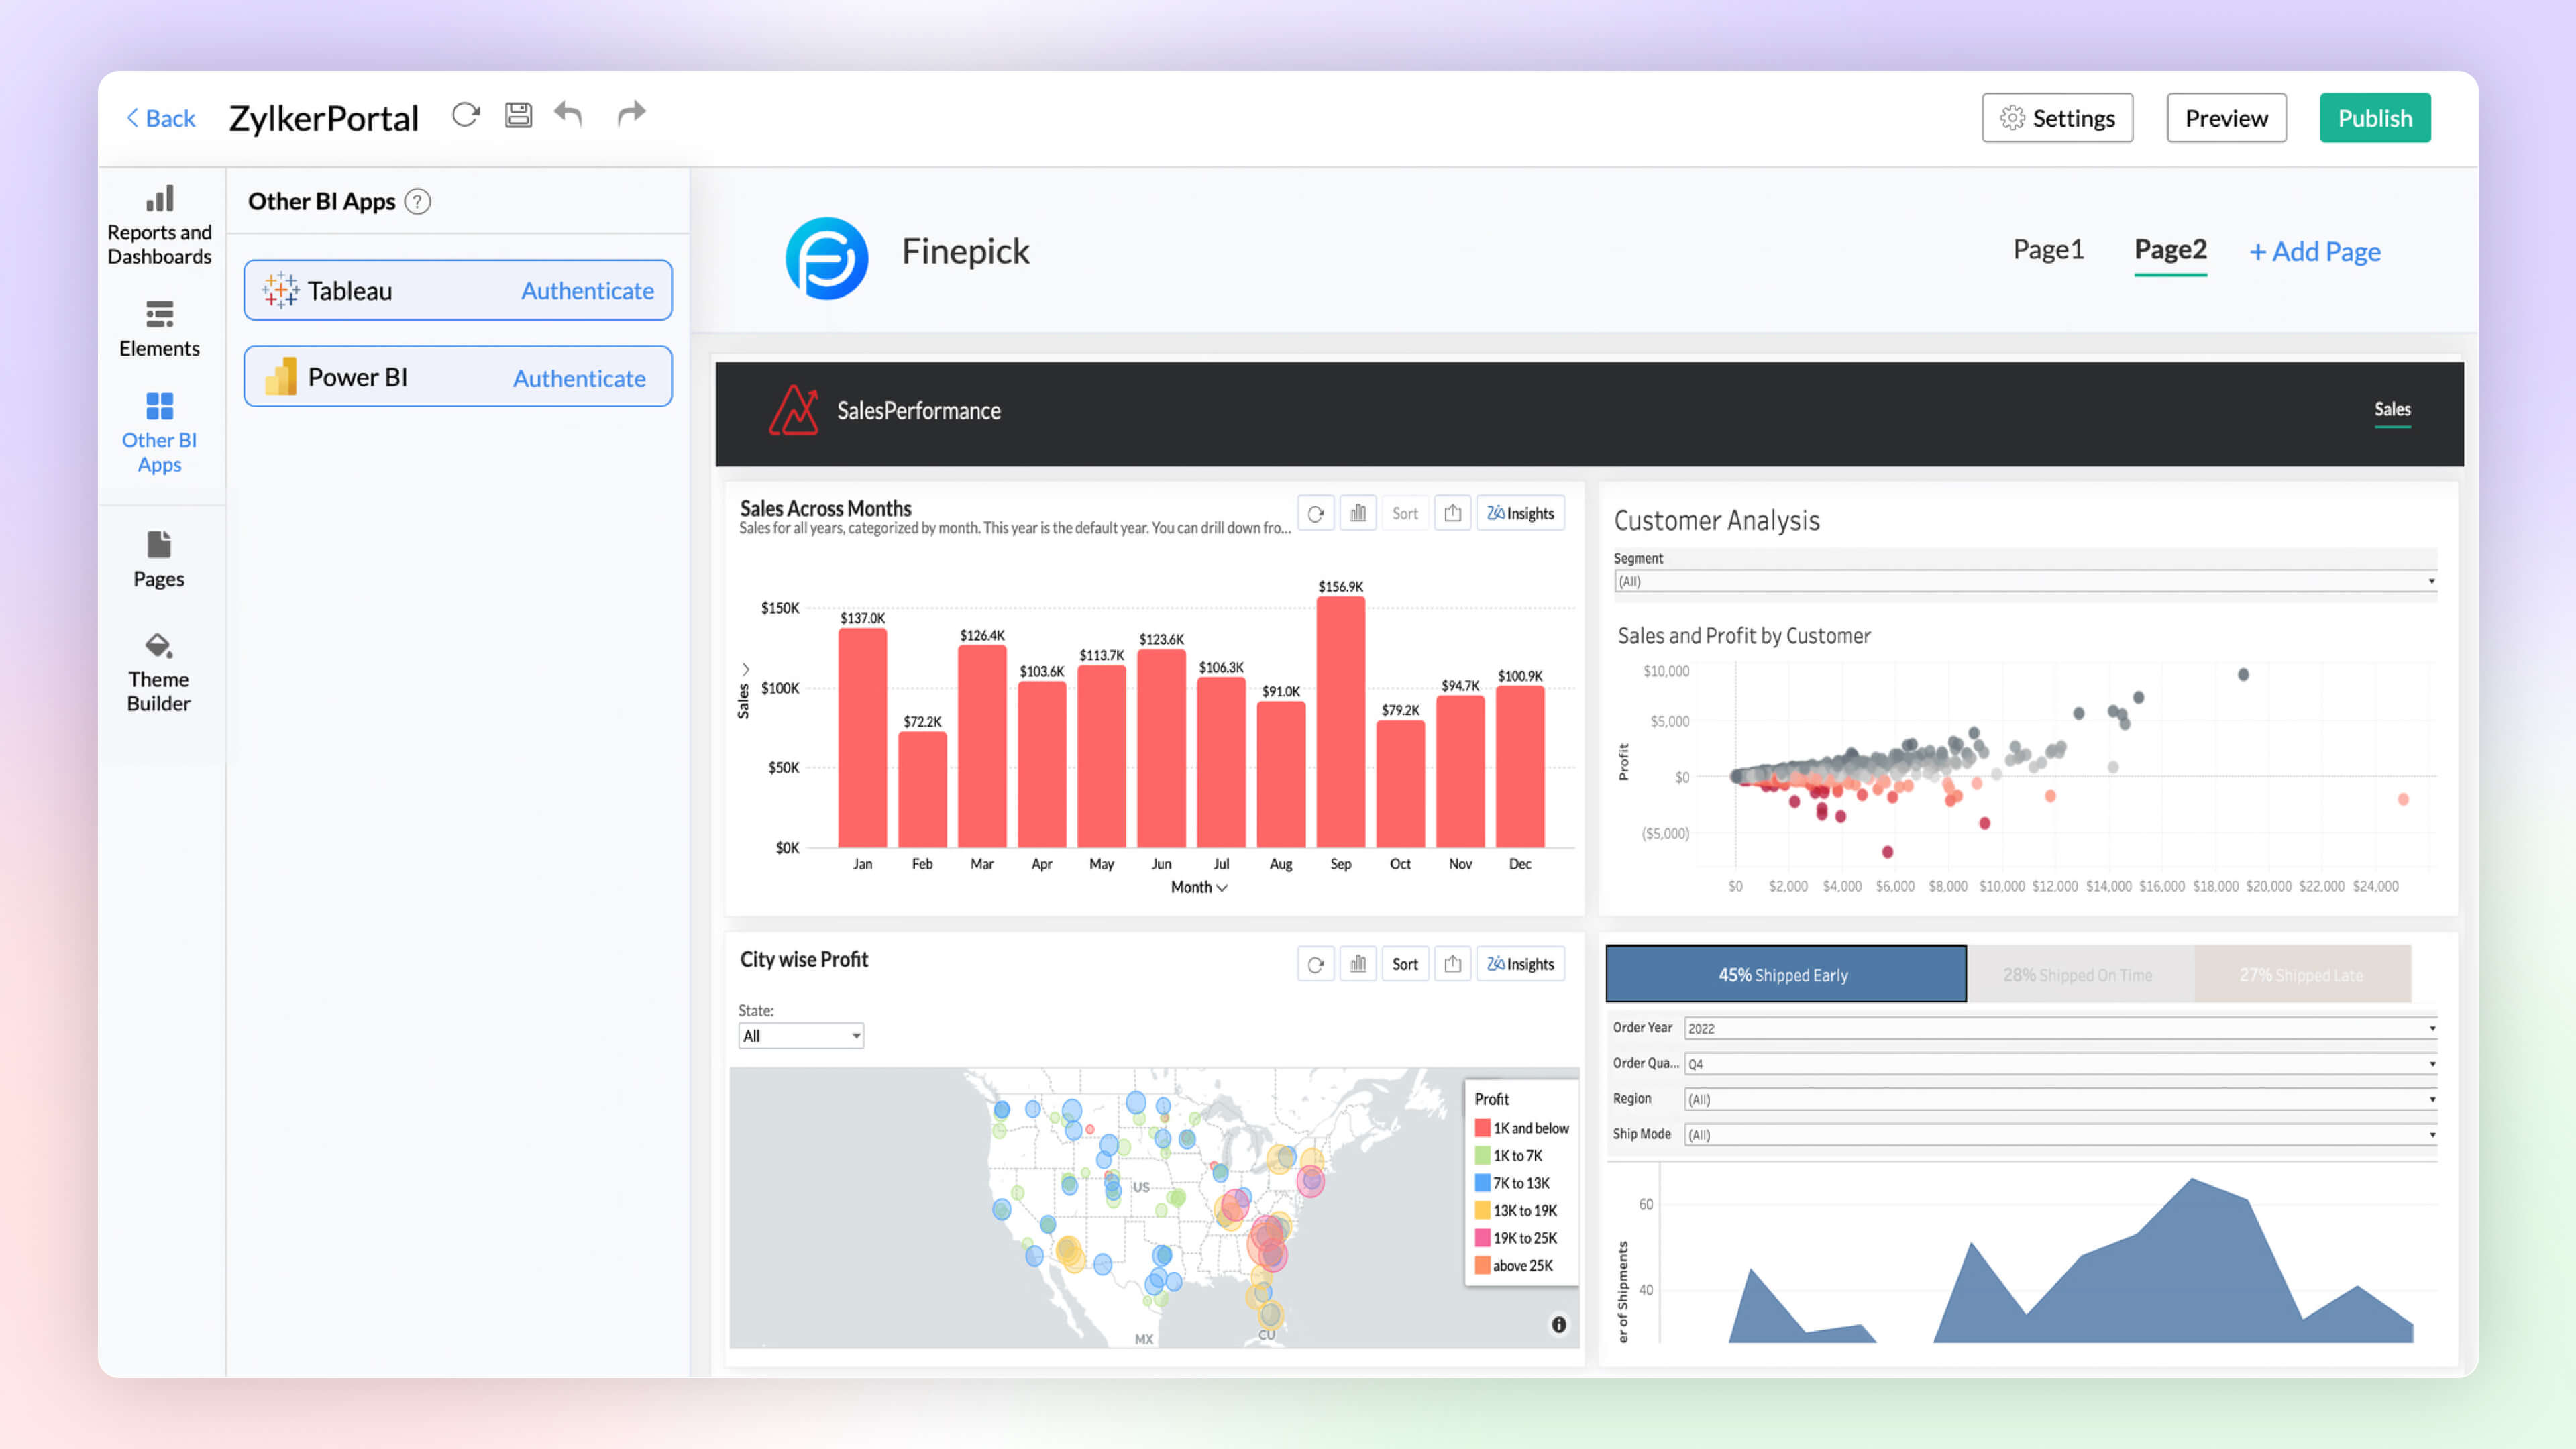
BI Fabric
Create unified BI portals by collating insights from other BI applications such as Tableau and Power BI along with Zoho Analytics. Setup fine-grained access control on the portal for secure access. Unified BI Fabric portal helps in easy access to insights from a centralized portal, breaking the boundaries across BI services.
Click here to learn more.
Security Enhancements
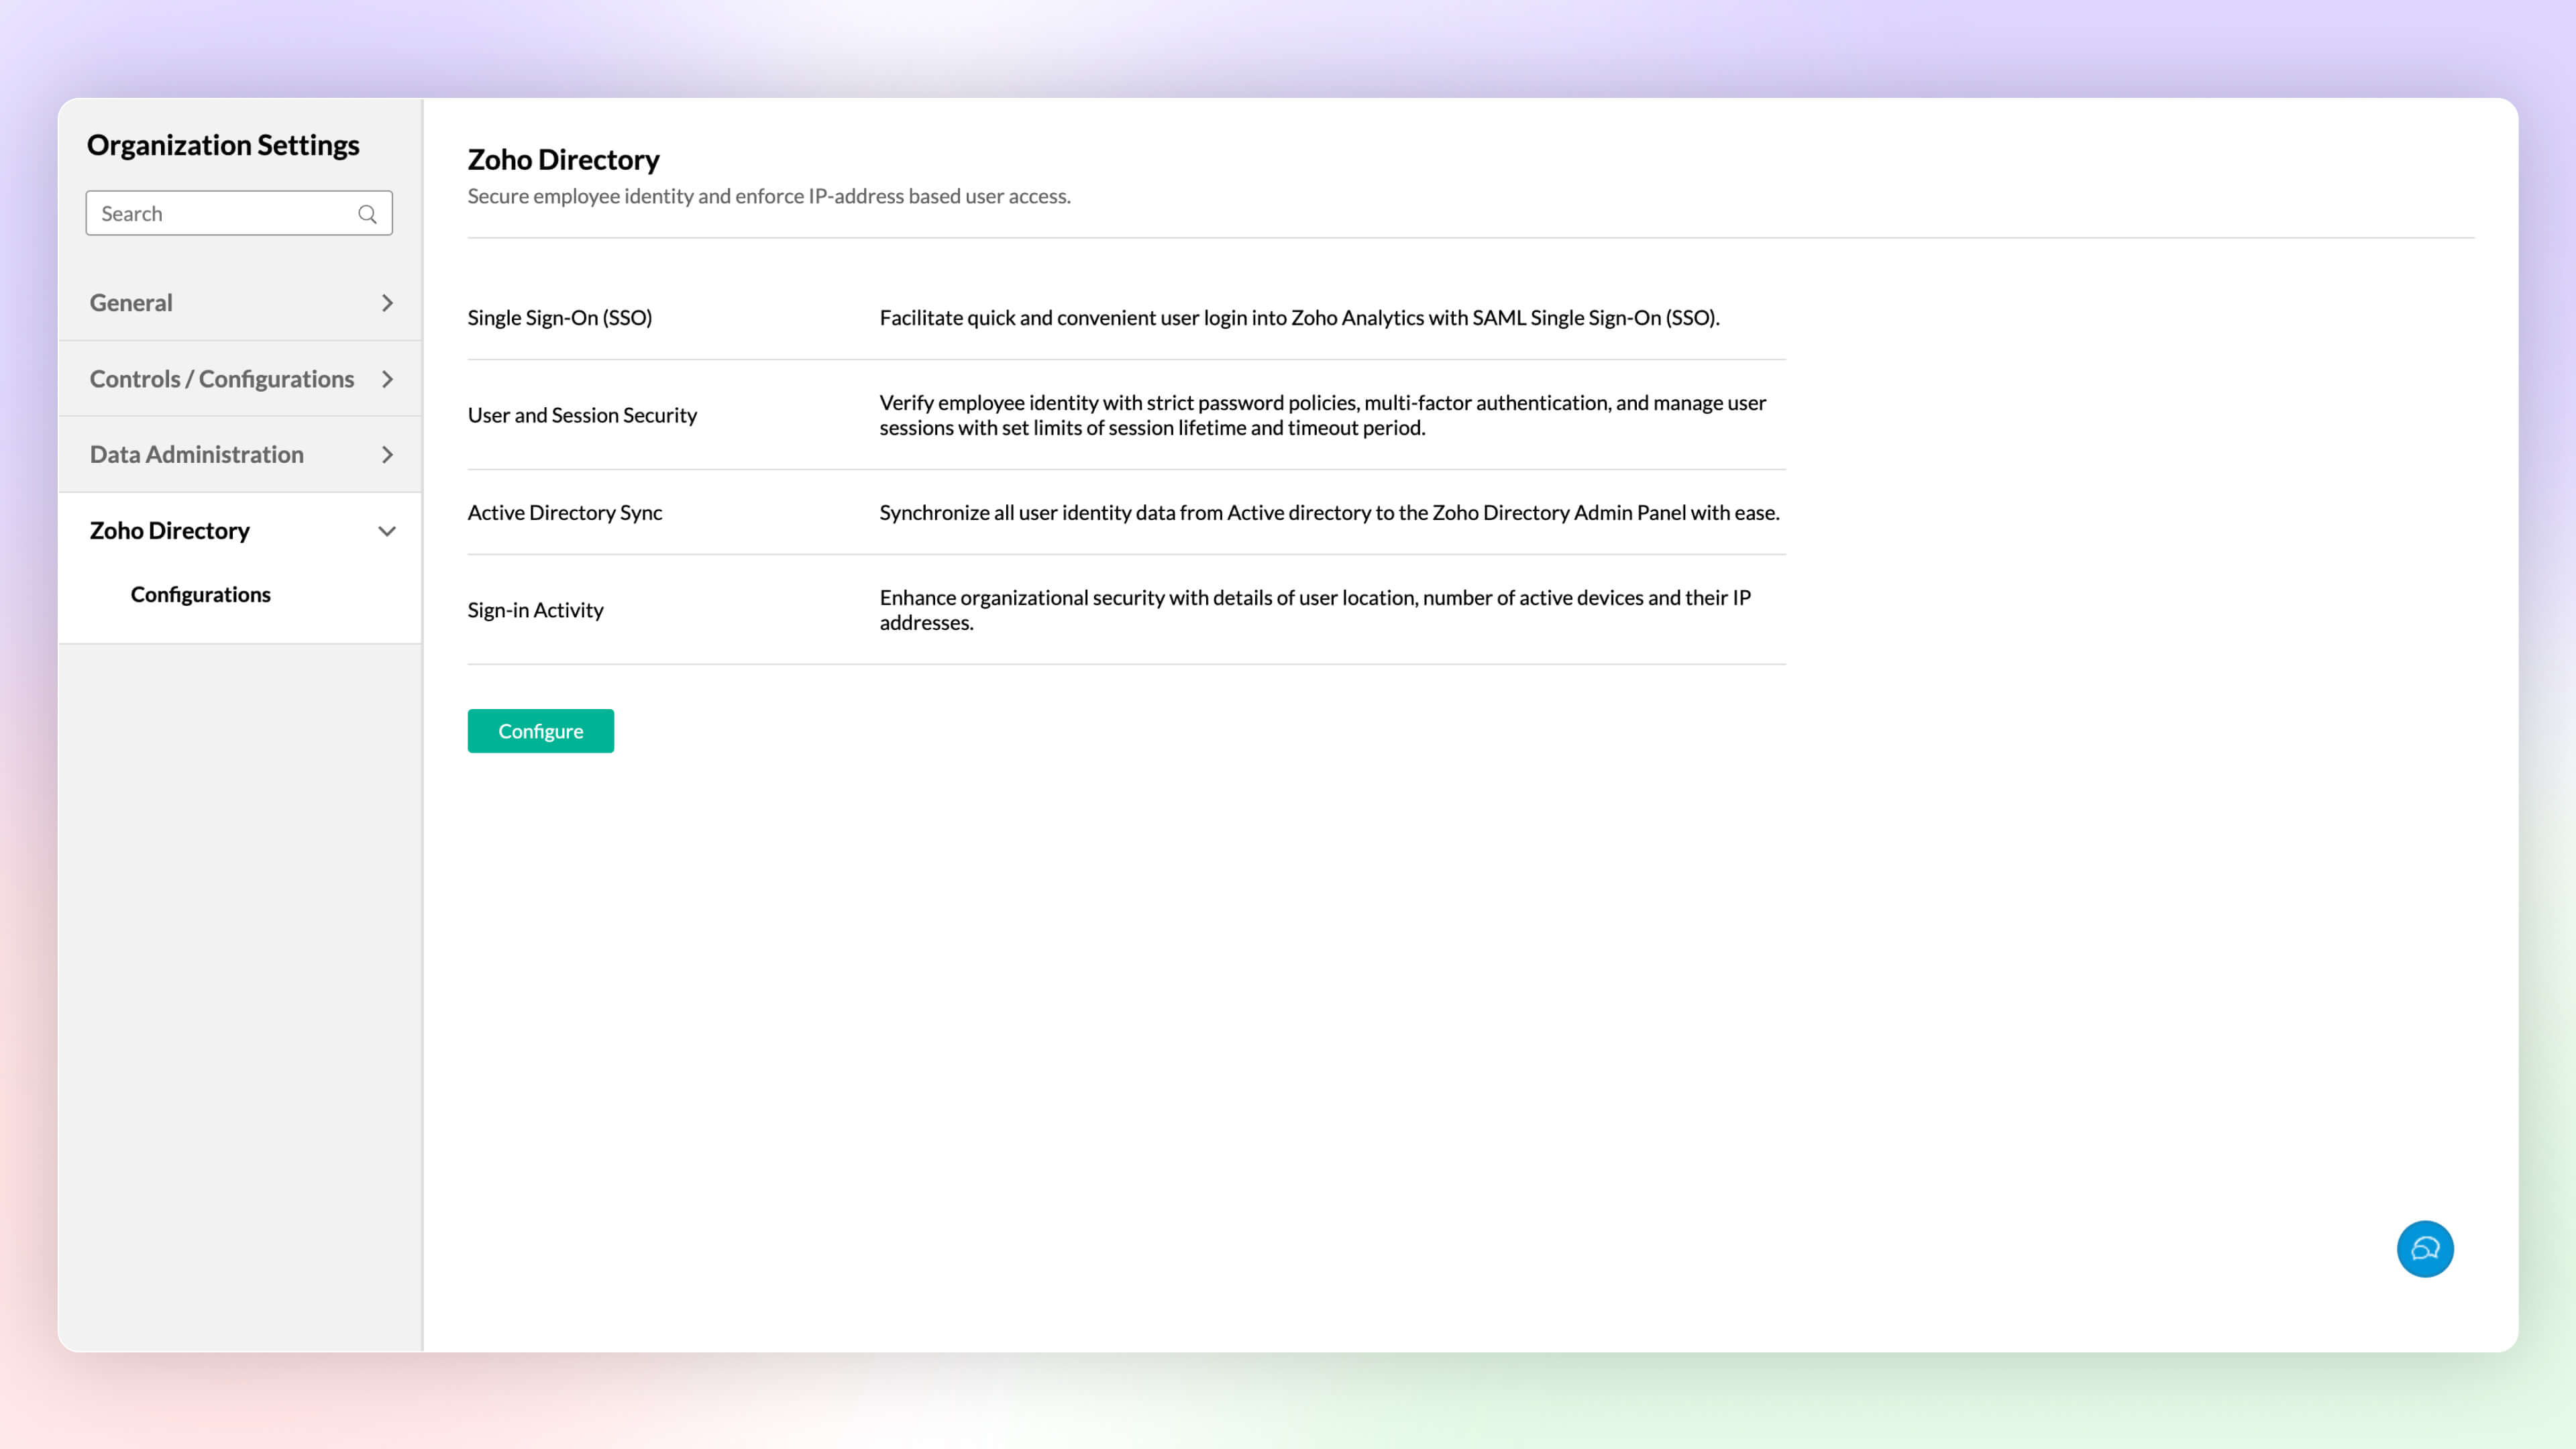
Zoho Directory
Zoho Analytics integration with Zoho Directory allows administrators to setup single sign-on, Active Directory sync, handle user access management and more.
Click here to learn more.
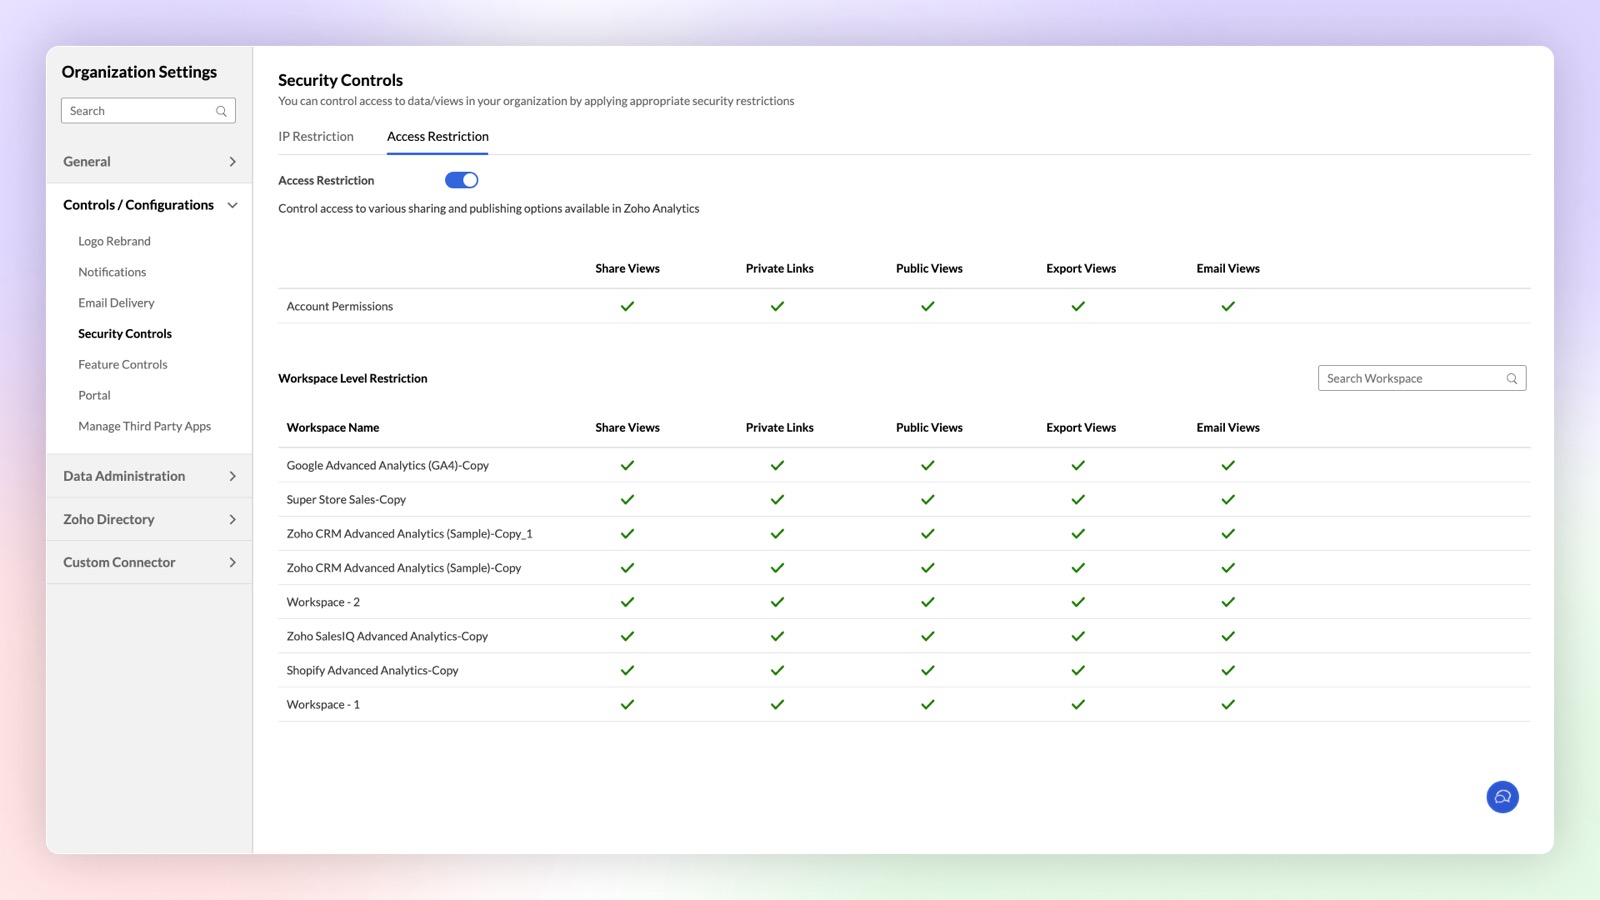
Access Restriction
Zoho Analytics now offers enhanced security controls to setup fine-grained access restrictions at the workspace level. Apart from the organization level access restriction controls, this new update allows you to setup different restrictions for different workspaces.
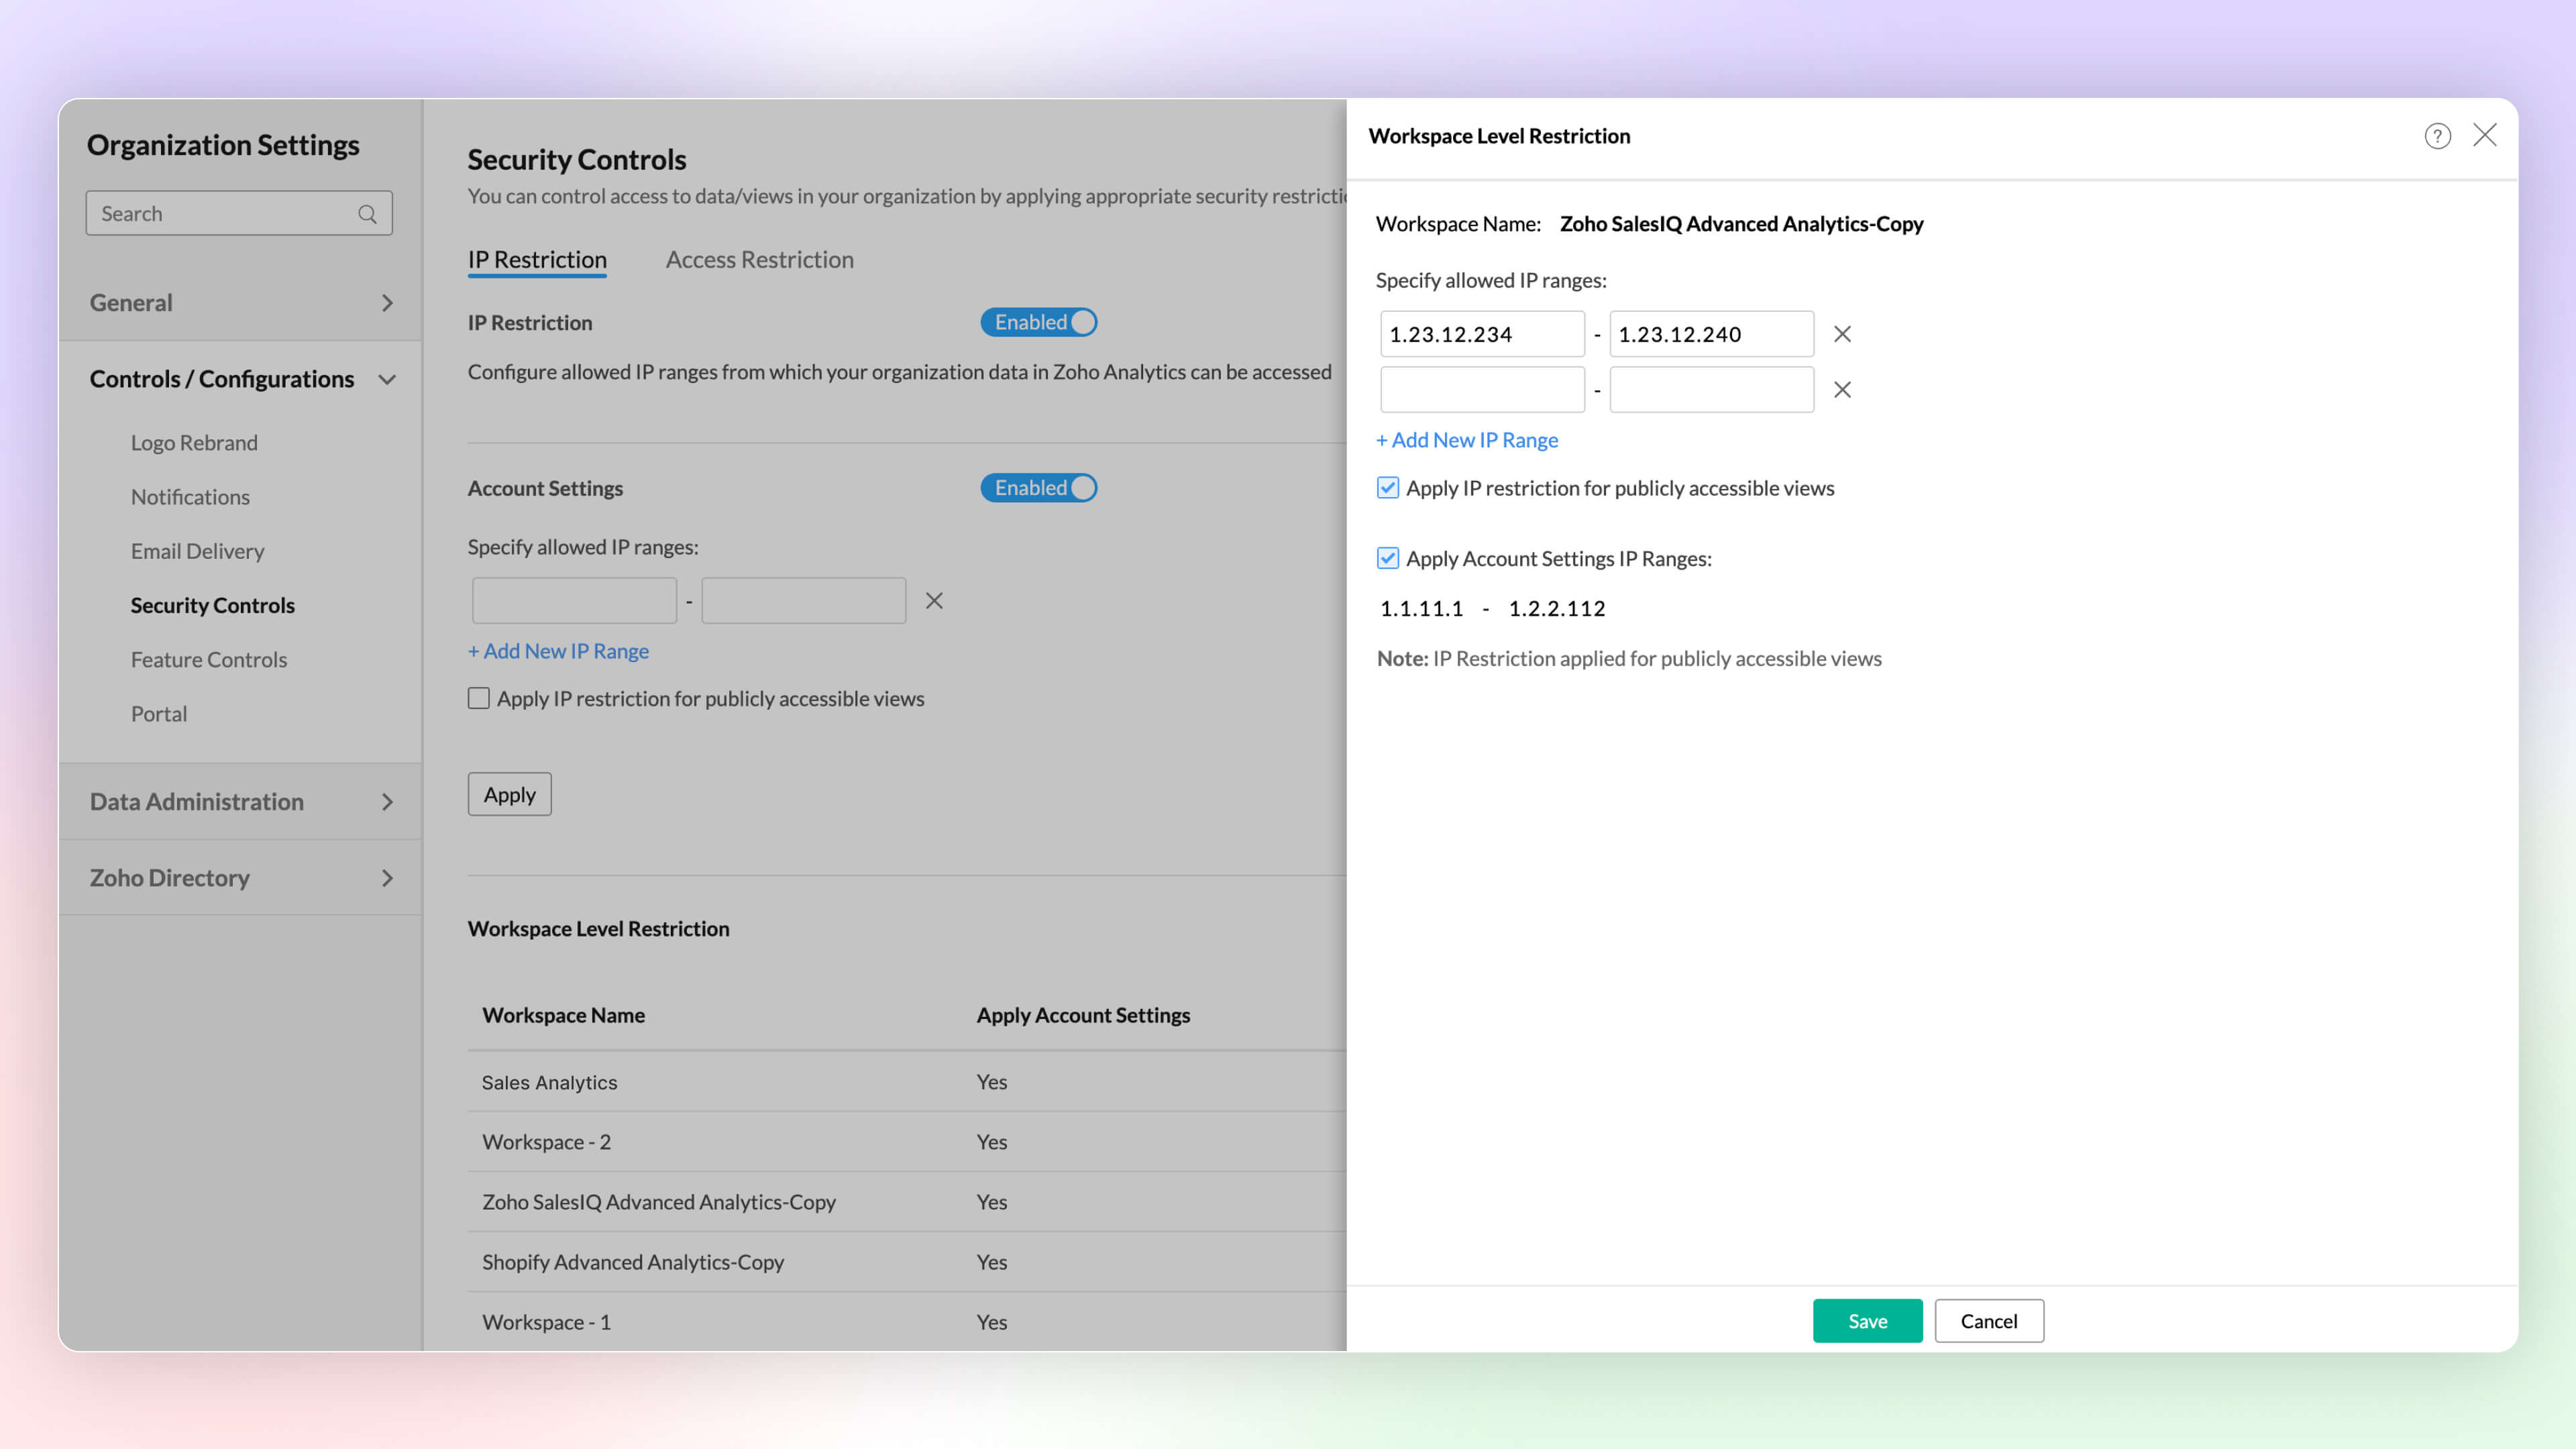
IP Restriction
Configure workspace-level IP restrictions for enhanced security and prevent unauthorized access. Previously, IP restrictions were available only at the account level.
Click here to learn more.
Other Updates
UI Enhancements
New Intuitive and User-friendly Interface
Zoho Analytics' new user experience features glass-morphism, offering a modern, translucent design that improves visual clarity. This sleek update makes data visualization more intuitive and user-friendly.
Right to Left User Interface
Zoho Analytics now supports a right to left user interface. This option is best suited for languages like Arabic and Hebrew that are read from right to left.
Puvi Font Support
Zoho Analytics now supports Zoho's own font, Puvi. You can try this new font from the Profile tab.
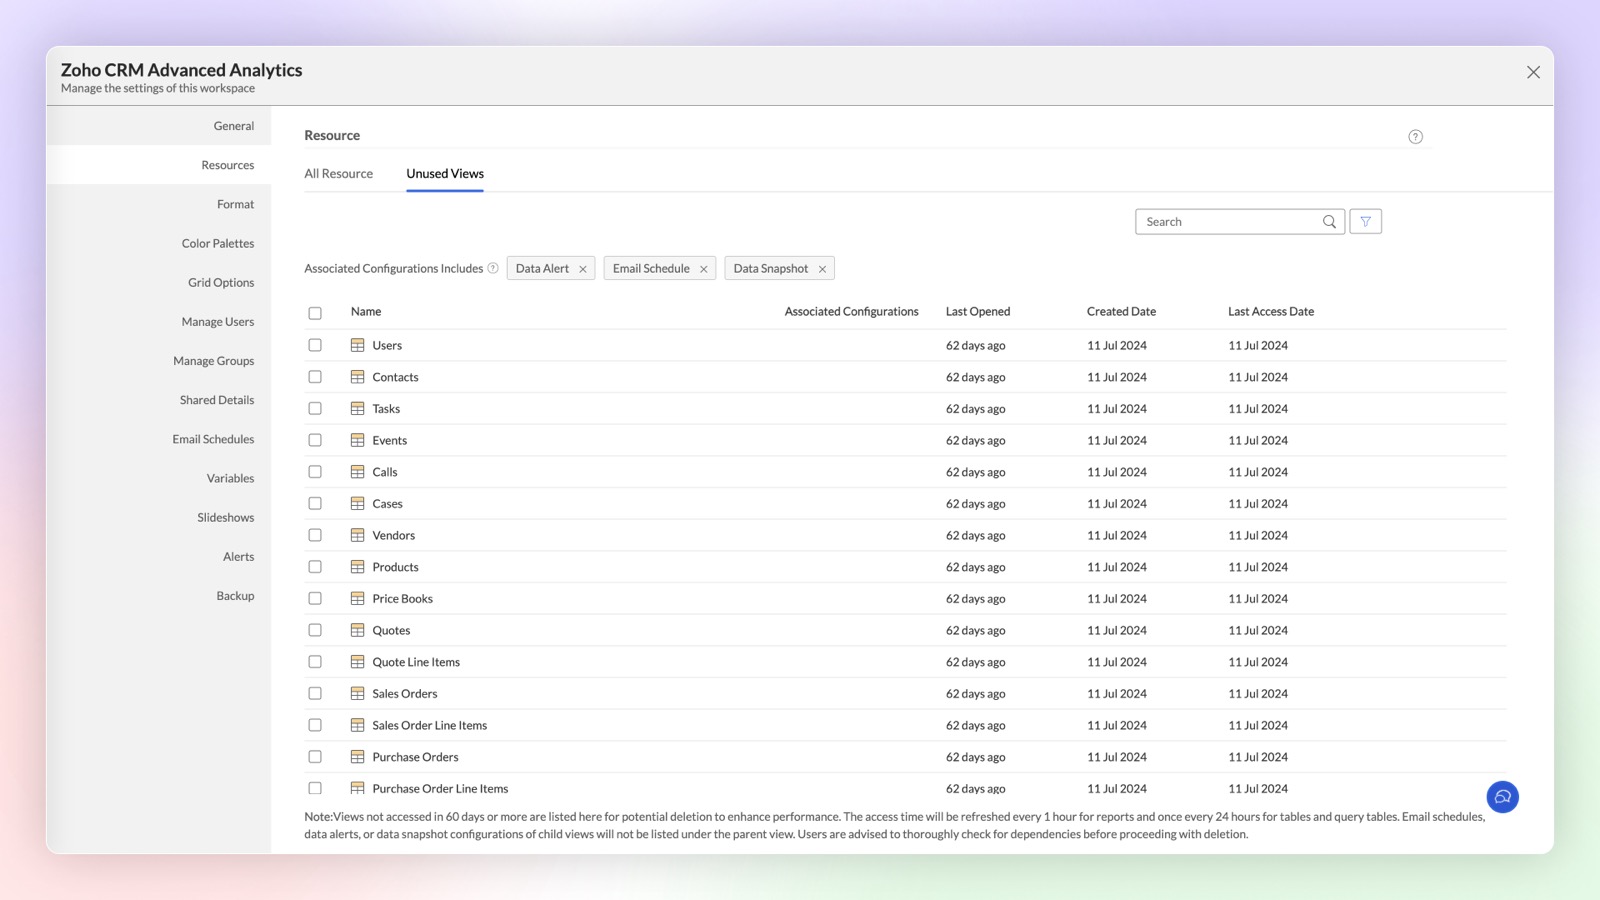
Unused Views in Workspace
Views and tables created in Zoho Analytics may sometimes go unused for extended periods due to reduced relevance. These inactive views and tables are now categorized under the "Unused Views" section at the workspace level, helping you decide whether to maintain or remove them.
Share to Slack
Improve collaboration and increase productivity by integrating Slack and Zoho Analytics.You can now easily share tables, reports, and dashboards to Slack users by this integration.
Click here to learn more.
Topic Participants
Rakesh Ramkumar B
Tejesh
Bhuvaneshwaran
HEINER MISAS PARRADO
Storytelling BeanCounter - www.storytellingbeancounter.com
Sticky Posts
What’s New in Zoho Analytics – September 2025
Hello Users!! In this month’s update, we’re raising the bar across multiple touchpoints, from how you bring in data, plan and track projects to how you design and brand your dashboards. We’ve added the all-new Gantt chart for project visualization, expandedAnnouncing Agentic AI - Ask Zia!
We are delighted to roll out the new agentic AI capabilities in Ask Zia, where every stage of the BI workflow is assisted by AI. With a human-in-the-loop approach, Ask Zia ensures that you’re in command of the decision, while AI handles the complexity.Invitation-Based User Access in Zoho Analytics
Hello everyone, We’re rolling out an important update on how users are added to your Zoho Analytics Organization and Workspaces. Previously, when admins added users, they were automatically added to the organization. Moving forward, to improve securityZoholics Europe 2025: Your Ultimate Data Analysis (Zoho Analytics) Workshop Experience
Why should you attend? This year, Zoholics Europe 2025 is putting data analysis centre stage. With a dedicated workshop designed to answer all your data-related questions, you’ll gain practical skills, real-time solutions, and expert insights that you[Webinar] Evolving BI & Analytics in the Age of AI
Artificial intelligence is redefining how data is collected, analyzed, and leveraged across industries. As businesses strive to become more agile and insight-driven, traditional BI and analytics must transform to meet new demands. AI-first organizations
Recent Topics
IMAP Block
My two accounts have been blocked and I am not able to unblocked them myself. Please respond to email, I am traveling and this is urgent."DKIM not configured"
Hello. I have been attempting get the DKIM verified but Toolkit keeps sending the message that it is not configured, but both Namecheap and Zoho show it as configured properly. What am I missing?Zoho mail with custom domain not receiving email
i registered zoho mail with my own domain. I can login and access the mail app. I tried to send email from an outlook email account and an icloud email account. Both emails were not received. My plan is free. I also tried to send email from this zohoSet connection link name from variable in invokeurl
Hi, guys. How to set in parameter "connection" a variable, instead of a string. connectionLinkName = manager.get('connectionLinkName').toString(); response = invokeurl [ url :"https://www.googleapis.com/calendar/v3/freeBusy" type :POST parameters:requestParams.toString()Waterfall Chart
Hello, I would like to create a waterfall chart on Zoho analytics which shows the movement in changes of budget throughout a few months, on a weekly basis. Should look something like the picture below. Does anyone know how to?Help Center and SEO: Any Benefit to My Domain-Mapped Website Ranking?
First of, I love the Help Center which I've just decided to integrate into my website to replace its old-fashioned FAQs. So much more to achieve there now! Lots of new benefits to the site visitors and to me in terms of organizing and delivering all theIssue with Importing Notes against Leads
Hi, I am attempting to import some Notes into Zoho CRM which need to be assigned to various Leads. I have created a csv file which I am testing that contains just one record. This csv file contains the following columns: Note Id Parent Id (I haveTrigger a Workflow Function if an Attachment (Related List) has been added
Hello, I have a Case Module with a related list which is Attachment. I want to trigger a workflow if I added an attachment. I've seen some topics about this in zoho community that was posted few months ago and based on the answers, there is no triggerCreator Add Records through API - Workflows not triggered ?
Hi Everyone, I am trying to add records to my Creator application through a third party app that I am developing. Currently, I am testing this through Postman. The records I need to add have a lot of workflows to run to populate dropdowns, fields, useZoho Error: This Operation has been restricted. Please contact support-as@zohocorp.com for further details
Hello There, l tried to verify my domain (florindagoreti.com.br) and its shows this error: This Operation has been restricted. Please contact support-as@zohocorp.com for further details. Screenshot Given Below - please check what went wrong. ThanksImportant Update: Changes to Google Translate Support in Zoho SalesIQ
We’re updating our default chat translation options across all Zoho SalesIQ data centres to offer a more secure, in-house solution for your translation needs. What’s changing? We will be offering Zoho Translate (our in-house tool) as the default translationFSM Improvement Idea - Show an Import button when there is no data
I am setting up FSM for a client and I noticed that there is no option to import data, see screenshot below. Even when you click Create Contact there is only an option to Import from Zoho Invoice. It is only after you add at lease 1 record that the ImportZoho CRM Community Digest - July P1 | 2025
Hey everyone, The start of July 2025 marked a special milestone: 200 posts in our Kaizen series! For those new here, Kaizen is a go-to series for Zoho CRM developers, where we regularly share best practices, tips, and expert insights to help you buildJoin our BI & Analytics Workshop at Zoholics UK 🇬🇧
Hello users, We are thrilled to announce a hands-on workshop at Zoholics UK, 2025, led by Ashwinth and Alan, our Product Experts. This session is designed for anyone who wants to move beyond raw data and truly understand their business performance usingWhat’s New in Zoho Expense (April – July 2025)
Hello users, We're happy to bring you the latest updates and enhancements we've made to Zoho Expense over the past three months, which include introducing the Trip Expense Summary report in Analytics, extending Chatbot support to more editions, rollingWeekly Tips: Insert frequently used phrases in a jiffy using Hotkeys
You often find yourself using similar phrases in an email —like confirming appointments or providing standard information. Constantly switching between the mouse and keyboard interrupts your flow and slows you down.Instead of typing the same phrases overUndo Command in Notebook
It would be handy to have an Undo in the row of icons at the bottom of the notes.Improved UI for a Seamless User Experience - Calls, Tasks, and Meetings
Hello all, We are making UI unification across CRM so that the UI experience is seamless across the product. As part of that effort, we have made changes to the details page of activity-based module records—Meetings, Calls, and Tasks. Let's look at theseNew Customization options in the module builder: Quick Create and Detail view
Hello everyone, We have introduced two new components to the module builder: Quick create and Detail view. The Quick Create Component It is a mini form used to create a record and associate it to the parent record from a lookup field. For example, if you have a Deals lookup in the Contacts module, then you can associate existing deals or create a deal and associate it with the contact. You can customize this Quick Create form by adding standard as well as custom fields. There is no limit to the numberCross References Do Not Update Correctly
I am using cross references to reference Figures and current am just using the label and number, i.e. Figure #. As seen here: When I need to update the field, I use the update field button. But it will change the cross reference to no longer only includingAdd multiple users to a task
When I´m assigning a task it is almost always related to more than one person. Practical situation: When a client request some improvement the related department opens the task with the situation and people related to it as the client itself, the salesmanNarrative 9: GC—Meaningful conversations that benefit your customers
Behind the scenes of a successful ticketing system - BTS Series Narrative 9: GC—Meaningful conversations that benefit your customers Customers often seek immediate solutions, which is why self-service options are essential. Guided Conversations providesFSM App Oddity
We recently rolled out FSM to our technicians, and only one technician is having an issue. He's using an iPhone with iOS 18.6 installed. When he goes to service appointments using the calendar icon at the bottom of the app, he gets a list view only. Typically,Cliq Not Working !
Zoho Cliq has been experiencing connectivity issues since this morning. The app is unable to establish a connection with the server.Injecting CSS into ZML pages
Is there a way to inject CSS into ZML pages? Use case: 1. Dashboard displays 'Recent Activities' card displaying a list of newly added records 2. Each item in list links to the record onClick 3. When a user points the cursor over an item in the list,Power of Automation :: Automated Weekly Notifications for Unapproved Timesheets
Hello Everyone, A custom function is a software code that can be used to automate a process and this allows you to automate a notification, call a webhook, or perform logic immediately after a workflow rule is triggered. This feature helps to automateExtracting Data from Sitelink APIs
Hi All, I'm working to pull data on Sitelink using API calls but i can't seem to extract it. If you click expand, you will see it has a lot of data in it. I tried extracting from the map but it's not giving me anything. Is there a workaround on this orExport a list of fields for all modules in a spreadsheet with specific field data
Many of my clients are using spreadsheets to create lists of fields for all modules when starting a new implementation or when updating an existing setup. This is a useful process but also a very time consuming one. It would be good a list of fields could[Important announcement] Zoho Writer will mandate DKIM configuration for automation users
Hi all, Effective Dec. 31, 2024, configuring DKIM for From addresses will be mandatory to send emails via Zoho Writer. DKIM configuration allows recipient email servers to identify your emails as valid and not spam. Emails sent from domains without DKIM【Zoho Backstage】2025年7月のアップデート紹介
本投稿は、本社のZoho Desk コミュニティに投稿された以下の記事を翻訳し、一部抜粋したものです。 What's New - July 2025 | Zoho Backstage ユーザーの皆さま、こんにちは。コミュニティチームの中野です。 本投稿では、Zoho Backstage の直近のアップデートを3点抜粋して、ご紹介します。 目次 1.参加可否の確認:RSVP 2.証明書作成ツール:Certificate Builder 3.登録の承認 :Registration Approval 1.参加可否の確認:RSVPOption to select location?
As a business coach, I meet with clients at various public locations. I have two or three pre-determined locations that I meet at. I would like the client to choose the location when booking an appointment. Is there a way to do that with a single service, or is the best way to accomplish this by creating one service for each location offered?Can we have Backorder Management ?
Can we have Backorder Management ?Display a field of an Account on the Ticket view
Hi there, We would like to display of the Account of the user submitting a ticket on the ticket view. See for example: How can this be achieved? It doesn't really matter where it will be placed as long as it is shown there. Thanks, SnirTwo factor authentication for helpdesk users
The company i work for wants use the helpdesk site in Zoho desk, as a place for their distribution partners to ask question and look for information about our product. The things there is suppose to go up there is somewhat confidential between my companyRemove "Invalid entries found. Rectify and submit again" modal
Following up on a post from a few years back, but can the Zoho team consider either removing the 'Invalid entries found. Rectify and submit again' modal that displays for empty mandatory fields OR allow an admin to change it? I've built a custom errorInsurance Agencies
I am reaching out to see if anyone has any experience in the Insurance Agency world with using Zoho exclusively for the CRM and commissions side of things. Lots of strong features like drip campaigns, meeting, calendars, emails, can all be found in here.Problem with Egyptian internet ISP
Dears, We have problem with our ADSL internet SP, That your site not working with. So, we contact them and they asking us to contact you to solve this problem. The problem that when we are connecting to Tedata ADSL your website not working (Business Email). BR,, Mohamed OmarEmails not being received from a particular domain
Cannot receive any emails sent from atco.com Domain is in the spam whitelist so should be no reason for it not to be coming through. Have filed a ticket and besides a generic response of we are looking at it - it seems there is no actual support workersMail Not Showing In Inbox or Sent Box
Hi, there are mails that are not displaying in both my inbox and sent box. I just tried the iPad app and it is the same but there is a blank field where a mail should be and it refers to a server error. Please fix this.Possible to bold or indent text in the description field?
As part of one item, I often have a detailed description that would be much easier to read if there was the ability to have a bulleted list or bold text and the like. Is this possible? My last invoicing software allowed markup in the field so, for example, an asterisk meant a bullet. I haven't been able to find any documentation related to this. Any information would be appreciated. Thank you.Next Page