How to create a boxplot chart in Zoho Analytics?
Hi,
I'm looking forward to making a boxplot in Zoho Analytics, either with all my data or with a time segmentation.
No documentation or YouTube video explaining that was found.
I guess this is a feature gap.
How feasible would it be to add this to Analytics?
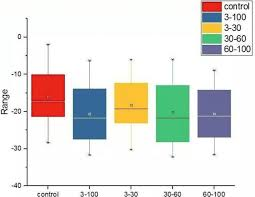
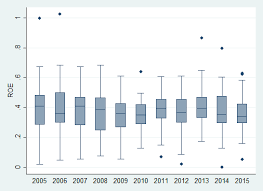
Examples: