Visualize your data with a new set of charts: Treemap, Butterfly, Sankey, and Cluster charts in Zoho CRM
Dear customers,
When it comes to analytics, it's not just about the numbers; it's about understanding the story behind them.
With that philosophy in mind, we’re excited to introduce a line of representations to the existing array of chart types in Zoho CRM: Treemap, butterfly, sankey and cluster charts. Let's go!
Treemaps
Treemap charts are used to visually represent hierarchical datasets in a rectangular layout. It aligns its parent categories as larger tiles with their sub-categories nested within them. The size of each tile is proportional to its corresponding value, making it easy to compare different segments within the hierarchy.
This is how a treemap chart looks:

These structured data representations help you understand overall performance and contributions, as well as compare participating entities at a glance.
Unlike traditional bar charts or pie charts, treemaps can be used if your datasets are large and exhibit parent-child relationships.
Here are some examples to better understand their usage:
Comparing revenue distribution between functions
A company's revenue is distributed among its functions before it gets further disbursed to its employees. Treemap charts can be used to depict this distribution and compare it between functions. As you can see below, the hierarchy can be represented as a treemap to compare it directly with other functions:

The hierarchy at the top shows just the numbers and levels, but the treemap chart represents the numbers proportionally, allowing leaders to visualize the difference in distribution.
Interpretation: As you can easily see in the treemap, sales and marketing receive the same amount of revenue, while engineering is given significantly more than the other two.
Likewise, with treemap charts, you can:
- Compare popular lead sources with lead counts is the measure and lead source being the participating entity—a classic single-grouping configuration.
- View cost savings achieved across departments. With the departments as the grouping parameters and the cost saved as the measured amount, the chart lays out all the departments as tiles in proportion, based on money saved.
- Compare ad spends across channels, where channels are the parent grouping and ad spend is the measured unit.
Butterfly
Butterfly charts are used to compare two related datasets side-by-side, resulting in a representation that looks like a butterfly or tornado.
Now, how does it differ from bar charts?
The standard bar chart can compare two entities for a given measure. Say, you are comparing the performance of Mary and Charles. The two users' data is represented using bars, and the length will denote their performances. But, when it comes to comparing their performances over a period or their contribution across different stages, a bar chart is not sufficient.


With butterfly charts, you can:
- Compare revenue between two of your branches each month. With branches being compared for sum of sales revenue, grouped by closing date.
- Compare the performance of two reps in a given quarter. Compared between two users for average of amount of deals, grouped by closing date until today.
In addition to the user-based comparison above, butterfly charts are well-suited to visualizing other types of data comparisons, like:
- Picklist-based comparisons
- Duration-based comparisons
- Aggregate-based comparisons
Business scenario
Comparing the number of deals closed for each lead sources: Duration-based comparison
You can identify the productive lead source by comparing the number of deal closures for every lead source in your organization based on their closing week.

Analyzing effective sales methodology, inbound vs. outbound: Picklist-based comparison
Businesses use both inbound and outbound lead generation strategies, and each of these methods can reap different results based on the season and occasion. By comparing inbound versus outbound each month, you can identify which works best at what time.

Analyze the amount versus the expected revenue between accounts: Aggregate-based comparison
Expected revenue is a result of a deal's progression in the sales pipeline. Comparing the amount versus their expected revenue will not only help visualize the expected revenue of participating accounts but also indicate the accounts' stage in the sales pipeline.

Sankey
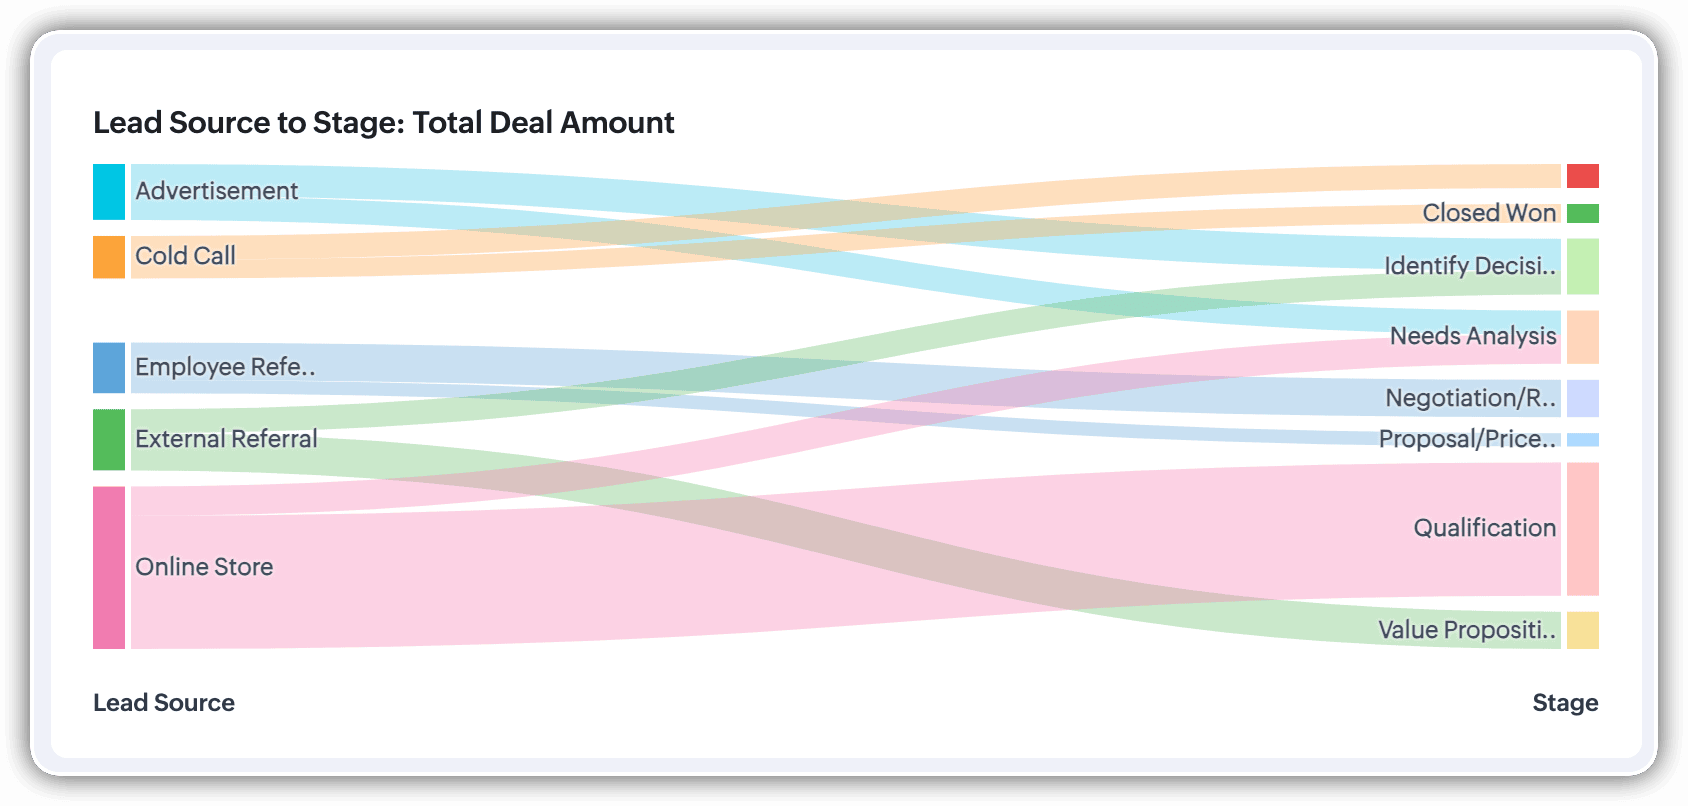
A Sankey Chart is designed to visualize the movement of data across different data groups. Unlike traditional charts—such as bar, column, pie, or donut—that mainly provide a static distribution of values, the Sankey Chart focuses on illustrating the flow between multiple segments or grouping fields. This makes it an ideal choice when you want to track how values (like lead counts, revenue, or deal statuses) move from one category to the next.

Key features
- Flow visualization: With the Sankey Chart, you can observe the movement of data between different groups.
- Multiple grouping fields: This chart works best when you have at least two grouping fields. You can go even further and add a third grouping to see an even more detailed mapping of your data flow.
- Simple configuration: The configuration for the Sankey Chart is as simple as any other chart type in Analytics.
Business scenarios:
Imagine you’re a sales manager trying to get a better handle on your team’s performance and your company’s pipeline. You want to understand not just how many deals are coming in, but also which sources are contributing the most value—and how those deals are progressing through different sales stages.
Let’s say you want to understand which lead sources are driving the most deal activity and how those deals progress through the pipeline. You can create a Sankey chart that maps the count of deals from Lead Source to Stage.

After analyzing the chart, you might notice that Online Store brings in a high volume of early-stage deals, while sources like External Referral contribute fewer deals that are more likely to reach advanced stages like Proposal or Negotiation.
This insight helps you prioritize nurturing the most profitable channels.
Sankey charts can also be helpful in other operational scenarios where understanding transitions across stages or teams is essential:
- Regional revenue distribution: Visualize how revenue flows across different regions, product categories, and their corresponding annual revenue. This helps you compare which regions contribute the most to each product line and where your high-value segments lie.
- Ticket handling flow: Visualize the flow of support tickets from their origin channel to internal departments and finally to resolution statuses. This can reveal workload imbalances or common points of delay in your support process.
Cluster
A cluster chart is similar to stacked column charts, but instead of stacking horizontally, the data is represented as vertical bars. As you create a column chart with multiple groupings, you can change the type of column chart to a cluster chart to achieve this representation.

In the above image, you can see the stacked column chart compares the number of lead conversions based on popular sources between countries. The stacks appearing on top of existing stacks ask you to calibrate the record count (y-axis) based on the previous stacks, which can lead to inaccurate interpretations. In this case, a cluster representation will paint a clearer picture of the analyses.
Other minor enhancements:
In addition to the three charts we mentioned above, we've also made the following minor changes:
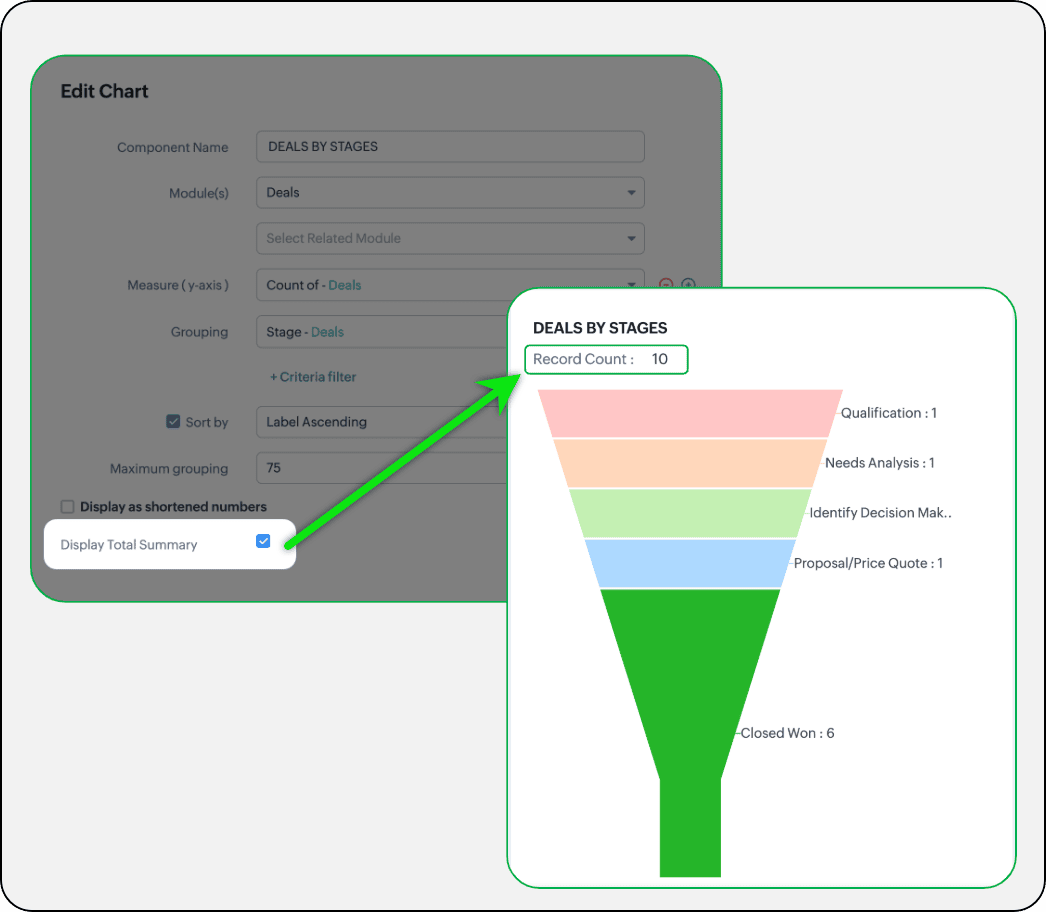
- Display total summary: Thus far, for all charts, each participating measure included labels. Now, to better understand overall contributions, a check box to display the total summary is provided under More options on the Chart Configuration page. Based on the configuration, the total revenue or the rolled-up quantities will be prominently displayed.
- Merge Y-axis: For charts that use two y-axis measurements, the intention is to view the progression of one entity against these two measures. Despite the scale, if the y-axis on the left is disproportionate to the values of the y-axis on the right, the plotted graph will result in a graphically and logically incorrect representation.
As you can see in the image below, the plot area of the sum of amount bar and the sum of expected revenue aligns close together, while, the difference between $700,000 and $40,500 is drastic, creating inaccurate interpretations.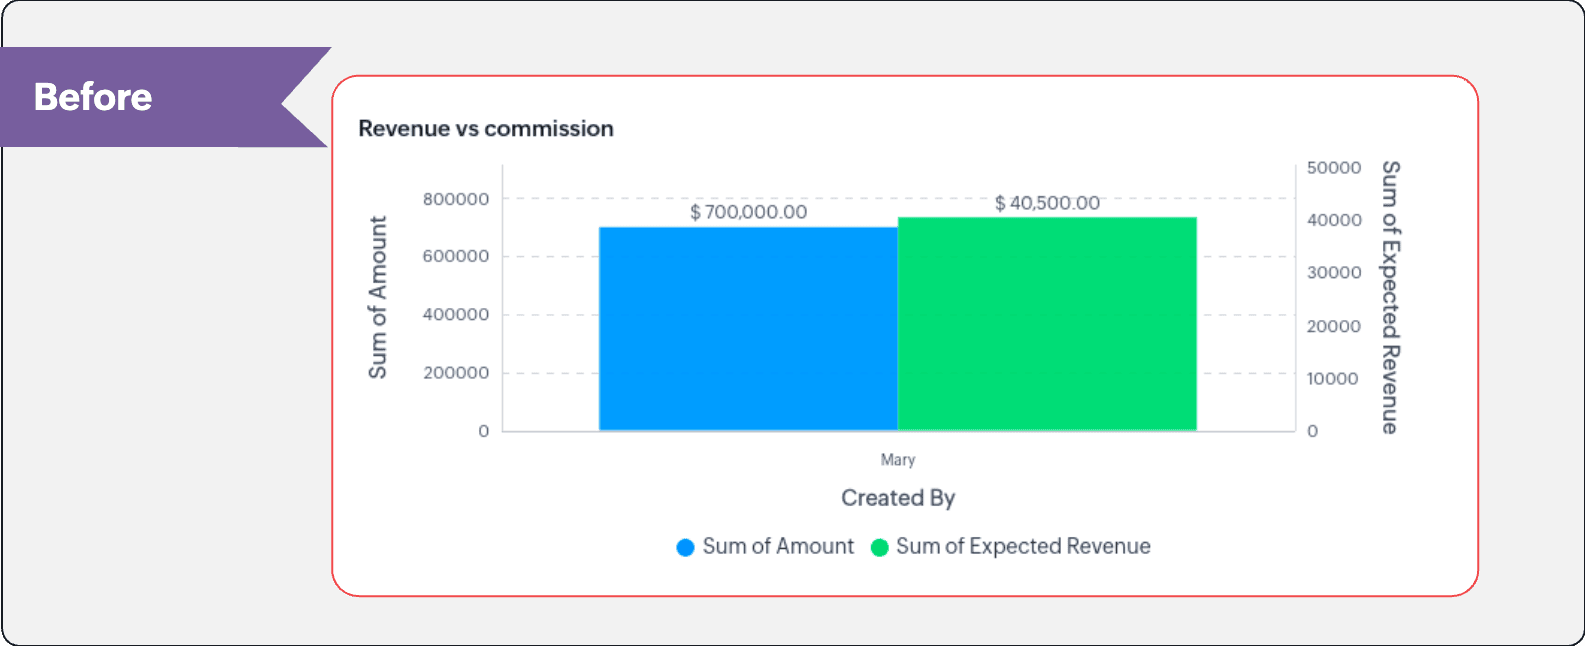
In this enhancement, we're allowing neighboring values of measures to merge so that the interpretation can be more visually accurate.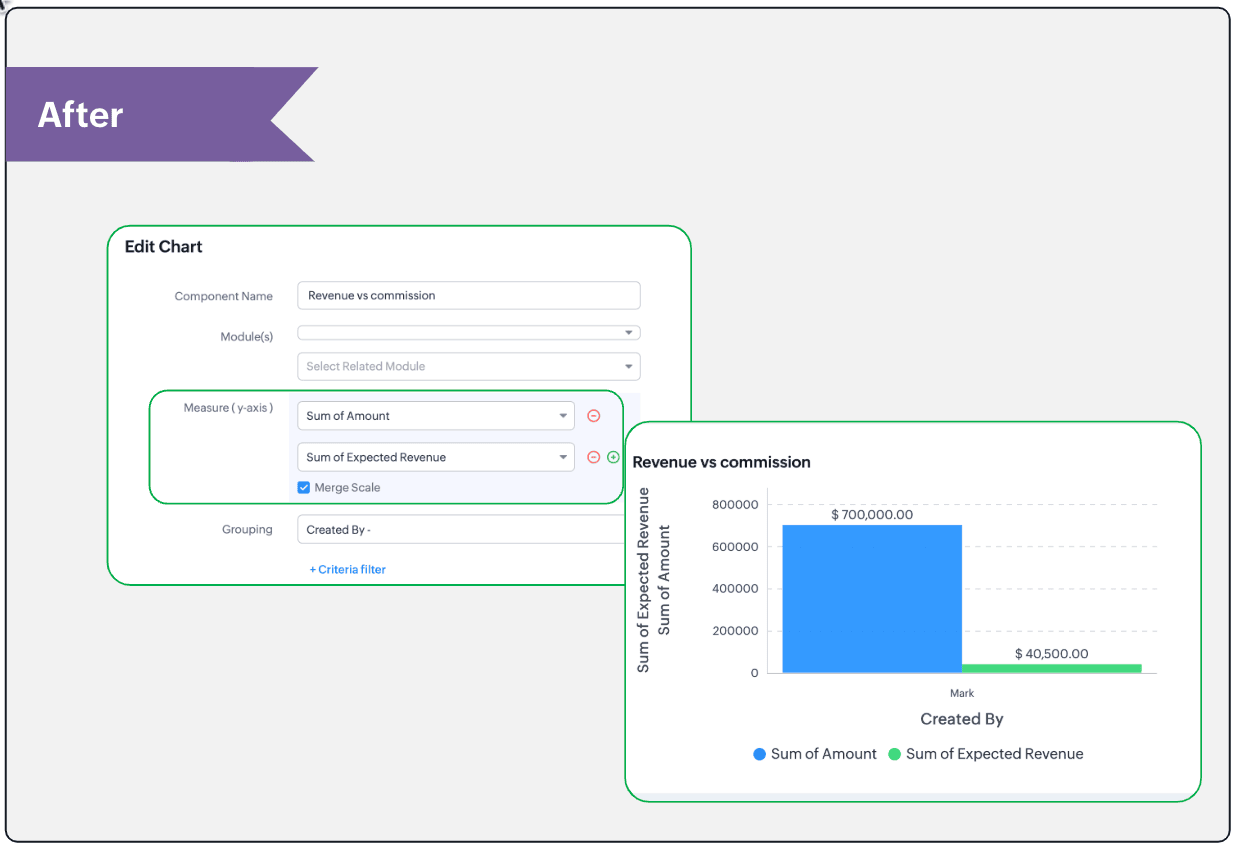
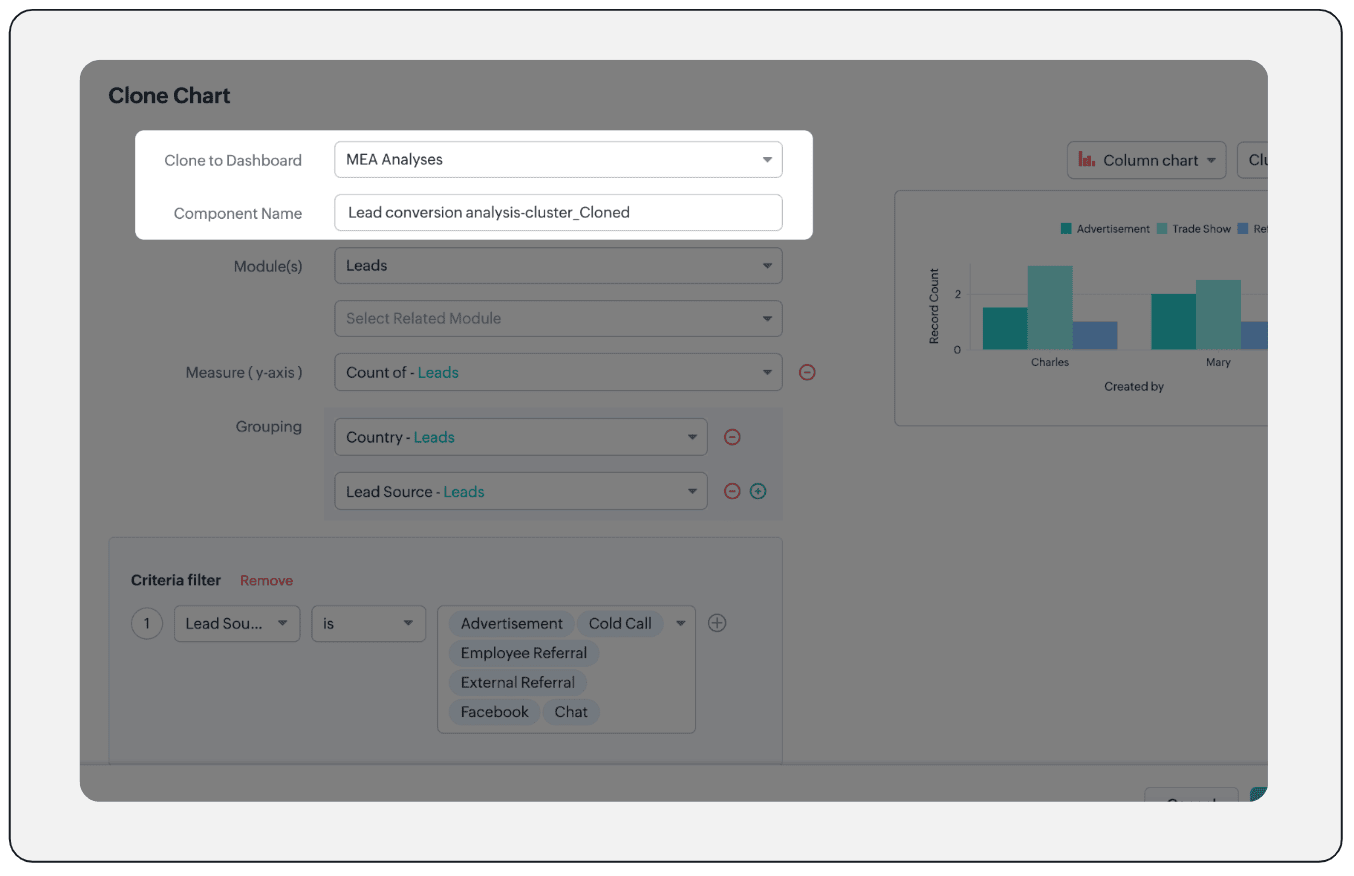
- Clone components to a different dashboard: Dashboards in Analytics serve in unique ways for various audiences—there can be separate dashboards for the sales team, marketing team, engineering team, and so on, and the chances of using the same measure for reference is common. Thus, when you clone a chart, you can now determine the target dashboard in which the cloned chart can be placed.
Resource: Help document
Thanks and have a good one!
Kind regards,
Saranya Balasubramanian
Saranya Balasubramanian
Topic Participants
Saranya Balasubramanian
Sticky Posts
Good news! Calendar in Zoho CRM gets a face lift
Dear Customers, We are delighted to unveil the revamped calendar UI in Zoho CRM. With a complete visual overhaul aligned with CRM for Everyone, the calendar now offers a more intuitive and flexible scheduling experience. What’s new? Distinguish activitiesNimble enhancements to WhatsApp for Business integration in Zoho CRM: Enjoy context and clarity in business messaging
Dear Customers, We hope you're well! WhatsApp for business is a renowned business messaging platform that takes your business closer to your customers; it gives your business the power of personalized outreach. Using the WhatsApp for Business integrationConsumers are talking about your business. Are you listening?👂
A loyal customer might be praising your product in a forum. A frustrated user could be posting a harsh review on a public site. An excited partner may have left a comment on your campaign. A domain expert might be deconstructing your product. A prospectEnhancements to the formula field in Zoho CRM: Auto-refresh formulas with the "Now" function, stop formula executions based on criteria, and include formulas within formulas
Dear Customers, We hope you're well! By their nature, modern businesses rely every day on computations, whether it's to calculate the price of a product, assess ROI, evaluate the lifetime value of a customer, or even determine the age of a record. WithElevate your CX delivery using CommandCenter 2.0: Simplified builder; seamless orchestration
Most businesses want to create memorable customer experiences—but they often find it hard to keep them smooth, especially as they grow. To achieve a state of flow across their processes, teams often stitch together a series of automations using Workflow
Recent Topics
Kanban View for Projects.
At our organization, we describe active projects with various statuses like "In Proofing" or "Printing" or "Mailing". In the Projects view, one can set these project statuses by selecting from the appropriate drop-down. While this works, it's difficult to view and comprehend the progress of all of your projects relative to each other in a table. Creating a Kanban view for projects where I can move them from one status to another allows me to see where each project is in the order of our workflow.How to Hide Article Links in SalesIQ Answer Bot Responses
I have published an article in SalesIQ, and the Answer Bot is fetching the data and responding correctly. However, it is also displaying the article link, which I don’t want. How can I remove the link so that only the message is shown?Add RECURRING option when adding email to calendar events
When you add an email to a calendar event, there is no option to make that new calendar event into a recurring event. It is counterproductive to make an event from your email to then have to go to your calendar, find the event, and make it recurring.LINE Auto Message Connect to Zoho
When I integrated LINE into the CRM, I was prompted to disable “Chat,” “Auto Response,” and “Greeting Messages,” and to enable the webhook. However, since I have already set up some auto-reply features in LINE, including Rich Messages and greeting automation,Option to block bookings from specific email address or ip adresss in zoho booking
Sometime few of our client keep booking irrelevant booking service just to resolve their queries and they keep booking it again and again whenever they have queries. Currently its disturbing our current communication process and hierarchy which we haveThreaded conversations for emails sent via automation
Hi Guys, I hope you are doing well. Don't you guys think we should have an option in a workflow to notify users either as a new email or the previous email thread. For example, if you have one deal in the process and there are 10 different stages duringCreate folder is fetch fails
coming from zapier... zapier has a google drive task that searches for a specific folder in google drive, and if it fails to find the folder it will create a folder based on the search criteria, and contine along the singluar path of the flow. TryingMeetups de Usuarios de Zoho - Noviembre 2025
¡Hola, Comunidad! Durante el mes de noviembre celebraremos los Meetups de usuarios de Zoho, encuentros presenciales pensados para quienes queráis mejorar vuestras estrategias de lead nurturing y aprender a sacar el máximo partido a herramientas como ZohoIntroducing 7 New Connectors in Zoho DataPrep!
We’ve just made data management even easier - Zoho DataPrep now supports 7 new external connectors to help you build more robust, scalable ETL pipelines. Why it matters: ✅ Broader data access ✅ More automation, less manual work ✅ Smarter pipelines, betterSales Order, Invoice and Payment numbers
Hi zoho friends, it is me again, the slow learner. I'm wondering if there is a way to have it so the Sales order, invoice and payment numbers are all the same? It would be easier for me if they were the same number so there is not so many reference numbersMissing information data Zoho inventory
there some missing data in Zoho inventory connection. pick list stock counts bin location we have requested it via mail and the support team doesn’t gove feedback. has anyone achieve to get these info or to ask other ya lesFirst day of trying FSM in the field.
What we found. 1. with out a network connection we were unable to start a service call? 2. if you go to an appointment and then want to add an asset it does not seem possible. 3. disappointed not to be able to actually take a payment from within the appZoho Desk app update: AI powered features
Hello everyone! We’ve introduced various AI-powered services on the Zoho Desk app. Let's take a look at what's new. Generate Content: Generate Content uses AI to formulate responses based on the your query and provides a ready-to-use reply which can beHow to Automate Email Sequence
I'm having trouble trying to set up a workflow to automate an email sequence. Once a group of emails in a Task has been tagged by a certain tag, I want an instant email template to be sent. After 7 days with no response, another email template would beTurning off the new UI
Tried the new 'enhanced' UI and actively dislike it. Anyone know how to revert back?Zoho Sprints Android v2.0.4 app update: Item reminders, archive Epics, Kanban projects, Epic progress
Hello everyone! In the latest version(v2.0.4) of the Zoho Sprints Android app update, we have introduced various new features. Let's take a look at what's new! Item Reminder Stay organized and never miss an important date with the all-new Item ReminderCredit Management: #3 Setting Credit Limit for Customers
Think about that one familiar customer of yours who always buys on credit. They usually pay on time, maybe a little late here and there, but not alarming. So, you are fine saying, "Sure, pay later." Then, one day, they place a significantly bigger orderAdding Reports to Portals
Is there a way to add Reports to portals so only the user can see report templates relevant to them?Update on the client portal URL for Guest users
We’re updating the way Guest users access their Connect network. As part of this change, all client organization portals used by Guest users will now be accessible through a dedicated domain specific to each data center. The access URLs mentioned herePreserve Ticket Issue Mapping When Migrating from Jira to Zoho Projects
Hello Zoho Projects Team, We hope you are doing well. We are currently exploring a full migration from Jira to Zoho Projects, and we identified a critical limitation during the migration process involving Zoho Desk integration. Current Situation: We useEnhancements to Zoho Map integration tasks
Hello everyone, We're excited to announce enhancements to the Zoho Map integration tasks in Deluge, which will boost its performance. This post will walk you through the upcoming changes, explain why we're making them, and detail the steps you need toUnable to see Zoho contacts in Zoho app on ios
Hi Support Team, I am a new user, I have created my account and installed zohomail app on iOS 16 which works. I was also able to import my Gmail contacts into Zoho Contacts, which I can see. The problem is that I can’t see these imported cobalts in ZohomailTask Due Date greater than 10 years.
We use recurring tasks in Projects where every week, month, year etc Some of our projects are greater than 10 years and we are unable to set a new due date because the difference between start date and due date is greater than 10 years. As an exampleExternal User onboarding for zoho connect is not really intuitive.
So the external user is sent an invite, which has a button that directs them to login to zoho to view the invite, but if they don't have a zoho account, they cannot access that invite, which seems kinda silly, as there is not real way on for them to createHosting external websites on Zoho?
How can I host my external website on zoho? Do we have that option? I am currently with hostinger and am looking to switch to zoho. Kindly help. Thanks.How to Add Time Formula Duration (hh:mm)
Hi everyone — I’m trying to create a formula field in Zoho CRM that calculates the difference between a “Call Start Time” and “Call End Time” and displays the duration in HH:MM format (for example: 1:04 for one hour and four minutes). My current setupHow can I calculate the physical stock available for sale?
Hey Zoho Team, I've tried to calculate the physical stock on hand in various ways - but always receive a mismatch between what's displayed in Zoho Inventory & analytics. Can you please let me know how the physical stock available for sale is calculated?Set Custom Icon for Custom Modules in new Zoho CRM UI
Live Webinar: Getting Started with Zoho WorkDrive - A Complete Overview
Hello everyone, We’re excited to invite you to our upcoming live webinar! Discover how to set up your team, bring in your data, and make the most of WorkDrive’s collaboration, organization, AI, and security capabilities. This session is perfect for anyoneMarketing Tip #4: Build your email list early
Email marketing has one of the highest returns on investment. Don’t wait until later; start collecting subscribers now. When you've got their attention, you can send them emails about offers, new product launches, seasonal greetings, and more. Try thisIs anyone else having trouble saving a custom image in their email signature, or is it just me?
When I try to save the image I get an error that says "Operation Failed" I opened a support ticket two weeks ago and received a response that it would be debugged, but it still isn’t workingUnify Overlapping Functionalities Across Zoho Products
Hi Zoho One Team, We would like to raise a concern about the current overlap of core functionalities across various Zoho applications. While Zoho offers a rich suite of tools, many applications include similar or identical features—such as shift management,Zoho Desk Domain mapping / Cloudflare CNAME not recognized
Hello, my website is behind Cloudflare and SSL. From the Cloudflare control panel I added a CNAME record such as support.mydomain.com pointing to desk.cs.zohohost.com but I'm stuck with the message "Make sure you've mapped the CNAME entry..."Create an Eye-Catching Announcement Widget for Your Help Center
Hello Everyone! In this week’s edition, let’s explore how to keep your customers updated with exciting news in the Help Center. See how ZylkerMobile wowed their customers by bringing updates right to their portal. ZylkerMobile, the renowned brand forI want to add my other zoho account in same pc
why does zoho restrict me doing many things as i also want to add my second mail account bit its not allowing me to do thatSearch in Zoho Community Not Working
I realize this is a bit of a meta topic, but the search for the various Zoho Communities appears to not be working. I'm under the impression that they run on some version of the Zoho Desk platform, so I'm posting this here.Capture Stripe’s Customer ID
Does anyone know of a way to capture Stripe’s customer ID that is created when the form/payment is processed? I would like to have the customer ID stored in our CRM so we could utilize in some custom functions down the road.Custom Modules - Where are Comments??
In the standard ticket module and in the tasks module, we have an interactive comment box that we can post important details/notes and can tag others if needed. Where is this functionality for Custom Modules? Ideally, custom modules would have very similar,Dynamic Signature - Record owner
Hi everyone, I’m using Zoho Writer merge templates from Zoho CRM and have two questions: Owner signature: How can I automatically insert the CRM record owner’s signature in the merged document? I’m not sure where this signature is stored or how to referencePUNJAB NATIONAL BANK (CORPORATE) INDIA - NOT AVAILABLE IN BANKING
Dear sir, Kindly fix it. PUNJAB NATIONAL BANK (INDIA) is available but PUNJAB NATIONAL BANK (CORPORATE) is not available. Kindly enable this banking since we need to categorize the entries. Regards, Sanjay Jena email id/ user id : travewithmerchant@Next Page