Visualize your data with a new set of charts: Treemap, Butterfly, Sankey, and Cluster charts in Zoho CRM
Dear customers,
When it comes to analytics, it's not just about the numbers; it's about understanding the story behind them.
With that philosophy in mind, we’re excited to introduce a line of representations to the existing array of chart types in Zoho CRM: Treemap, butterfly, sankey and cluster charts. Let's go!
Treemaps
Treemap charts are used to visually represent hierarchical datasets in a rectangular layout. It aligns its parent categories as larger tiles with their sub-categories nested within them. The size of each tile is proportional to its corresponding value, making it easy to compare different segments within the hierarchy.
This is how a treemap chart looks:

These structured data representations help you understand overall performance and contributions, as well as compare participating entities at a glance.
Unlike traditional bar charts or pie charts, treemaps can be used if your datasets are large and exhibit parent-child relationships.
Here are some examples to better understand their usage:
Comparing revenue distribution between functions
A company's revenue is distributed among its functions before it gets further disbursed to its employees. Treemap charts can be used to depict this distribution and compare it between functions. As you can see below, the hierarchy can be represented as a treemap to compare it directly with other functions:

The hierarchy at the top shows just the numbers and levels, but the treemap chart represents the numbers proportionally, allowing leaders to visualize the difference in distribution.
Interpretation: As you can easily see in the treemap, sales and marketing receive the same amount of revenue, while engineering is given significantly more than the other two.
Likewise, with treemap charts, you can:
- Compare popular lead sources with lead counts is the measure and lead source being the participating entity—a classic single-grouping configuration.
- View cost savings achieved across departments. With the departments as the grouping parameters and the cost saved as the measured amount, the chart lays out all the departments as tiles in proportion, based on money saved.
- Compare ad spends across channels, where channels are the parent grouping and ad spend is the measured unit.
Butterfly
Butterfly charts are used to compare two related datasets side-by-side, resulting in a representation that looks like a butterfly or tornado.
Now, how does it differ from bar charts?
The standard bar chart can compare two entities for a given measure. Say, you are comparing the performance of Mary and Charles. The two users' data is represented using bars, and the length will denote their performances. But, when it comes to comparing their performances over a period or their contribution across different stages, a bar chart is not sufficient.


With butterfly charts, you can:
- Compare revenue between two of your branches each month. With branches being compared for sum of sales revenue, grouped by closing date.
- Compare the performance of two reps in a given quarter. Compared between two users for average of amount of deals, grouped by closing date until today.
In addition to the user-based comparison above, butterfly charts are well-suited to visualizing other types of data comparisons, like:
- Picklist-based comparisons
- Duration-based comparisons
- Aggregate-based comparisons
Business scenario
Comparing the number of deals closed for each lead sources: Duration-based comparison
You can identify the productive lead source by comparing the number of deal closures for every lead source in your organization based on their closing week.

Analyzing effective sales methodology, inbound vs. outbound: Picklist-based comparison
Businesses use both inbound and outbound lead generation strategies, and each of these methods can reap different results based on the season and occasion. By comparing inbound versus outbound each month, you can identify which works best at what time.

Analyze the amount versus the expected revenue between accounts: Aggregate-based comparison
Expected revenue is a result of a deal's progression in the sales pipeline. Comparing the amount versus their expected revenue will not only help visualize the expected revenue of participating accounts but also indicate the accounts' stage in the sales pipeline.

Sankey
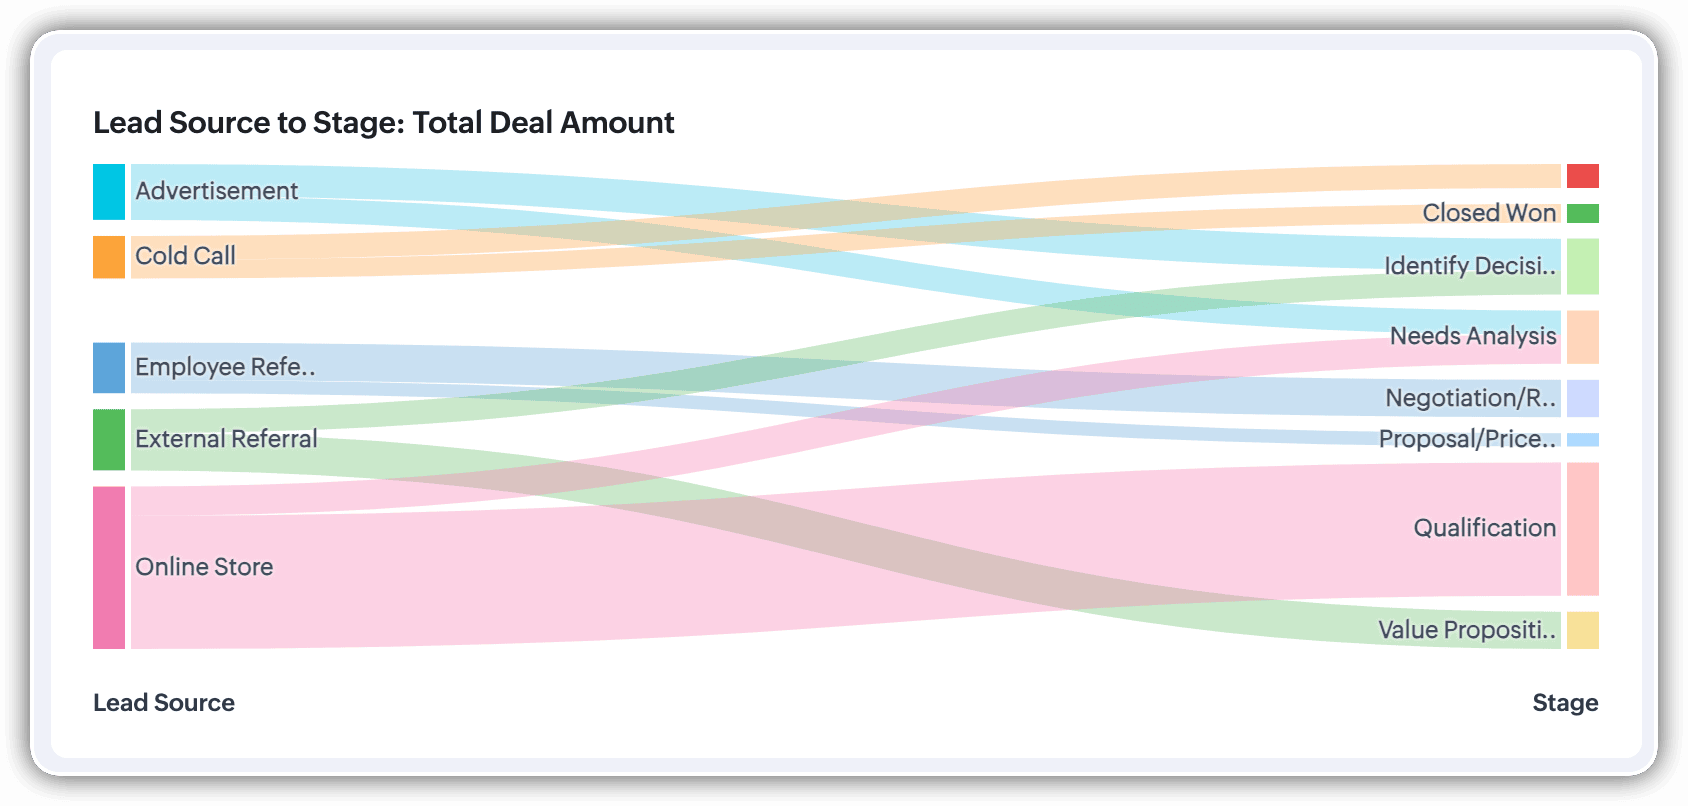
A Sankey Chart is designed to visualize the movement of data across different data groups. Unlike traditional charts—such as bar, column, pie, or donut—that mainly provide a static distribution of values, the Sankey Chart focuses on illustrating the flow between multiple segments or grouping fields. This makes it an ideal choice when you want to track how values (like lead counts, revenue, or deal statuses) move from one category to the next.

Key features
- Flow visualization: With the Sankey Chart, you can observe the movement of data between different groups.
- Multiple grouping fields: This chart works best when you have at least two grouping fields. You can go even further and add a third grouping to see an even more detailed mapping of your data flow.
- Simple configuration: The configuration for the Sankey Chart is as simple as any other chart type in Analytics.
Business scenarios:
Imagine you’re a sales manager trying to get a better handle on your team’s performance and your company’s pipeline. You want to understand not just how many deals are coming in, but also which sources are contributing the most value—and how those deals are progressing through different sales stages.
Let’s say you want to understand which lead sources are driving the most deal activity and how those deals progress through the pipeline. You can create a Sankey chart that maps the count of deals from Lead Source to Stage.

After analyzing the chart, you might notice that Online Store brings in a high volume of early-stage deals, while sources like External Referral contribute fewer deals that are more likely to reach advanced stages like Proposal or Negotiation.
This insight helps you prioritize nurturing the most profitable channels.
Sankey charts can also be helpful in other operational scenarios where understanding transitions across stages or teams is essential:
- Regional revenue distribution: Visualize how revenue flows across different regions, product categories, and their corresponding annual revenue. This helps you compare which regions contribute the most to each product line and where your high-value segments lie.
- Ticket handling flow: Visualize the flow of support tickets from their origin channel to internal departments and finally to resolution statuses. This can reveal workload imbalances or common points of delay in your support process.
Cluster
A cluster chart is similar to stacked column charts, but instead of stacking horizontally, the data is represented as vertical bars. As you create a column chart with multiple groupings, you can change the type of column chart to a cluster chart to achieve this representation.

In the above image, you can see the stacked column chart compares the number of lead conversions based on popular sources between countries. The stacks appearing on top of existing stacks ask you to calibrate the record count (y-axis) based on the previous stacks, which can lead to inaccurate interpretations. In this case, a cluster representation will paint a clearer picture of the analyses.
Other minor enhancements:
In addition to the three charts we mentioned above, we've also made the following minor changes:
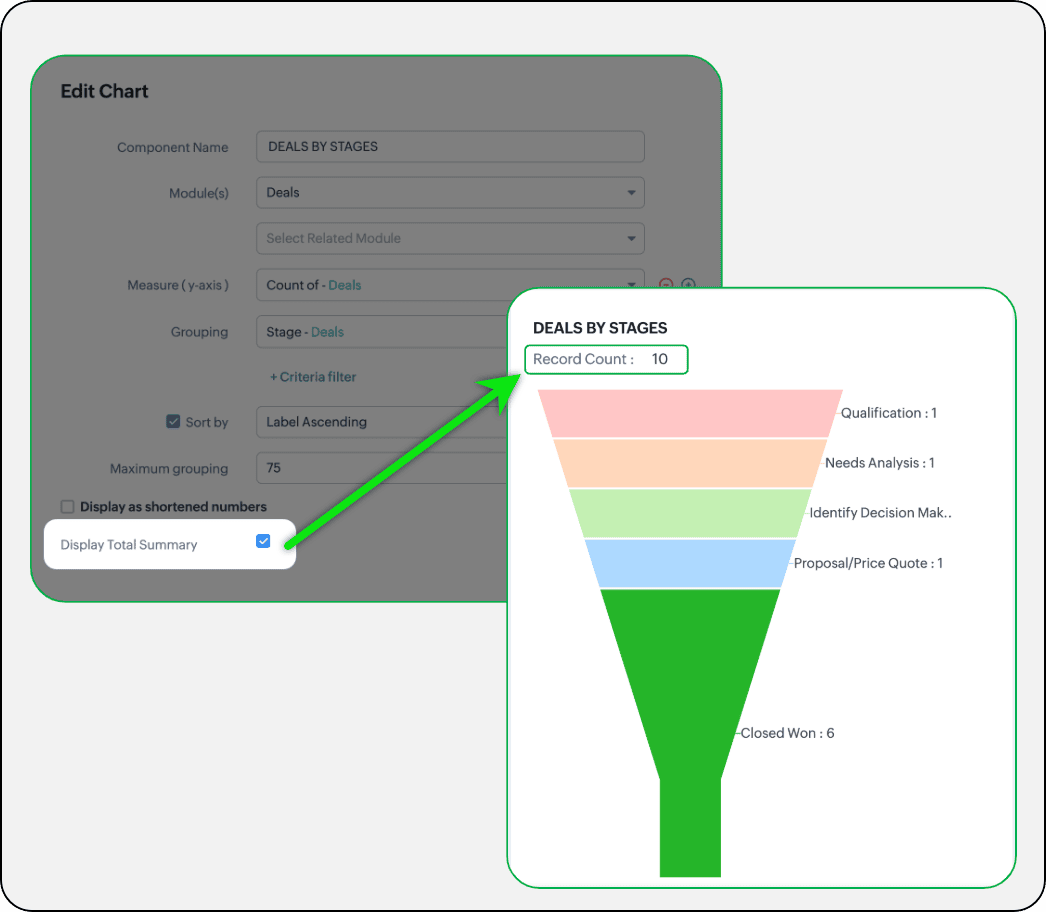
- Display total summary: Thus far, for all charts, each participating measure included labels. Now, to better understand overall contributions, a check box to display the total summary is provided under More options on the Chart Configuration page. Based on the configuration, the total revenue or the rolled-up quantities will be prominently displayed.
- Merge Y-axis: For charts that use two y-axis measurements, the intention is to view the progression of one entity against these two measures. Despite the scale, if the y-axis on the left is disproportionate to the values of the y-axis on the right, the plotted graph will result in a graphically and logically incorrect representation.
As you can see in the image below, the plot area of the sum of amount bar and the sum of expected revenue aligns close together, while, the difference between $700,000 and $40,500 is drastic, creating inaccurate interpretations.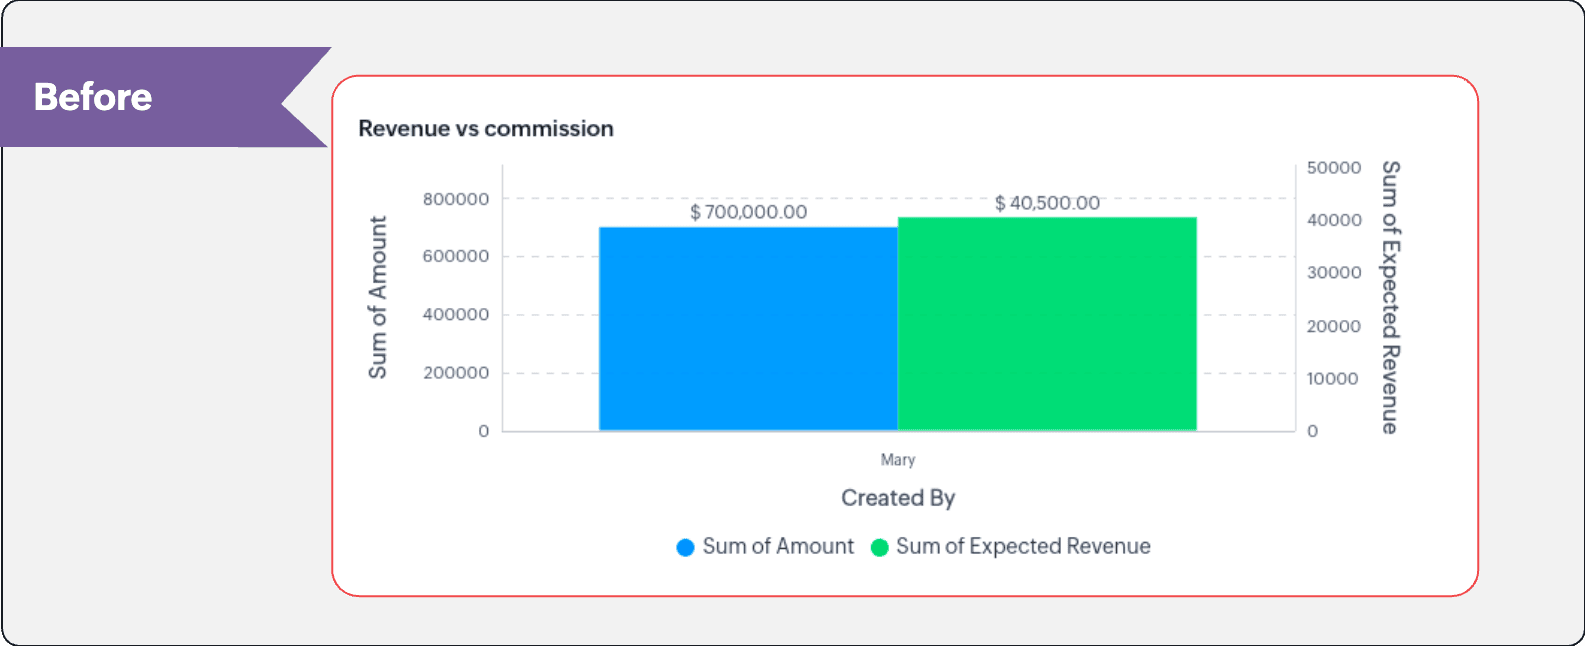
In this enhancement, we're allowing neighboring values of measures to merge so that the interpretation can be more visually accurate.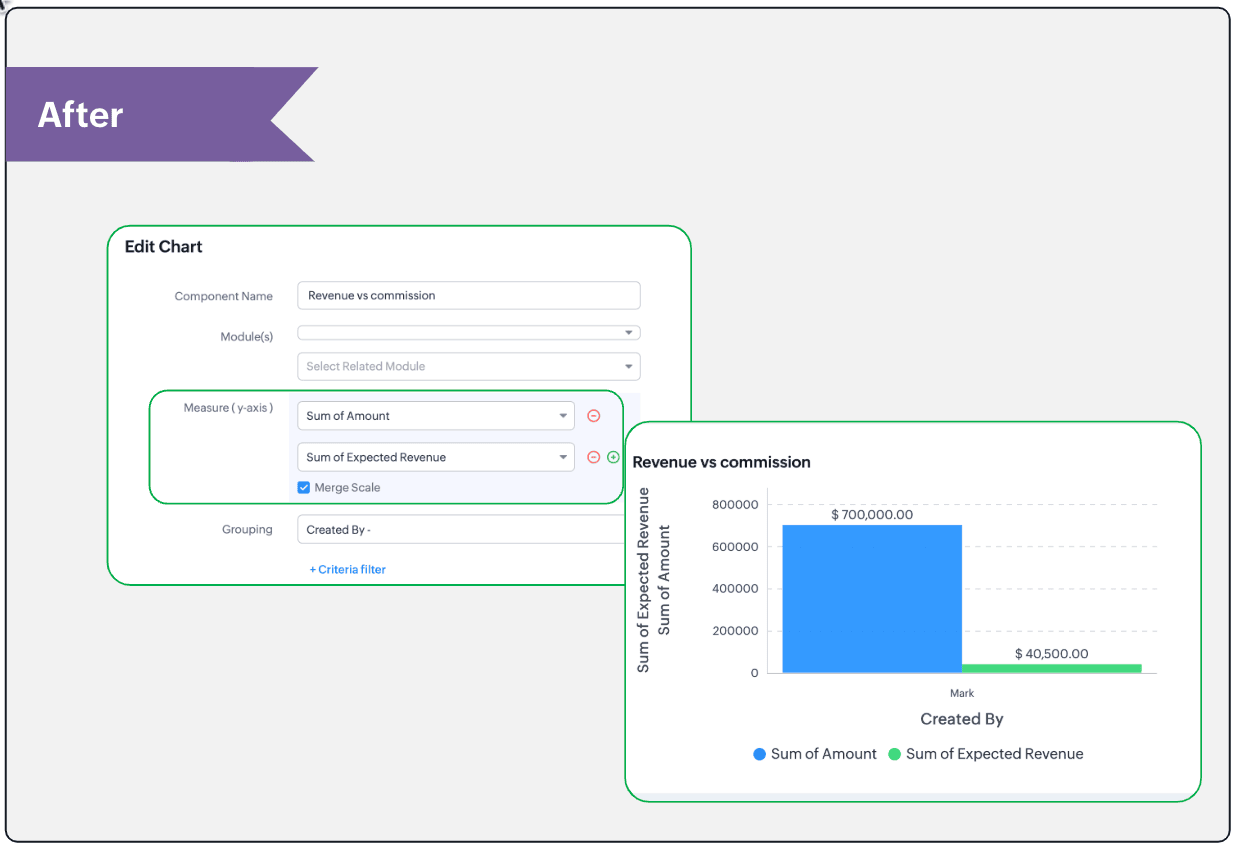
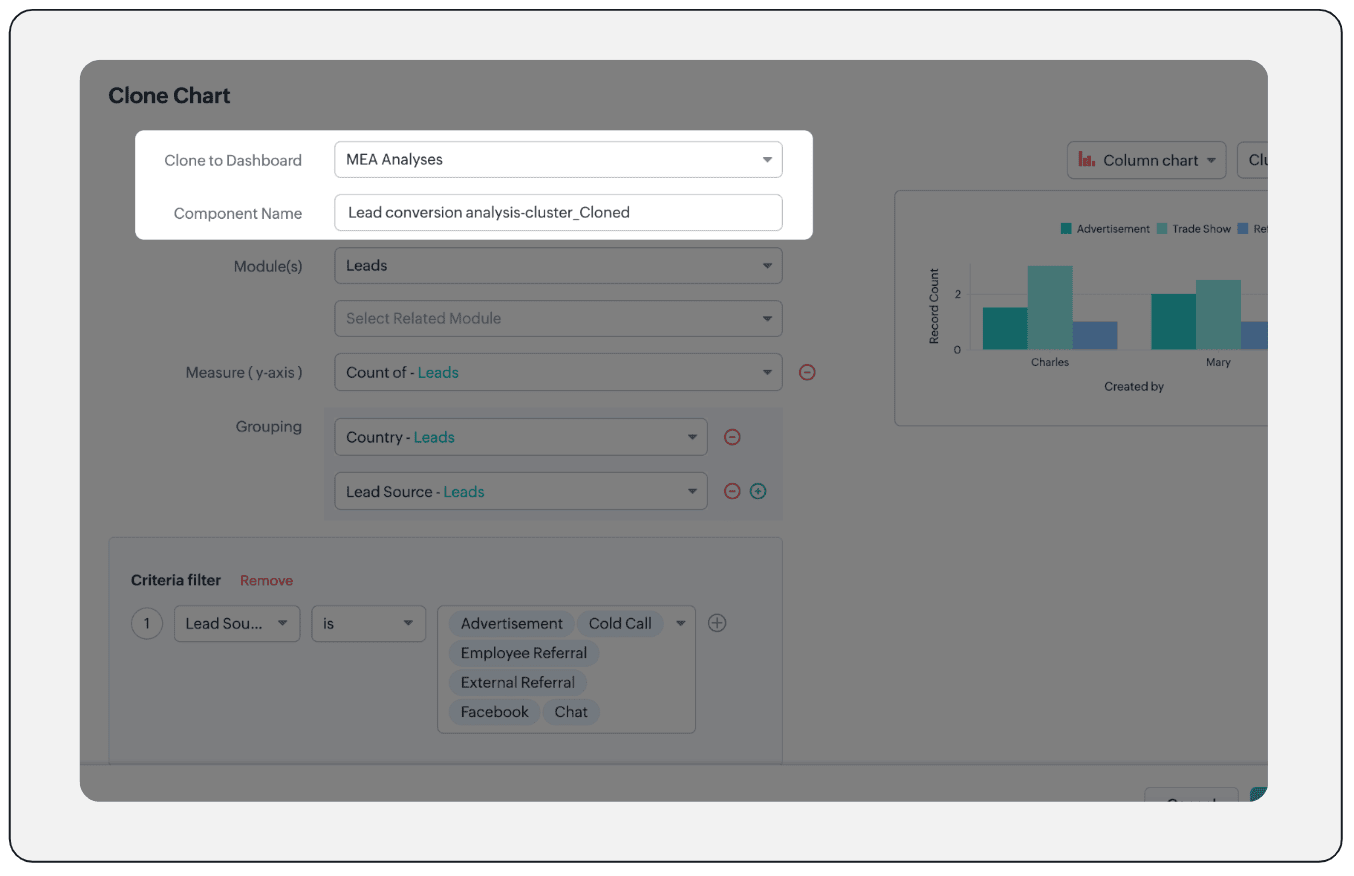
- Clone components to a different dashboard: Dashboards in Analytics serve in unique ways for various audiences—there can be separate dashboards for the sales team, marketing team, engineering team, and so on, and the chances of using the same measure for reference is common. Thus, when you clone a chart, you can now determine the target dashboard in which the cloned chart can be placed.
Resource: Help document
Thanks and have a good one!
Kind regards,
Saranya Balasubramanian
Saranya Balasubramanian
Topic Participants
Saranya Balasubramanian
Sticky Posts
Nimble enhancements to WhatsApp for Business integration in Zoho CRM: Enjoy context and clarity in business messaging
Dear Customers, We hope you're well! WhatsApp for business is a renowned business messaging platform that takes your business closer to your customers; it gives your business the power of personalized outreach. Using the WhatsApp for Business integrationGood news! Calendar in Zoho CRM gets a face lift
Dear Customers, We are delighted to unveil the revamped calendar UI in Zoho CRM. With a complete visual overhaul aligned with CRM for Everyone, the calendar now offers a more intuitive and flexible scheduling experience. What’s new? Distinguish activitiesConsumers are talking about your business. Are you listening?👂
A loyal customer might be praising your product in a forum. A frustrated user could be posting a harsh review on a public site. An excited partner may have left a comment on your campaign. A domain expert might be deconstructing your product. A prospectEnhancements to the formula field in Zoho CRM: Auto-refresh formulas with the "Now" function, stop formula executions based on criteria, and include formulas within formulas
Dear Customers, We hope you're well! By their nature, modern businesses rely every day on computations, whether it's to calculate the price of a product, assess ROI, evaluate the lifetime value of a customer, or even determine the age of a record. WithElevate your CX delivery using CommandCenter 2.0: Simplified builder; seamless orchestration
Most businesses want to create memorable customer experiences—but they often find it hard to keep them smooth, especially as they grow. To achieve a state of flow across their processes, teams often stitch together a series of automations using Workflow
Recent Topics
KPI Widget dashboard select periods
I have a problem with selecting periods as a user filter. In the beste scenario I would like to have to have a period filter like Google Analytics has of Datastudio (see attachment). In the KPI widget I "Group by "inquiry_date" on week&Year". It selectsNeed a way to secure Prefill URLs in Zoho Forms (hide or encrypt prefilled values)
Hi everyone, I often use Zoho Forms with prefilled URLs to simplify the user experience — for example: https://forms.zohopublic.com/.../form?Name=David&Amount=300 However, the problem is that all prefilled values are visible and editable in the link.Can’t send emails from Zoho CRM after adding a new user — verification codes not received
Hi everyone, We recently added a new user to our Zoho CRM account and purchased an additional license. Since then, we haven’t been able to send any emails from Zoho CRM. Our Zoho Mail accounts are working perfectly, we can send and receive emails directlyCan I add Conditional merge tags on my Templates?
Hi I was wondering if I can use Conditional Mail Merge tags inside my Email templates/Quotes etc within the CRM? In spanish and in our business we use gender and academic degree salutations , ie: Dr., Dra., Sr., Srta., so the beginning of an email / letterCRM for email in Outlook: how to ignore addresses?
We’re using the "Zoho CRM for email" add-in for Outlook. When opening an email, the add-in displays all email addresses from the message and allows me to add them to the CRM or shows if they’re already contacts. However, sometimes people listed in ToScheduling Calls in CommandCenter / Blueprints
I would love it if you could add a function to schedule a call in the lead's record for a future date. I know you can add a Task by going to Instant Actions > Task and completing the form: These tasks go into the lead's record under Open Actions. ButWorkflow Creation with Zia gets stuck
It gets stuck here:Quickly send emails and sync conversations with custom email addresses in CRM
Editions: All editions DCs: All DCs Release plan: This enhancement has been released for customers in all DCs except IN and US. We will be enabling it for IN and US DC customers soon. [Update on 22 May 2024] This enhancement has been released for allZoho製品と生成AIツールの活用について
いつもありがとうございます。 弊社では、Zoho Oneを契約し、CRMを軸として、見込み客の管理から商談、その後の受注や請求の管理、サポート業務(Desk)、業務データのレポーティング(Analytics)などを行っております。 Zohoサービス自体には、Ziaというツールが搭載されているかと存じますが、それ以外の外部の生成AIツールと連携した活用などもできるのでしょうか?具体的には、CopilotなどがZohoに登録されているデータや情報を見て、対話型で必要なデータを提示してくれたり、商談や蓄積されたメモなどを分析してユーザが知見を得られるような活用ができないか、と考えております。File Field Validation
Hello all, We are tracking our customer NDA agreements in our CRM and have created 2 fields to do so, an execution date field and a file upload field. I want to create a validation rule to ensure that when the execution date field is populated that theWork with Contacts who use multiple Emails / Manage obsolete Email addresses without loosing Emails in Context
Hello List Work with Contacts who use multiple Emails Only after 1 week in using Zoho CRM productively we have contacts which randomly use 2 different email addresses. From the concept I've understood that Zoho CRM offers two email fields which are recognizedNew Field in CRM Product Module Not Visible in Zoho Creator for Mapping
I created a new single-line field in the Products module in Zoho CRM. Zoho CRM and Zoho Creator are integrated, but the newly created field in CRM is not visible in Zoho Creator when I try to map fields.Send WhatsApp voice messages from Bigin
Greetings, I hope all of you are doing well. We're happy to announce this enhancement we've made to Bigin. Bigin's WhatsApp integration now supports audio messages, so you can record and send voice messages. This makes it easier to handle customer questionsMicrosoft Teams now available as an online meeting provider
Hello everyone, We're pleased to announce that Zoho CRM now supports Microsoft Teams as an online meeting provider—alongside the other providers already available. Admins can enable Microsoft Teams directly from the Preferences tab under the MeetingsI want to subscribe 1 professional user but the email only 250 per day?
When I subscribe 1 professional user, I am only able to send 250 email per day? So less? Or is it typo, 2500 rather than 250? Any sale agent or friends can clear my doubt? Thank YouHow to add a % Growth column for year-over-year comparison (2024 vs 2025)
Hello, I am trying to build a monthly revenue comparison between 2024 and 2025 in Zoho CRM Analytics. My current setup is: Module: Deals (Affaires) Filter: Stage = Closed Won Date field: Closing Date Grouping: By Month Metrics: Sum of Amount for 2024,How do you map a user picklist field to another user picklist field.
In Zoho Projects, I'm trying to map a custom field (user picklist) in Task Details to a field (user picklist) in the Project Details. How do you get the two to map to each other? This is what I currently have that works for my other fields but doesn'tExplore Competitive 3D Scanner Prices at Protomont Technologies
The genesis of Protomont Technologies emerged from the collaborative efforts of the founders in 2019, both the founders shoulder an enormous experience in the world of 3D Printing. Protomont Technology aims to craft your vision with creativity, empoweringNew and improved API resources for Zoho Sign Developers
Hello, Developers community! We know that for you, an API's real value depends on how quickly, easily, and reliably you can integrate the it with your application. That's why we're excited to talk about the recent improvements to our developer resources,stock
bom/bse : stock details or price =STOCK(C14;"price") not showing issue is #N/A! kindly resolve this problemProject Approval Process Workflow
Issue: When a new Project is created, there is lack of process/workflow that provides their manager a process to approve or review. Suggestion/Idea: Similar to “Workflow”, we need “Workflow” ability at Project level, where based on the criteria of theMarketing Tip #5: Improve store speed with optimized images
Slow-loading websites can turn visitors away. One of the biggest culprits? Large, uncompressed images. By optimizing your images, your store loads faster and creates a smoother shopping experience leading to higher sales. It also indirectly improves SEO.Why can I not choose Unearned Revenue as an account on items?
Hello, I do not understand why we don't have the ability to code an item to unearned revenue. It is not an uncommon situation to have in business. I understand that there is the Retainer invoice as an option, however that doesn't really work for us. OurForm Submission Emails
Is there a current delay with submission emails being sent? We've had 10-20 forms completed today but only a handful of emails.Rules not working properly
I created a rule to display certain fields on certain states. But it seems to be not working. It hides the fields even when I selected California, (which is a state that should show the fields when selected)Notebook font size issue
If I copy something from somewhere and paste it in my notebook, the font size becomes smaller.Sign in process is beyond stupid. I'd rather plug my phone into USB and copy files than sign in to this POS.
792 clicks and fields to fill in just to get into a 3rd rate app is too stupid for me.Ampersand in URL parameter // EncodeURL does not work
Hi Zoho, I have a url link with a parameter. The parameter is including ampersand in some cases (Can be "H&M" or "P&I") When trying to use %26 instead of "&" (the result I get using EncodeURL()) I get H%26M instead of H&M in the parameter field. How can I solve this? Thanks! Ravidhow can we create in zoho crm a new contact when the looup does not find a similar existing one
In forms/integrations/zoho crm / ne w record tab, contact name is to be mapped with my form contact name. When I go in biew edit/lookup configuration, I don t get the options (help dedicated page simply repeat the same info you get in the app) and doesDirectory Websites
Directories are a good website category to gain search engine traffic. Directories for a professional service category as an example can help their members in search results over their individual website. It would be nice to have a directory templateManage Task on Mobile
How do we manage our task on mobile devices? It seems that there should be a standalone mobile app to handle the new task features. The new features released in regards to Task management are great by the way! Now we need to bring that all together inSet Default Payment Method & Default account
Hi, I would like to know how to set the default payment method and default bank account when recording payments in zoho books. At present we have to change these fields everytime we record a payment, which leads to potential error and as we have a veryCustomer Portal on Zoho Desk
Hi, I'd like to know more about the items below I found when setting up the Customer Portal on Zoho Desk. Could someone help me explaining these in details? Especially the 2nd and 3rd point. Thanking you in advance! Permissions Customers can sign up for Customer Portal Customers can view tickets of their organization (contacts) Customers must register to access Customer Portal Display Community in Customer Self Service portalSlow Performance on desk.zoho.com. 11/3/2025
I’m not seeing any active service alerts for desk.zoho.com, but everyone on our account is currently experiencing very slow load times when opening or navigating tickets. We’ve already tried the standard troubleshooting steps — clearing cache and cookies,Computer Showing Offline in Unattended Access
I have a computer that was connected to the internet but showing offline in Assist. I tried uninstalling the program and deleting it from Zoho Assist the reinstalling and it still does not show up. I have been a user for several months and am not pleased with the lack of connectivity with Assist. If this continues I will have to find another product. The computer I reinstalled it on is not even showing up in Assist now. The name is NYRVLI-PC. ThanksClosing Accounting Periods - Invoice/Posting dates
Hi, I have seen in another thread but I'm unsure on how the 'transaction locking' works with regards to new and old transactions. When producing monthly accounts if I close December 24 accounts on 8th Jan 25 will transaction locking prevent me from postingZoho CRM Portal Error
Hi, We’re experiencing an issue with the Zoho CRM Portal. When we try to access it, we receive an HTTPS connection error: net::ERR_CERT_COMMON_NAME_INVALID. If we proceed past that, we then get a 400 Bad Request error. Could you please help us resolveCan we do Image swatches for color variants?
We want to do something like the attached screenshot on our new zoho store. We need image swatches instead of normal text selection. We want to user to select an image as color option. Is this doable? I don't see any option on zoho backend. Please hIntegrating Zoho CRM EmbeddedApp SDK with Next.js — Initialization and Data Fetching Issues
You can get an idea from my code I have given in end: First, I worked on a React project and tried the same thing — it worked. My goal was to import the Zoho script and then load contacts using the Zoho Widget SDK, which was successful in React. Now,Feature enhancement: Highlight rows based on a cell value
Hello Sheet users, We're excited to announce a new feature enhacement, shaped directly by your valuable feedback! As you might know, conditional formatting is a great tool for anyone dealing with large data sets. Previously, if you’ve ever wanted to drawNext Page