Zoho Analytics - Values gets Duplicated
In Zoho Analytics, I have two tables: one for Country-wise Sales and another for Country-wise Budget with Region. I am attempting to create a stacked bar chart to compare the Region-wise Budget and Sales Revenue.
I have set up a lookup between the two tables, and the chart initially displays the correct values. However, when I apply any filter, the values duplicate, and the revenue figures are wrong.
For example, in my Revenue table, I have Region-wise revenue, and another table includes Country, Region, and Salesperson information. If the revenue for Asia is 100, and the countries involved are India, Japan, and China, the system sums the revenue for all three countries, resulting in 300, which is incorrect.
Can you help me resolve this issue?
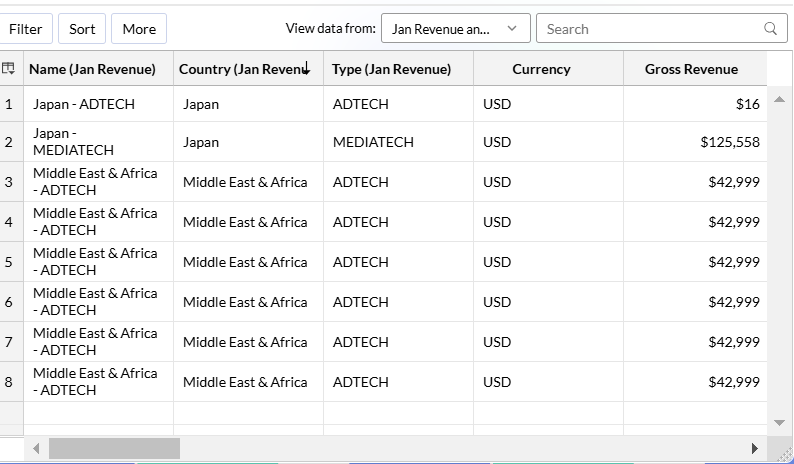
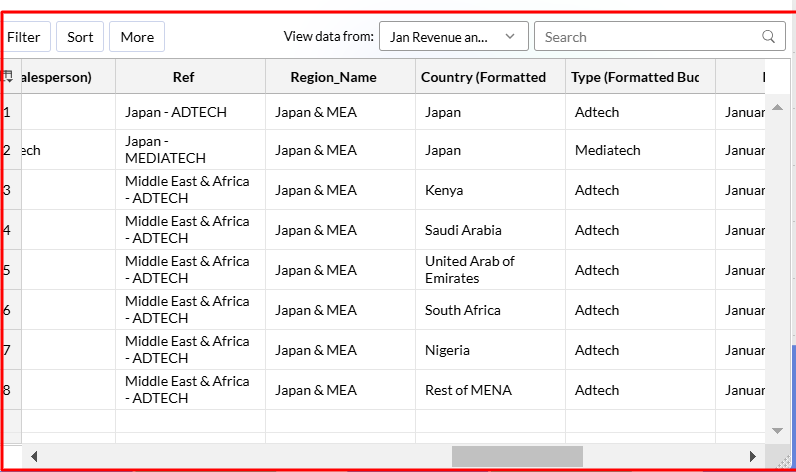
Attaching the Screenshot for your references.
This is the underlying data for the chart I created. As you can see, the Middle East & Africa region gets duplicated due to the countries listed in the lookup value column.
In this screenshot, we can observe that the total values are duplicated because of the countries, leading to a higher value.
Topic Participants
Bhuvaneshwaran
Anitha Rajesh Kumar
Sticky Posts
What's New in Zoho Analytics - November 2025
We're thrilled to announce a significant update focused on expanding your data connectivity, enhancing visualization capabilities, and delivering a more powerful, intuitive, and performant analytics experience. Here’s a look at what’s new. Explore What'sWhat's New in Zoho Analytics - October 2025
Hello Users! We're are back with a fresh set of updates and enhancements to make data analysis faster and more insightful. Take a quick look at what’s new and see how these updates can power up your reports and dashboards. Explore What's New! ExtremeWhat’s New in Zoho Analytics – September 2025
Hello Users!! In this month’s update, we’re raising the bar across multiple touchpoints, from how you bring in data, plan and track projects to how you design and brand your dashboards. We’ve added the all-new Gantt chart for project visualization, expandedAnnouncing Agentic AI - Ask Zia!
We are delighted to roll out the new agentic AI capabilities in Ask Zia, where every stage of the BI workflow is assisted by AI. With a human-in-the-loop approach, Ask Zia ensures that you’re in command of the decision, while AI handles the complexity.Invitation-Based User Access in Zoho Analytics
Hello everyone, We’re rolling out an important update on how users are added to your Zoho Analytics Organization and Workspaces. Previously, when admins added users, they were automatically added to the organization. Moving forward, to improve security
Recent Topics
Daytime saving timezones messing up writer pdf
Hi, I need help for something I can't figure out. I created a Form to collect data and it is set up with my current Daylight Saving Time (GMT-3). This form is used to generate a contract (pdf Writer) with dates from an event that is being held in 4 monthsIssue with locked content in Writer
Hi, I have seen the documentation which outlines how to lock specific content within a Writer document so that it can't be modified by collaborators, but I have come across an issue. When the editor locks a paragraph for example, then a collaborator can'tDeprecation of certain URL patterns for published Zoho Writer documents
Hi Zoho Writer users! We'd like to let you know that we have deprecated certain URL patterns for published and embedded documents in Zoho Writer due to security reasons. If the published or embedded documents are in any of these URL patterns, then theirUsing Mail Merge Template to Print Documents with One Subform Record's Fields per Document
Hello, We have a Mail Merge template created in Zoho Writer which is not able to perform the functionality which is currently required to automate the documentation task portion of our process. The CRM module we are primarily using is based on a "Loans"Problem with Writer and Workdrive
Hi team, I’m the super admin for our Zoho One org. WorkDrive is active, and Zoho Docs is deprecated for our org. However, Zoho Writer cannot connect to WorkDrive at all — we’ve cleared cache, tried incognito, and restarted several times. I was able toSet to Review for all
We are testing the use of Writer as part of an internal review process for statement of work documents and have found that when the document is changed from Compose to Review by one person, that is not reflected for all others who view the document. IsI’ve noticed that Zoho Sheet currently doesn’t have a feature similar to the QUERY formula in Google Sheets or Power Query in Microsoft Excel.
These tools are extremely helpful for: Filtering and extracting data using simple SQL-like queries Combining or transforming data from multiple sheets or tables Creating dynamic reports without using complex formulas Having a Query-like function in Zohostock
bom/bse : stock details or price =STOCK(C14;"price") not showing issue is #N/A! kindly resolve this problemSOME FEATURES ARE NOT IN THE ZOHO SHEET IN COMPARISION TO ZOHO SHEET
TO ZOHO sir/maam with due to respect i want to say that i am using ZOHO tool which is spreadsheet i want to say that some features are not there in zoho sheet as comparison to MS EXCEL like advance filter and other Features which should be there in ZOHOZoho sheet for desktop
Hi is zoho sheets available for desktop version for windowsTip #18: 6 Trendlines and when to use them in your spreadsheet data?
Charts are a great tool for visualizing and interpreting large chunks of data in spreadsheets. Zoho Sheet offers you 35+ chart options, along with AI-powered chart recommendations based on the data set you select. There are various chart elements thatPerform customized calculations with the new LAMBDA functions!
We released the LAMBDA function in Zoho Sheet in 2021, enabling customized calculations inside predefined functions. Now, we're extending LAMBDA's capabilities with six new functions. Each of these functions applies LAMBDA to the given input, performsTip #17: Easily share spreadsheets with non-Zoho account users
With efficient, collaboration-friendly options, Zoho Sheet is a popular choice among users. Sheet's external share links help you collaborate more effectively by sharing your spreadsheets with anyone outside your organization, including users who do notWork seamlessly with Sheet's shortcuts without affecting the browser
Navigating your worksheets and performing specific actions should be a quick and easy process. That's where keyboard shortcuts come in. Shortcut keys help you accomplish tasks more efficiently, eliminating the need to move away from the keyboard. WhatZoho Sheet for iPad: Improved UI, external keyboard support, and more!
The portability and capabilities of the iPad have made it an essential device in the business world. With this in mind, we had launched an exclusive Zoho Sheet app for iPad, with device-specific improvements and enhanced usability. Now, we're improvingThe new Zoho Sheet for Android: Seamless UI and advanced features
At Zoho Sheet, we know mobile apps have become the go-to platforms for creating, sharing, and storing information. And we understand the importance of an efficient and seamless app experience. We've been working hard on improving the overall user experienceZia in Zoho Sheet now makes suggestions on conditional formats, picklists, and checkboxes
Zia, Zoho's popular AI assistant, has been helping users succeed across Zoho applications since inception. In Zoho Sheet, Zia helps users efficiently build reports and analyze data with recommendations about data cleaning, charts, and pivot table. Also,VBA attached to button no longer works on external shared sheet
Hi - we have a Sheet that our clients use, which requires them to press a button once they've entered data. The button then triggers a flow via a webhook. The button works fine when editing within Zoho Sheet - however when shared externally it no longercan I use zoho sheet for survey?
Hi I wanna use zoho sheet for my ARY to know consumer better so i wanna have permission to do soHow to Avoid Impacting Other Users When Hiding Columns in Zoho Sheet
Hi Team, We’re experiencing a challenge with the column-hiding feature on Zoho Sheet during collaborative sessions. When one user hides a column, it becomes hidden for all users working on the file, which disrupts others' workflows. In comparison, ExcelWhat are the benefits of procurement software in a growing business setup?
I’ve been exploring tools that can help automate purchasing and vendor-related tasks. I keep hearing about the benefits of procurement software, especially for businesses that are scaling. I want to understand how it helps in streamlining operations,What formula to use in computing total hrs and decimal hrss
So , my data includes log im column , 2 breaks with 2 columns that says back and lunch and 1 column that says back and logged out. What formula should i use to be able to automatically have my total hours as I input time in each column? ThankyouReplacing email ID,
In zoho sheets If I am sending it as an email attachments can I replace sender email ID from notifications to my email ID.Latest Enhancements and Bug Fixes in Zoho Meeting
Hello there, We hope you're doing well. The latest updates from Zoho Meeting include enhancements like adding names for instant meetings, renaming participants, enabling text notifications for participant entry/exit, viewing details of bandwidth optimization,Multi-video feed in webinars, custom domain options, and our integration with MS Outlook
Hi there, We hope you're doing well. With your help, we have been able to release many useful features and enhancements in 2020. We, the Zoho Meeting team, would like to thank you all for the feedback, support, and encouragement you've given as we workedAdd co-hosts in meetings, manage webinar registration and other enhancements
Hello all, This month's updates allow you to add co-hosts while scheduling meetings. You can also control your webinar registrations better by allowing or blocking registrations from the domain or country of your choice. Read on to learn more. MeetingA new UI for distraction-free engagement in online meetings and webinars that scale up for 3000 attendees
Hello all, We're excited to share our new, refined UI for online meetings. Here's how the new UI will improve your experience during online meetings: We've re-designed Zoho Meeting's online meeting UI to enable users to fully engage in conversationsI Can't Clone Webinar that I Co-Organize
How do i get our account admin to give me permission to clone our webinars? I am a co-organizerLatest updates in Zoho Meeting | Calendar view, Zia integration with OpenAI, edit the recurring pattern in a recurring meeting, device error notifications revamp, and more.
Hello everyone, We’re glad to share a few updates and enhancements in Zoho Meeting, including the Calendar view, being able to edit the recurring pattern in a recurring meeting, revamped device error notifications, and other enhancements that you’ll findNew enhancements in the latest version of the Zoho Meeting Android mobile app.
Hello all, In the latest version of Zoho meeting Android mobile app (v2.2.6), we have brought in support for the below enhancements. Close account: Now users will be able to close their Zoho account directly from the app. Unmute toast message: If a userShare material, Lock Meeting and revamped feedback UI in the latest version of the Meeting iOS app.
Hello all, In the latest version of the Zoho Meeting iOS mobile app (v1.6), we have brought in the below enhancements. Share material in meeting: We have introduced share material during meeting that allows participants to view supported materials suchLatest updates in Zoho Meeting | New chat feature between an organizer and co-organizer in webinars, recording consent for webinar co-organizers and attendees in the Android app, and more.
Hello everyone, We’re excited to share a few updates for Zoho Meeting. Here's what we've been working on lately: A new chat feature between an organizer and co-organizer in webinars, recording consent for webinar co-organizers and attendees in the AndroidLatest updates in Zoho Meeting | A new Files tab to manage all your PDFs, PPTs, Video files and recordings, live transcription , ability to lock settings and adaptive echo cancellation.
Hello everyone, We’re excited to share a few updates for Zoho Meeting. Here's what we've been working on lately: A new Files tab to manage all your PDFs, PPTs, Video files and recordings, live transcription during sessions, ability to lock settings andLatest updates in Zoho Meeting | Meeting Rooms , Pin video feeds and customize from and reply-to email addresses
Hello everyone, We’re excited to share a few updates for Zoho Meeting. Here's what we've been working on lately: Introducing Zoho Meeting Rooms, an immersive solution for teams to connect over virtual meetings in video conference rooms. You can also pinLatest updates in Zoho Meeting | New top bar video layout, a revamp of our in-session settings and now import webinar registrations with a CSV file
Hello everyone, We’re excited to share a few updates for Zoho Meeting. Here's are some of them : We have moved audio, video, virtual background and preferences under a single settings pop-up for better user navigation. You can now upload a CSV file containingImportant update: Changes in email sender policies
Hello, This is to announce important changes to email sender policies from Google that may impact your use of Zoho Meeting. Restriction on public domains Effective February 1, 2024, Google is implementing policies that will affect the configuration ofCamera access
My picture doesn't appear in a group discussion. (The audio is fine.) The guide says "Click the lock icon on address bar," but I can't find it. Advise, pleaseChat for webinar session, schedule meeting session for 24 hours - Zoho Meeting iOS app update
Hello, everyone! In the most recent iOS version of the Zoho Meeting app, we have introduced the chat functionality for the webinar session. To access this feature, the Organizer should have the 'Public chat' option enabled on the Zoho Meeting desktopInvoice Copy 2005116990189
Please provide the invoice for the trancaction 2005116990189Darshan Hiranandani About
Hi, I’m Darshan Hiranandani, a dedicated software developer with a strong passion for creating efficient and user-friendly applications. With a degree in Computer Science and several years of experience in the tech industry, I specialize in full-stackNext Page