Visualize your data with a new set of charts: Treemap, Butterfly, Sankey, and Cluster charts in Zoho CRM
Dear customers,
When it comes to analytics, it's not just about the numbers; it's about understanding the story behind them.
With that philosophy in mind, we’re excited to introduce a line of representations to the existing array of chart types in Zoho CRM: Treemap, butterfly, sankey and cluster charts. Let's go!
Treemaps
Treemap charts are used to visually represent hierarchical datasets in a rectangular layout. It aligns its parent categories as larger tiles with their sub-categories nested within them. The size of each tile is proportional to its corresponding value, making it easy to compare different segments within the hierarchy.
This is how a treemap chart looks:

These structured data representations help you understand overall performance and contributions, as well as compare participating entities at a glance.
Unlike traditional bar charts or pie charts, treemaps can be used if your datasets are large and exhibit parent-child relationships.
Here are some examples to better understand their usage:
Comparing revenue distribution between functions
A company's revenue is distributed among its functions before it gets further disbursed to its employees. Treemap charts can be used to depict this distribution and compare it between functions. As you can see below, the hierarchy can be represented as a treemap to compare it directly with other functions:

The hierarchy at the top shows just the numbers and levels, but the treemap chart represents the numbers proportionally, allowing leaders to visualize the difference in distribution.
Interpretation: As you can easily see in the treemap, sales and marketing receive the same amount of revenue, while engineering is given significantly more than the other two.
Likewise, with treemap charts, you can:
- Compare popular lead sources with lead counts is the measure and lead source being the participating entity—a classic single-grouping configuration.
- View cost savings achieved across departments. With the departments as the grouping parameters and the cost saved as the measured amount, the chart lays out all the departments as tiles in proportion, based on money saved.
- Compare ad spends across channels, where channels are the parent grouping and ad spend is the measured unit.
Butterfly
Butterfly charts are used to compare two related datasets side-by-side, resulting in a representation that looks like a butterfly or tornado.
Now, how does it differ from bar charts?
The standard bar chart can compare two entities for a given measure. Say, you are comparing the performance of Mary and Charles. The two users' data is represented using bars, and the length will denote their performances. But, when it comes to comparing their performances over a period or their contribution across different stages, a bar chart is not sufficient.


With butterfly charts, you can:
- Compare revenue between two of your branches each month. With branches being compared for sum of sales revenue, grouped by closing date.
- Compare the performance of two reps in a given quarter. Compared between two users for average of amount of deals, grouped by closing date until today.
In addition to the user-based comparison above, butterfly charts are well-suited to visualizing other types of data comparisons, like:
- Picklist-based comparisons
- Duration-based comparisons
- Aggregate-based comparisons
Business scenario
Comparing the number of deals closed for each lead sources: Duration-based comparison
You can identify the productive lead source by comparing the number of deal closures for every lead source in your organization based on their closing week.

Analyzing effective sales methodology, inbound vs. outbound: Picklist-based comparison
Businesses use both inbound and outbound lead generation strategies, and each of these methods can reap different results based on the season and occasion. By comparing inbound versus outbound each month, you can identify which works best at what time.

Analyze the amount versus the expected revenue between accounts: Aggregate-based comparison
Expected revenue is a result of a deal's progression in the sales pipeline. Comparing the amount versus their expected revenue will not only help visualize the expected revenue of participating accounts but also indicate the accounts' stage in the sales pipeline.

Sankey
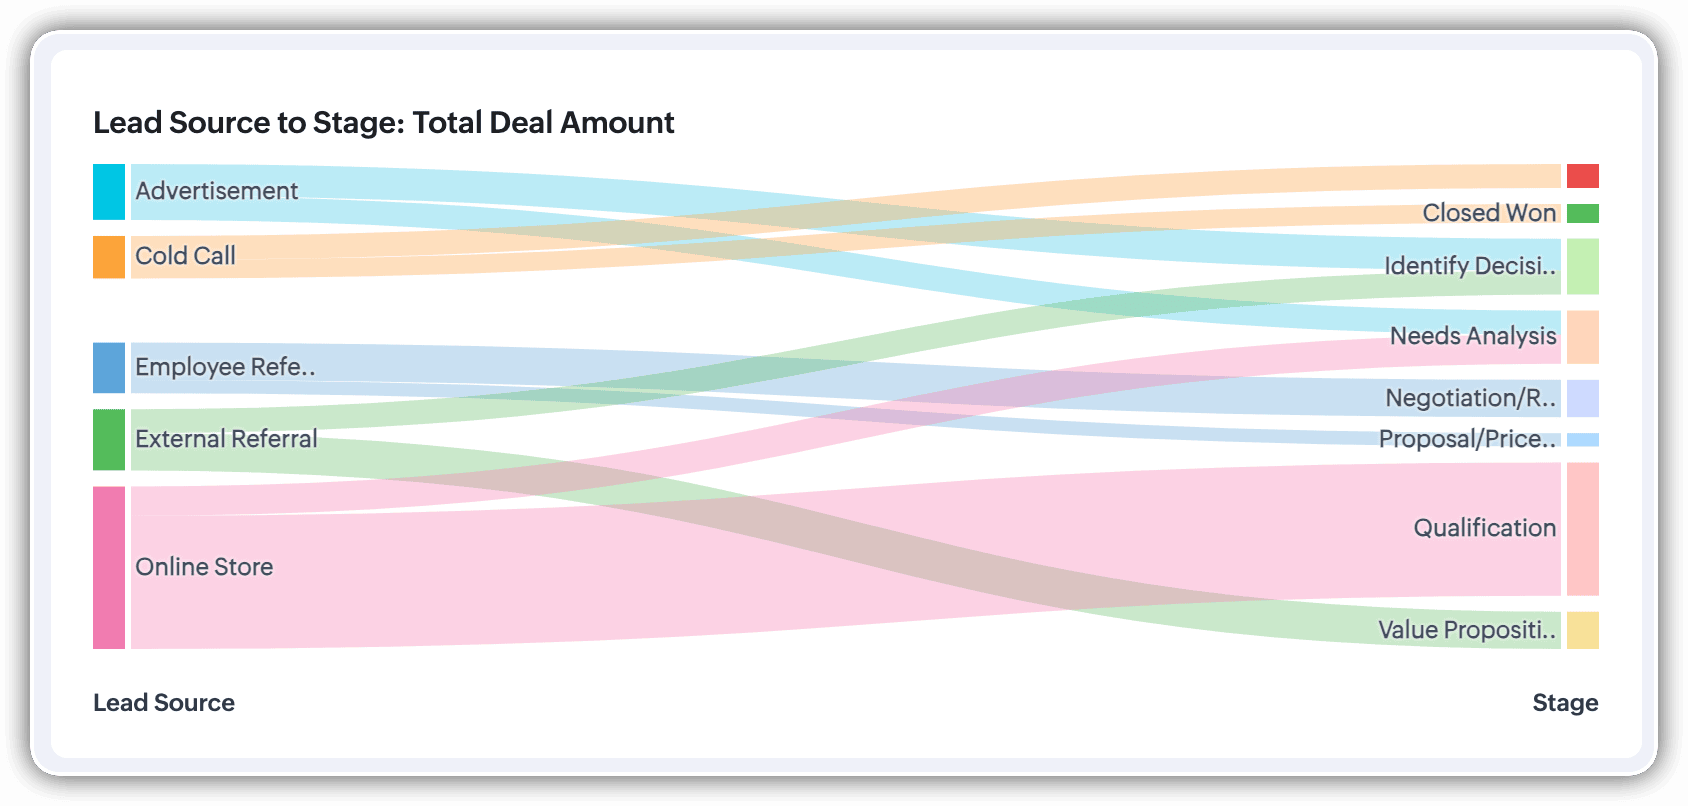
A Sankey Chart is designed to visualize the movement of data across different data groups. Unlike traditional charts—such as bar, column, pie, or donut—that mainly provide a static distribution of values, the Sankey Chart focuses on illustrating the flow between multiple segments or grouping fields. This makes it an ideal choice when you want to track how values (like lead counts, revenue, or deal statuses) move from one category to the next.

Key features
- Flow visualization: With the Sankey Chart, you can observe the movement of data between different groups.
- Multiple grouping fields: This chart works best when you have at least two grouping fields. You can go even further and add a third grouping to see an even more detailed mapping of your data flow.
- Simple configuration: The configuration for the Sankey Chart is as simple as any other chart type in Analytics.
Business scenarios:
Imagine you’re a sales manager trying to get a better handle on your team’s performance and your company’s pipeline. You want to understand not just how many deals are coming in, but also which sources are contributing the most value—and how those deals are progressing through different sales stages.
Let’s say you want to understand which lead sources are driving the most deal activity and how those deals progress through the pipeline. You can create a Sankey chart that maps the count of deals from Lead Source to Stage.

After analyzing the chart, you might notice that Online Store brings in a high volume of early-stage deals, while sources like External Referral contribute fewer deals that are more likely to reach advanced stages like Proposal or Negotiation.
This insight helps you prioritize nurturing the most profitable channels.
Sankey charts can also be helpful in other operational scenarios where understanding transitions across stages or teams is essential:
- Regional revenue distribution: Visualize how revenue flows across different regions, product categories, and their corresponding annual revenue. This helps you compare which regions contribute the most to each product line and where your high-value segments lie.
- Ticket handling flow: Visualize the flow of support tickets from their origin channel to internal departments and finally to resolution statuses. This can reveal workload imbalances or common points of delay in your support process.
Cluster
A cluster chart is similar to stacked column charts, but instead of stacking horizontally, the data is represented as vertical bars. As you create a column chart with multiple groupings, you can change the type of column chart to a cluster chart to achieve this representation.

In the above image, you can see the stacked column chart compares the number of lead conversions based on popular sources between countries. The stacks appearing on top of existing stacks ask you to calibrate the record count (y-axis) based on the previous stacks, which can lead to inaccurate interpretations. In this case, a cluster representation will paint a clearer picture of the analyses.
Other minor enhancements:
In addition to the three charts we mentioned above, we've also made the following minor changes:
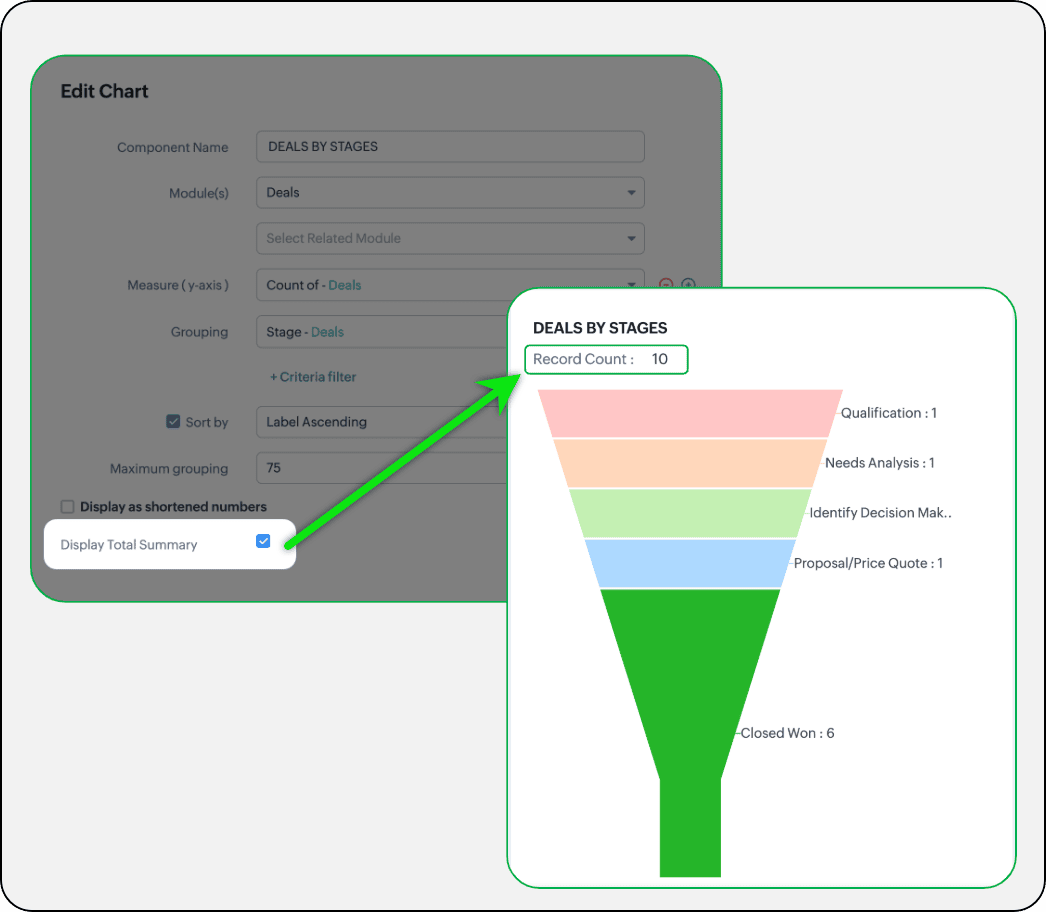
- Display total summary: Thus far, for all charts, each participating measure included labels. Now, to better understand overall contributions, a check box to display the total summary is provided under More options on the Chart Configuration page. Based on the configuration, the total revenue or the rolled-up quantities will be prominently displayed.
- Merge Y-axis: For charts that use two y-axis measurements, the intention is to view the progression of one entity against these two measures. Despite the scale, if the y-axis on the left is disproportionate to the values of the y-axis on the right, the plotted graph will result in a graphically and logically incorrect representation.
As you can see in the image below, the plot area of the sum of amount bar and the sum of expected revenue aligns close together, while, the difference between $700,000 and $40,500 is drastic, creating inaccurate interpretations.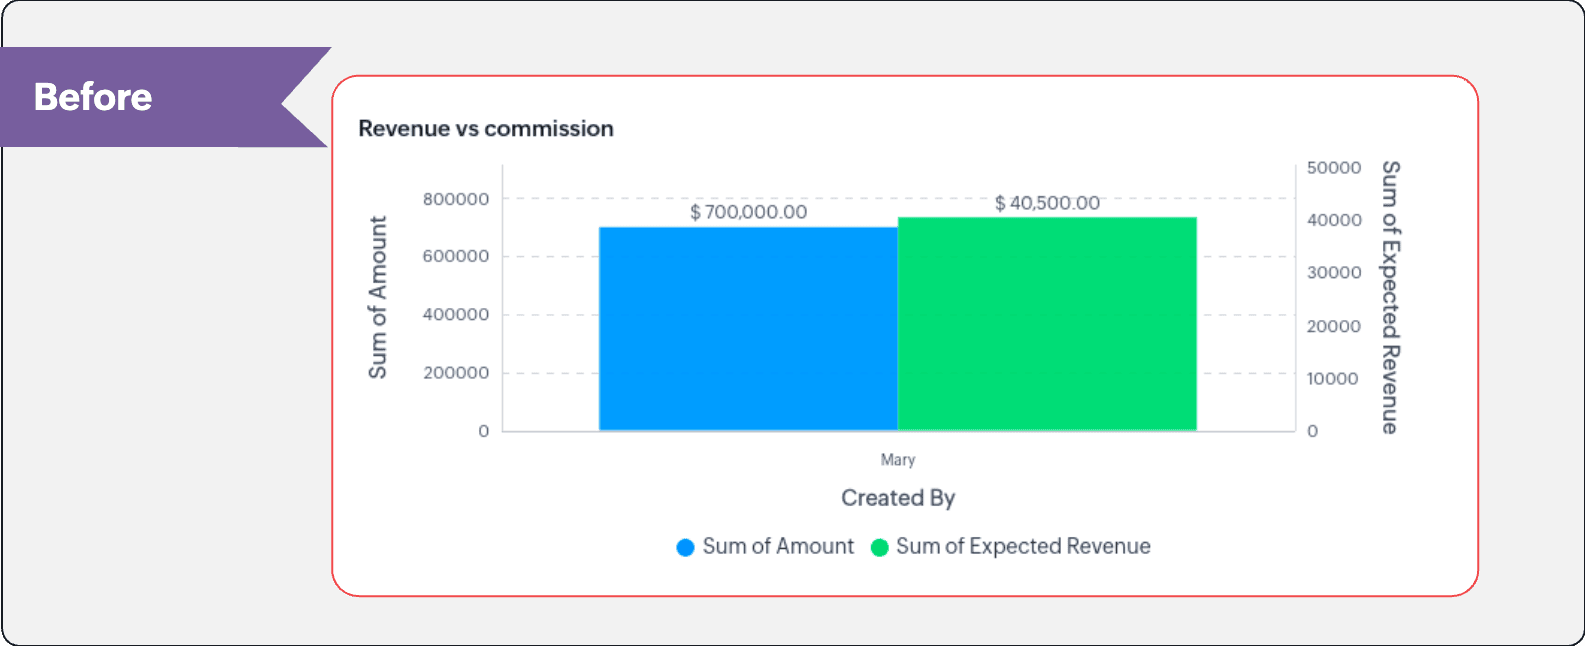
In this enhancement, we're allowing neighboring values of measures to merge so that the interpretation can be more visually accurate.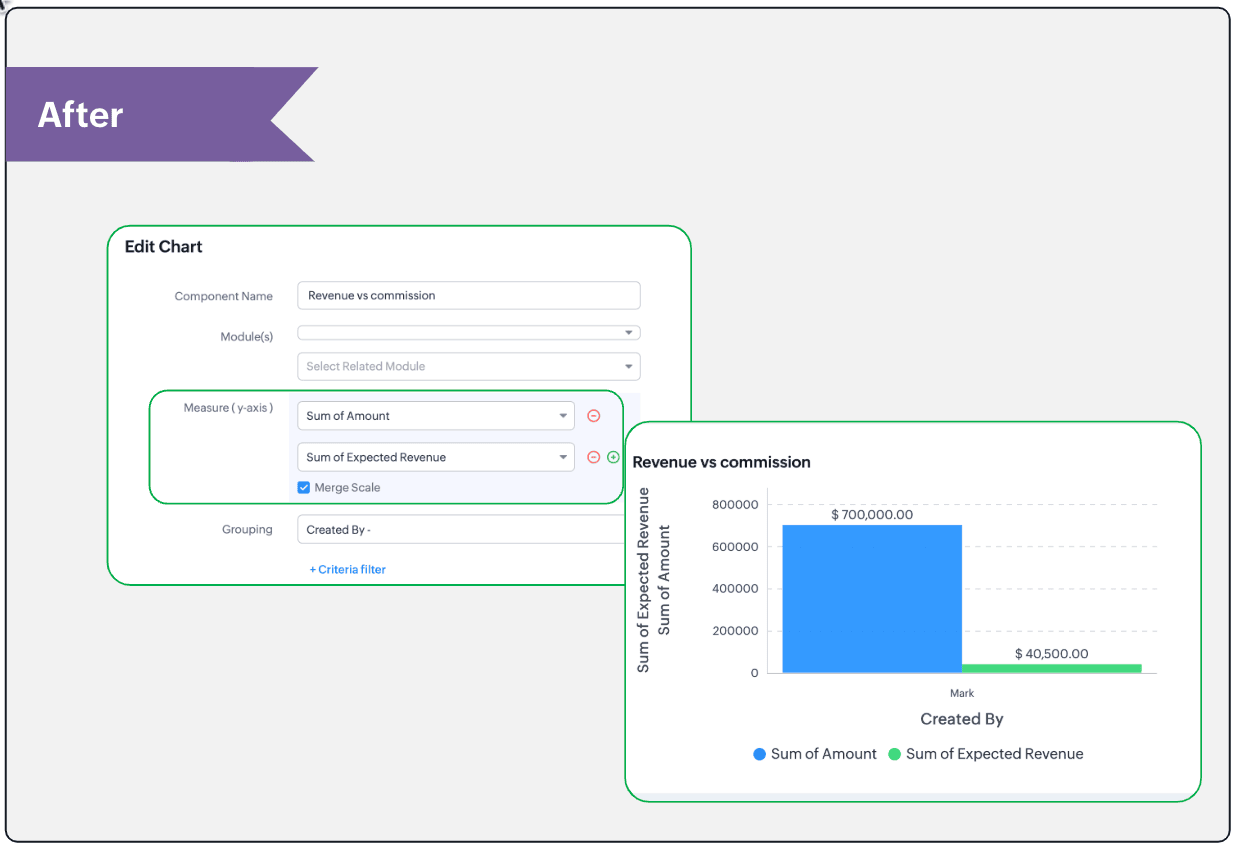
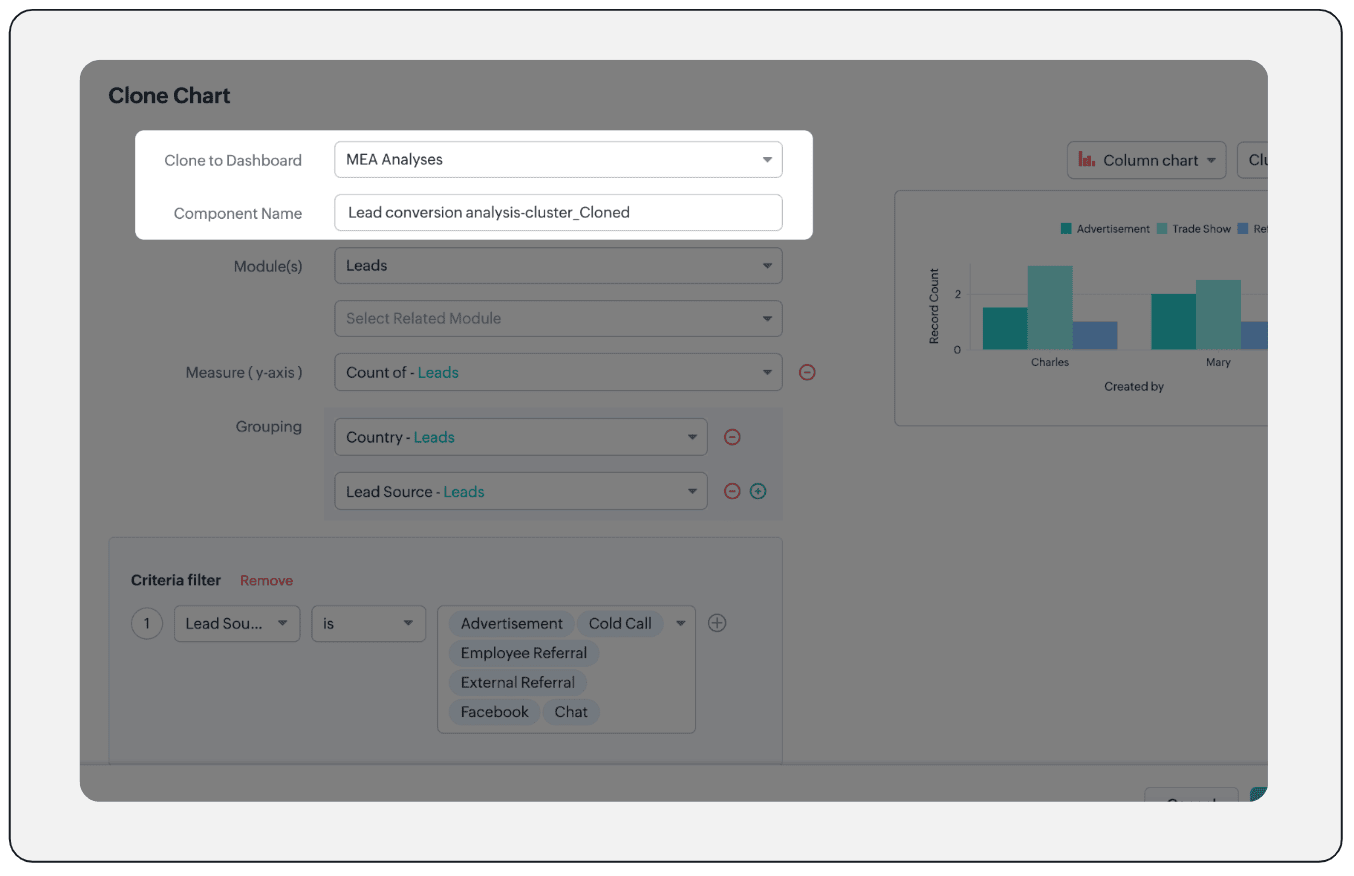
- Clone components to a different dashboard: Dashboards in Analytics serve in unique ways for various audiences—there can be separate dashboards for the sales team, marketing team, engineering team, and so on, and the chances of using the same measure for reference is common. Thus, when you clone a chart, you can now determine the target dashboard in which the cloned chart can be placed.
Resource: Help document
Thanks and have a good one!
Kind regards,
Saranya Balasubramanian
Saranya Balasubramanian
Topic Participants
Saranya Balasubramanian
Sticky Posts
Good news! Calendar in Zoho CRM gets a face lift
Dear Customers, We are delighted to unveil the revamped calendar UI in Zoho CRM. With a complete visual overhaul aligned with CRM for Everyone, the calendar now offers a more intuitive and flexible scheduling experience. What’s new? Distinguish activitiesConsumers are talking about your business. Are you listening?👂
A loyal customer might be praising your product in a forum. A frustrated user could be posting a harsh review on a public site. An excited partner may have left a comment on your campaign. A domain expert might be deconstructing your product. A prospectEnhancements to the formula field in Zoho CRM: Auto-refresh formulas with the "Now" function, stop formula executions based on criteria, and include formulas within formulas
Dear Customers, We hope you're well! By their nature, modern businesses rely every day on computations, whether it's to calculate the price of a product, assess ROI, evaluate the lifetime value of a customer, or even determine the age of a record. WithElevate your CX delivery using CommandCenter 2.0: Simplified builder; seamless orchestration
Most businesses want to create memorable customer experiences—but they often find it hard to keep them smooth, especially as they grow. To achieve a state of flow across their processes, teams often stitch together a series of automations using WorkflowPresenting ABM for Zoho CRM: Expand and retain your customers with precision
Picture this scenario: You're a growing SaaS company ready to launch a powerful business suite, and are looking to gain traction and momentum. But as a business with a tight budget, you know acquiring new customers is slow, expensive, and often delivers
Recent Topics
Can i connect 2 instagram accounts to 1 brand?
Can i connect 2 instagram accounts to 1 brand? Or Do i need to create 2 brands for that? also under what subscription package will this apply?Zoho Forms - Improved Sub-Forms
Hi Forms team, I'm helping a client move from JotForms to Zoho Forms and I've found another opportunity for improvement. In the below screenshot, JotForm left and Zoho Forms right. The Zoho Forms Sub-Form is quite a poor visually. There is no way to makeWhat's New in Zoho Billing | Q3 2025
Hello everyone, We are excited to share the latest set of updates and enhancements made to Zoho Billing in Q3 2025. From the latest GST updates to multi-level discounting, Zia-powered report summaries, and customizable web forms, these updates are designedHow to Delete Personal Account Linked with My Mobile Number in past or by someone else
How to Delete Account Created with My Mobile Number in past or by someone else This is creating issues in making or sync with my credentials mobile and email address..WhatsApp Business Calling API
Dear Zoho SalesIQ Team, I would like to request a feature that allows users to call WhatsApp numbers directly via Zoho SalesIQ. This integration would enable sending and receiving calls to and from WhatsApp numbers over the internet, without the needDoes Zoho Learn integrate with Zoho Connect,People,Workdrive,Project,Desk?
Can we propose Zoho LEarn as a centralised Knowledge Portal tool that can get synched with the other Zoho products and serve as a central Knowledge repository?Marketer's Space - Going beyond basics: Smarter ecommerce marketing with Zoho Campaigns
Hello Marketers, Welcome back to this week's Marketer's Space. In the last post, we discussed the basics of email marketing and how to get started with email marketing in ecommerce. In this part, we'll dive much deeper into some other advanced featuresConnecting two modules - phone number
Hi, I’d like some guidance on setting up an automation in Zoho CRM that links records between the Leads module and a custom module called Customer_Records whenever the phone numbers match. Here’s what I’m trying to achieve: When a new Lead is createdZoho Marketing Automation 2.0 - Landing Page function not working
Dear Zoho Team, I am working on implementing Zoho Marketing Automation 2.0, and am now looking into the section "Lead Generation". If I open the "Landing Pages" section, I immediately get an Error code: Error: internal error occurred. Can you help meUnable to use Sign "You have entereed some invalid characters"
Unable to use Sign "You have entered some invalid characters" I do not see any invalid characters. The text in "Leave a Note" is plain text which I entered directly into the field. See attached screenshotElevate your CX delivery using CommandCenter 2.0: Simplified builder; seamless orchestration
Most businesses want to create memorable customer experiences—but they often find it hard to keep them smooth, especially as they grow. To achieve a state of flow across their processes, teams often stitch together a series of automations using WorkflowMessages not displayed from personal LinkedIn profile
Hello. I connected both our company profile and my personal profile to Zoho social. I do see all messages from our company page but none from my private page. not even the profile is being added on top to to switch between company or private profile,"Performed changes in the query is not allowed due to following reason" when adding columns or reordering data
I'm trying to make changes to a query but every time i try to save it i get this error message. I'm not touching the data it's flagging. All I've tried to do is reorder a couple of fields and add a new one. Why won't it let me do this? It's a core queryOnboard new users easily with native screen recording in Zoho Projects Plus
Communication involving both visual and audio elements tends to capture more interest among the audience. Whenever we onboard new employees to the organization, the task of engaging them in the induction sessions, and keeping the spark going in theirRequest to Add Support for PDF Templates and More Flexibility in Email Editor
Hi Zoho Campaigns Team, I hope you're doing well. I wanted to share some feedback and request a few improvements in the Email Template feature of Zoho Campaigns. Right now, we can create email templates using the HTML editor, which is helpful. But we’reCan you stop Custom View Cadences from un-enrolling leads?
I'm testing Cadences for lead nurture. I have set un-enroll properties to trigger on email bounce/unsubscribe, and do NOT have a view criteria un-enroll trigger. However, help documents say that emails are automatically un-enrolled from a Cadence whenZoho Desk Android and iOS app update: Agent detail overview
Hello everyone! We’ve introduced agent detail overview on the Zoho Desk Android and iOS app update. With this feature, you can get a complete view of agent’s tickets, response times, logged hours (for both tickets and activities), customer happiness ratingsBlog Widget: Show recent blog posts on my homepage
Hey there I am using the Zoho Sites Blog feature. On my homepage, on the bottom I'd like to have a featured content section where I show some of my blog posts (selected, most recent, filtered by category and so on...). It would be nice to have a blogHow to iterate through excel data using zoho rpa
I wanted to iterate or loop through excel data ( datatable). How can i do thatZoho Commerce
Hi, I have zoho one and use Zoho Books. I am very interested in Zoho Commerce , especially with how all is integrated but have a question. I do not want my store to show prices for customers that are not log in. Is there a way to hide the prices if notMass (Pull back) (Close WOs) (Close APs)
Hi develop team. Just idea because Zoho FSM is great but its too manual. we have a lot of task to do every day and the system needs to have more features to automatic our tasks. I need to close several WOs, APs and Pull Back per day. Please we need massCustomising Zohidesk portal default widgets
Hello, I'm wondering how could I customise the default widgets such as "popular topics", "popular articles" using CSS or to make the tiles at the bottom match the ones that I made in the picture attached. I have made some custom widgets and edited themIf there’s a batch at the end, the ‘mark as inactive’ function doesn’t work.
when my batch has a date to batch end and I "mark as inactive" he batch does not obey the status and reactivates the batch.Seamless multilingual messaging and tone control in Zia IM Composer
Hello everyone! Managing customer conversations across multiple languages can be time-consuming. Using Zia in the Instant Messaging (IM) Composer helps you overcome this by providing tools to translate content, adjust your tone, and refine your messagesAdvanced Deluge help needed with custom function and COQL limits
I have a scheduled function that takes a snapshot of specific metrics and saves them to a custom module. However I'm struggling with the limits of COQL. I attach my full code, but an example of the issues I'm having is that it's erroring with a 'LimitTip of the Week - Conditional Formatting Chart
Conditional formatting allows you to highlight your data series based on a pattern or a trend in your data. This makes it easy for you to identify when your data reaches certain values or when it deviates from the trend. Zoho Analytics allows you toZoho Learn - AI Translate
Hi Learn team, I had a situation today where I was providing training to a client team and I had written articles into their Zoho Learn to support their learning. I realised that one of the team members was a non-native English speaker and they were strugglingPayroll In Canada
Hi, When can we expect to have payroll in Canada with booksPower of Automation :: Auto-Sync Custom Date Field Between Related Tasks via Blueprint Transition
Hello Everyone, A custom function is a software code that can be used to automate a process and this allows you to automate a notification, call a webhook, or perform logic immediately after a workflow rule is triggered. This feature helps to automateIntroducing auto-upgrade in Zoho LandingPage
Hi everyone, We’re excited to share an upcoming update to help you get the most out of your landing pages — the auto-upgrade option, launching on October 22, 2025. Your landing pages are designed to bring in leads, and we want to make sure you never missWorkdrive comment links stopped working.
I have marked a PDF file with 95 comments, they have worked for a while. When i clicked on them they brought me to the correct page and showed me the outline that i had drew on the plans. The comments included the page number of the outline, but now itHow to Bulk-Update Sales Orders in CRM
Hi - I need to bulk update existing sales orders with dates from our ERP of when the sales orders were created. I made a date field on the Sales Order module where I want to insert that data. I can't Mass Update because I am not updating the fields toZoho ToDo in Cliq
Our organization utilizes Zoho ToDo in the Zoho Mail Desktop app. Is there a way for these to show up in Cliq Desktop app as well?【Zoho CRM】サンドボックス機能のアップデート:カスタムビューが利用可能になりました。
ユーザーの皆さま、こんにちは。コミュニティチームの中野です。 今回は「Zoho CRM アップデート情報」の中から、サンドボックス機能のアップデートをご紹介します。 目次 1. カスタムビューとは 2. 今回の機能アップデートについて 1. カスタムビューとは カスタムビューは、ユーザーが設定した条件に基づいてデータをフィルタリング・整理し、 重要な情報へ効率的にアクセスできるようにする機能です。 「過去15日間の見込み客」や「受注間近の商談」、「特定の優先度レベルが設定された案件」など 条件を指定してわずか数クリックで設定できます。Changing an agents email address
How do you change an agent's email address? I keep getting a red circle even though I am an admin. And on one of my agents he has two email addresses? How is that possible?Zoho CRM - Potentials Tab
Hi! When I create a Deal (Potentials tab) the header looks like this: After a refresh on the page it looks like this: What should I do so that it is displayed like in the second pic without refresh? Also I have a user that as of recently, cannot see thisIs there a way to automatically add Secondary Contacts (CCs) when creating a new ticket for specific customers?
Some of our customers want multiple contacts to receive all notifications from our support team. Is there a way to automatically add secondary contacts to a ticket when our support team opens a new ticket and associates it with an account? This wouldUnable to create embed code for resource of workdrive using API
Hello Team, I am trying to create embed code for a resource using workdrive api in powershell, however facing some issues with injecting data in body. Followed Doc: https://workdrive.zoho.com/apidocs/v1/filefoldersharing/shareeveryone Please help, belowFeature Request - Insert URL Links in Folders
I would love to see the ability to create simple URL links with titles in WorkDrive. or perhaps a WorkDrive extension to allow it. Example use case: A team is working on a project and there is project folder in WordDrive. The team uses LucidChart to createnot able to convert pdf to jpg and other forms and vice versa.
i want to change my pdf to jpg, word, etc and some times jpg to pdf. i don't know how to do in this.Next Page