Customer Segmentation using RFM Analysis

Customer Segmentation using RFM Analysis

How well do you know your customers? Whether you operate in a B2B or B2C space, chances are that 80% of your business comes from just 20% of your customers (Pareto's Principle). According to a study by Forbes, acquiring new customers costs five times more than retaining the existing ones. Identifying high-value customers is crucial to increase revenue and building brand loyalty.

Customer Segmentation is a critical strategy for businesses to understand and engage with customers effectively. Understanding the behavioral patterns of customers can help personalize the purchases they make and cater to their needs better. 

Questions like who are the customers who contribute more to sales, who are the customers about to churn, will help digital marketers understand the behavioral patterns of their customers. 

While there are many criteria based on which the customer base can be segmented, this solution focuses on segmenting customers based on the RFM analysis.

What is RFM Analysis?

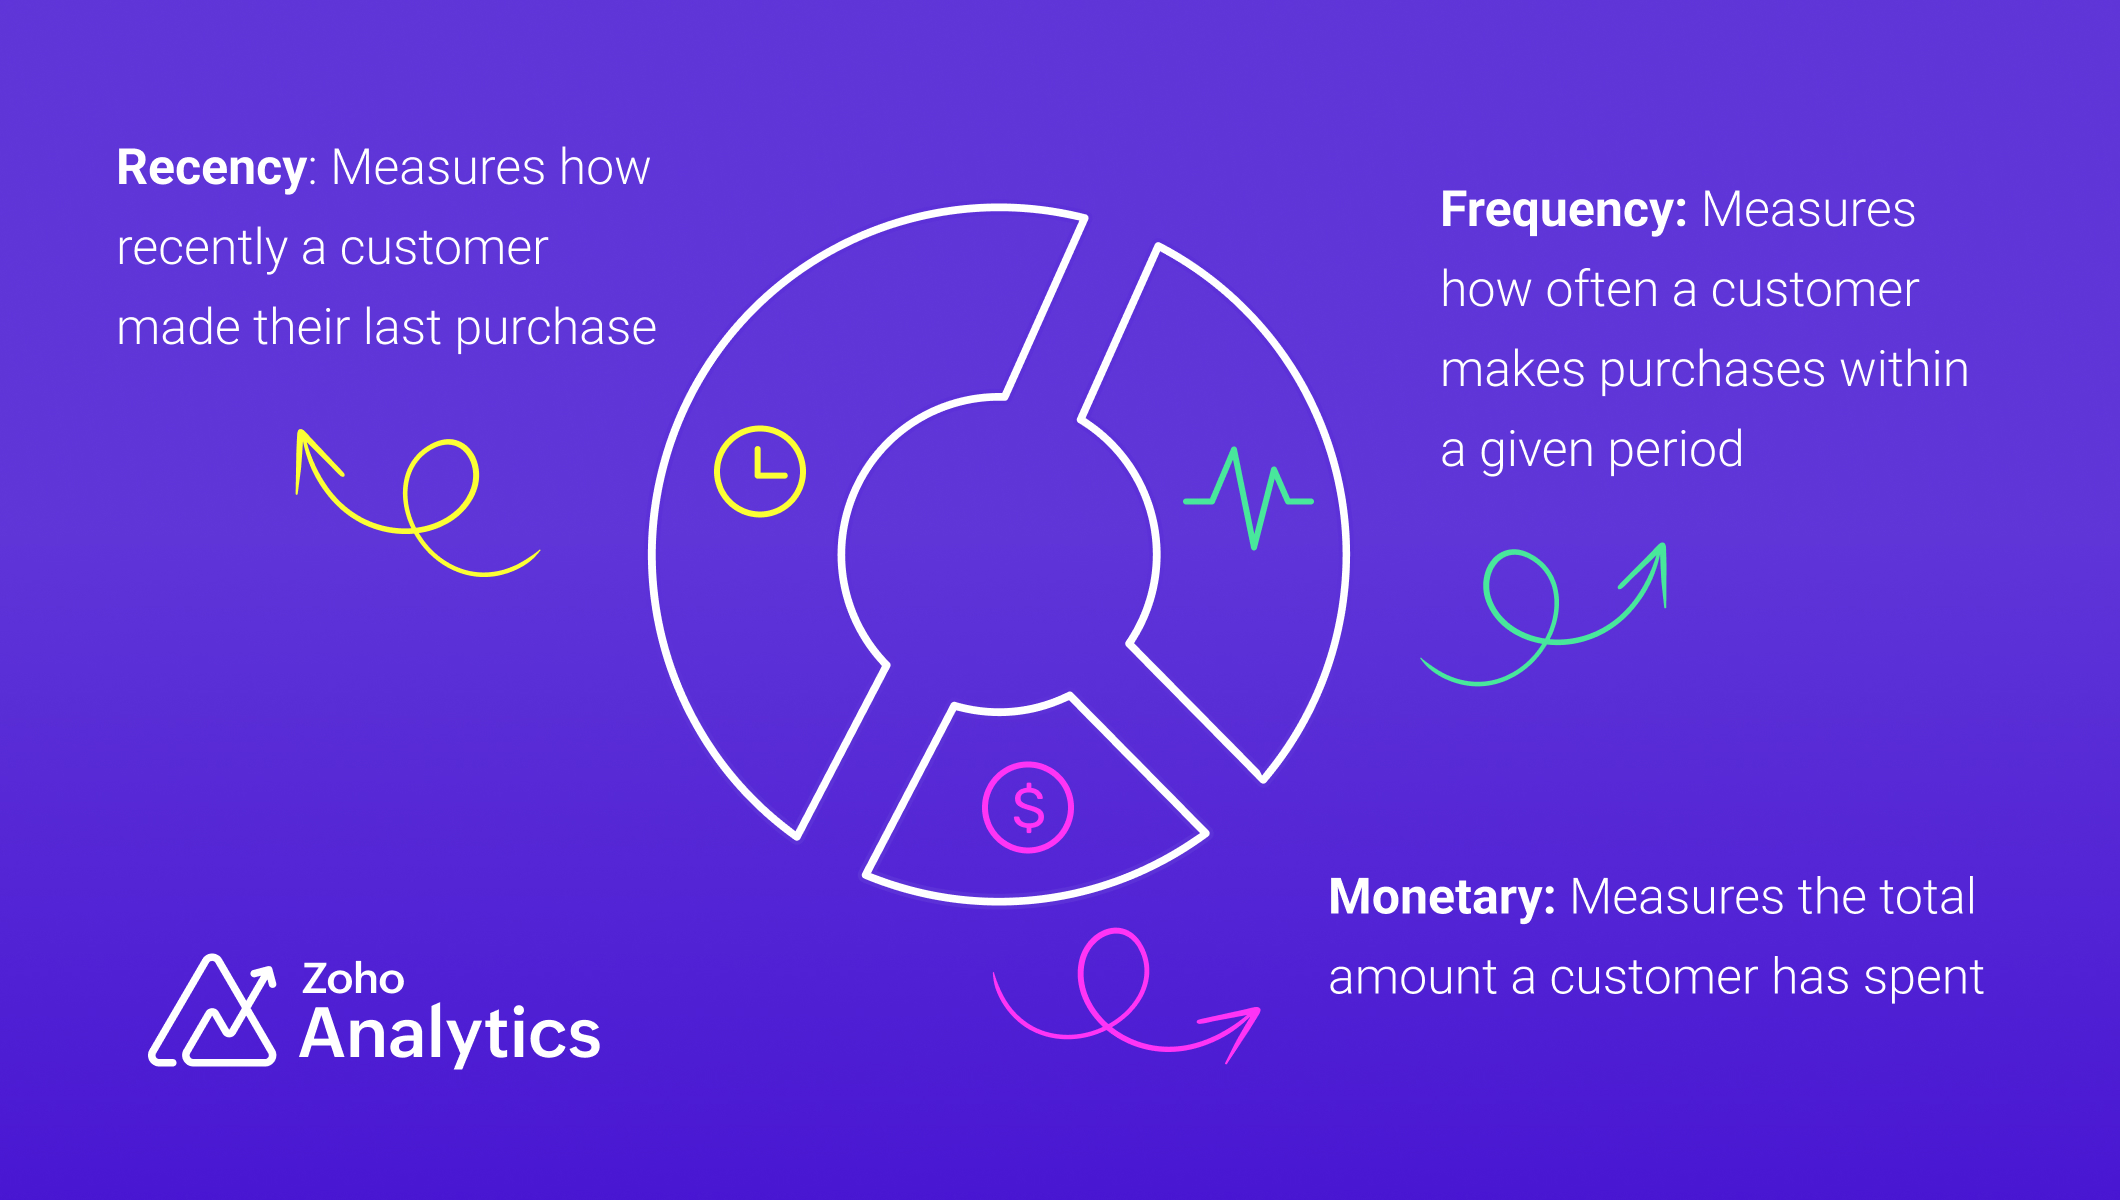
RFM analysis (Recency, Frequency and Monetary) is a method used to identify and segment existing customers based on their purchasing behavior.  The key metrics of RFM analysis include

Recency

Recency refers to how recently a customer has made their purchase and this is the most important metric of the other metrics. This metric is a strong indicator of customer loyalty and interest.

Frequency

Frequency refers to how often a customer makes purchases or interacts with a business within a specific period. It measures the level of engagement and loyalty of a customer.

Monetary

Monetary value refers to the total amount of money a customer has spent with a business during a specific period. 


Industry-Specific Applications of RFM Analysis

  • SaaS and subscription services: RFM analysis can be adapted for SaaS and subscription services to segment users based on engagement, renewals, and revenue contribution.
  • Financial Sector: RFM analysis can improve credit scoring and risk assessment by evaluating customer transaction patterns, helping financial institutions make more informed loan approval decisions.

Data Requirements

For RFM analysis, you'll need a transactional dataset with the following equivalent columns (details) 
  • A product (Product ID)
  • A related transaction (Transaction ID)
  • Number of products purchased in a transaction (Product Quantity)
  • The product purchase price (Product Price)
  • Transaction date (Date)
  • Customer who made the purchase (Customer ID, Customer Name)
We have used a sample table of e-commerce data for illustration.

Steps for Implementing RFM analysis

1. Gather and Prepare Transaction Data : 

Gather all transaction data, ensuring it includes customer identifiers, transaction dates, and monetary amounts, and address missing or inconsistent values, ensuring data integrity before analysis.

2. Compute RFM Metrics: 

To segment customers based on their behavior, we compute three key metrics: Recency (R), Frequency (F), and Monetary Value (M). Below are SQL queries for each, along with detailed explanations.

Recency (R)

Recency measures how recently a customer made a purchase. It is calculated as the number of days since their last transaction. Customers with recent purchases are more engaged, while those who haven’t bought in a long time may be at risk of churn.

The time frame for RFM analysis should be tailored to your business model and industry. Choosing the right period for RFM analysis is essential, as it directly influences the accuracy of customer segmentation and the quality of insights derived.

Frequency (F)

Frequency tracks how often a customer makes purchases within a specific period. A higher frequency indicates a loyal customer who regularly shops, while a lower frequency suggests occasional or one-time buyers.

Monetary Value (M)

The total amount spent by the customer in the same period

RFM Query Table

SELECT
"Customer ID",
"Customer Name",
DAYS_BETWEEN(MAX("Transaction Date"), CURRENT_DATE()) AS "Recency",
COUNT ("Order ID") AS "Frequency",
SUM("Transaction Amount") AS "Monetary Value"
FROM  "Customer Data" 
GROUP BY "Customer ID",
  "Customer Name" 
ORDER BY "Recency" ASC,
  "Frequency" DESC,
"Monetary Value" DESC 


3. Segment Customers using Cluster Analysis

Manual scoring can skew the results and may not be practical for handling large volumes of data. In contrast, using machine learning algorithms like cluster analysis ensures unbiased, efficient, and data-driven segmentation. Unlike traditional scoring methods such as the quantile or percentile-based approach, cluster analysis recognizes inherent relationships and patterns in the data. With cluster analysis, business can obtain accurate segmentation and devise targeted strategies to improve sales and customer retention.

Follow the below steps to apply cluster analysis,
  1. Click the Create New icon and choose New chart from the drop-down menu.
  2. Add the columns to the chart shelf as shown below,
    1. X-axis: Customer Name
    2. Y-axis: Monetary Value with Sum function.
  3. Click Generate Graph and change the chart type to bar chart.
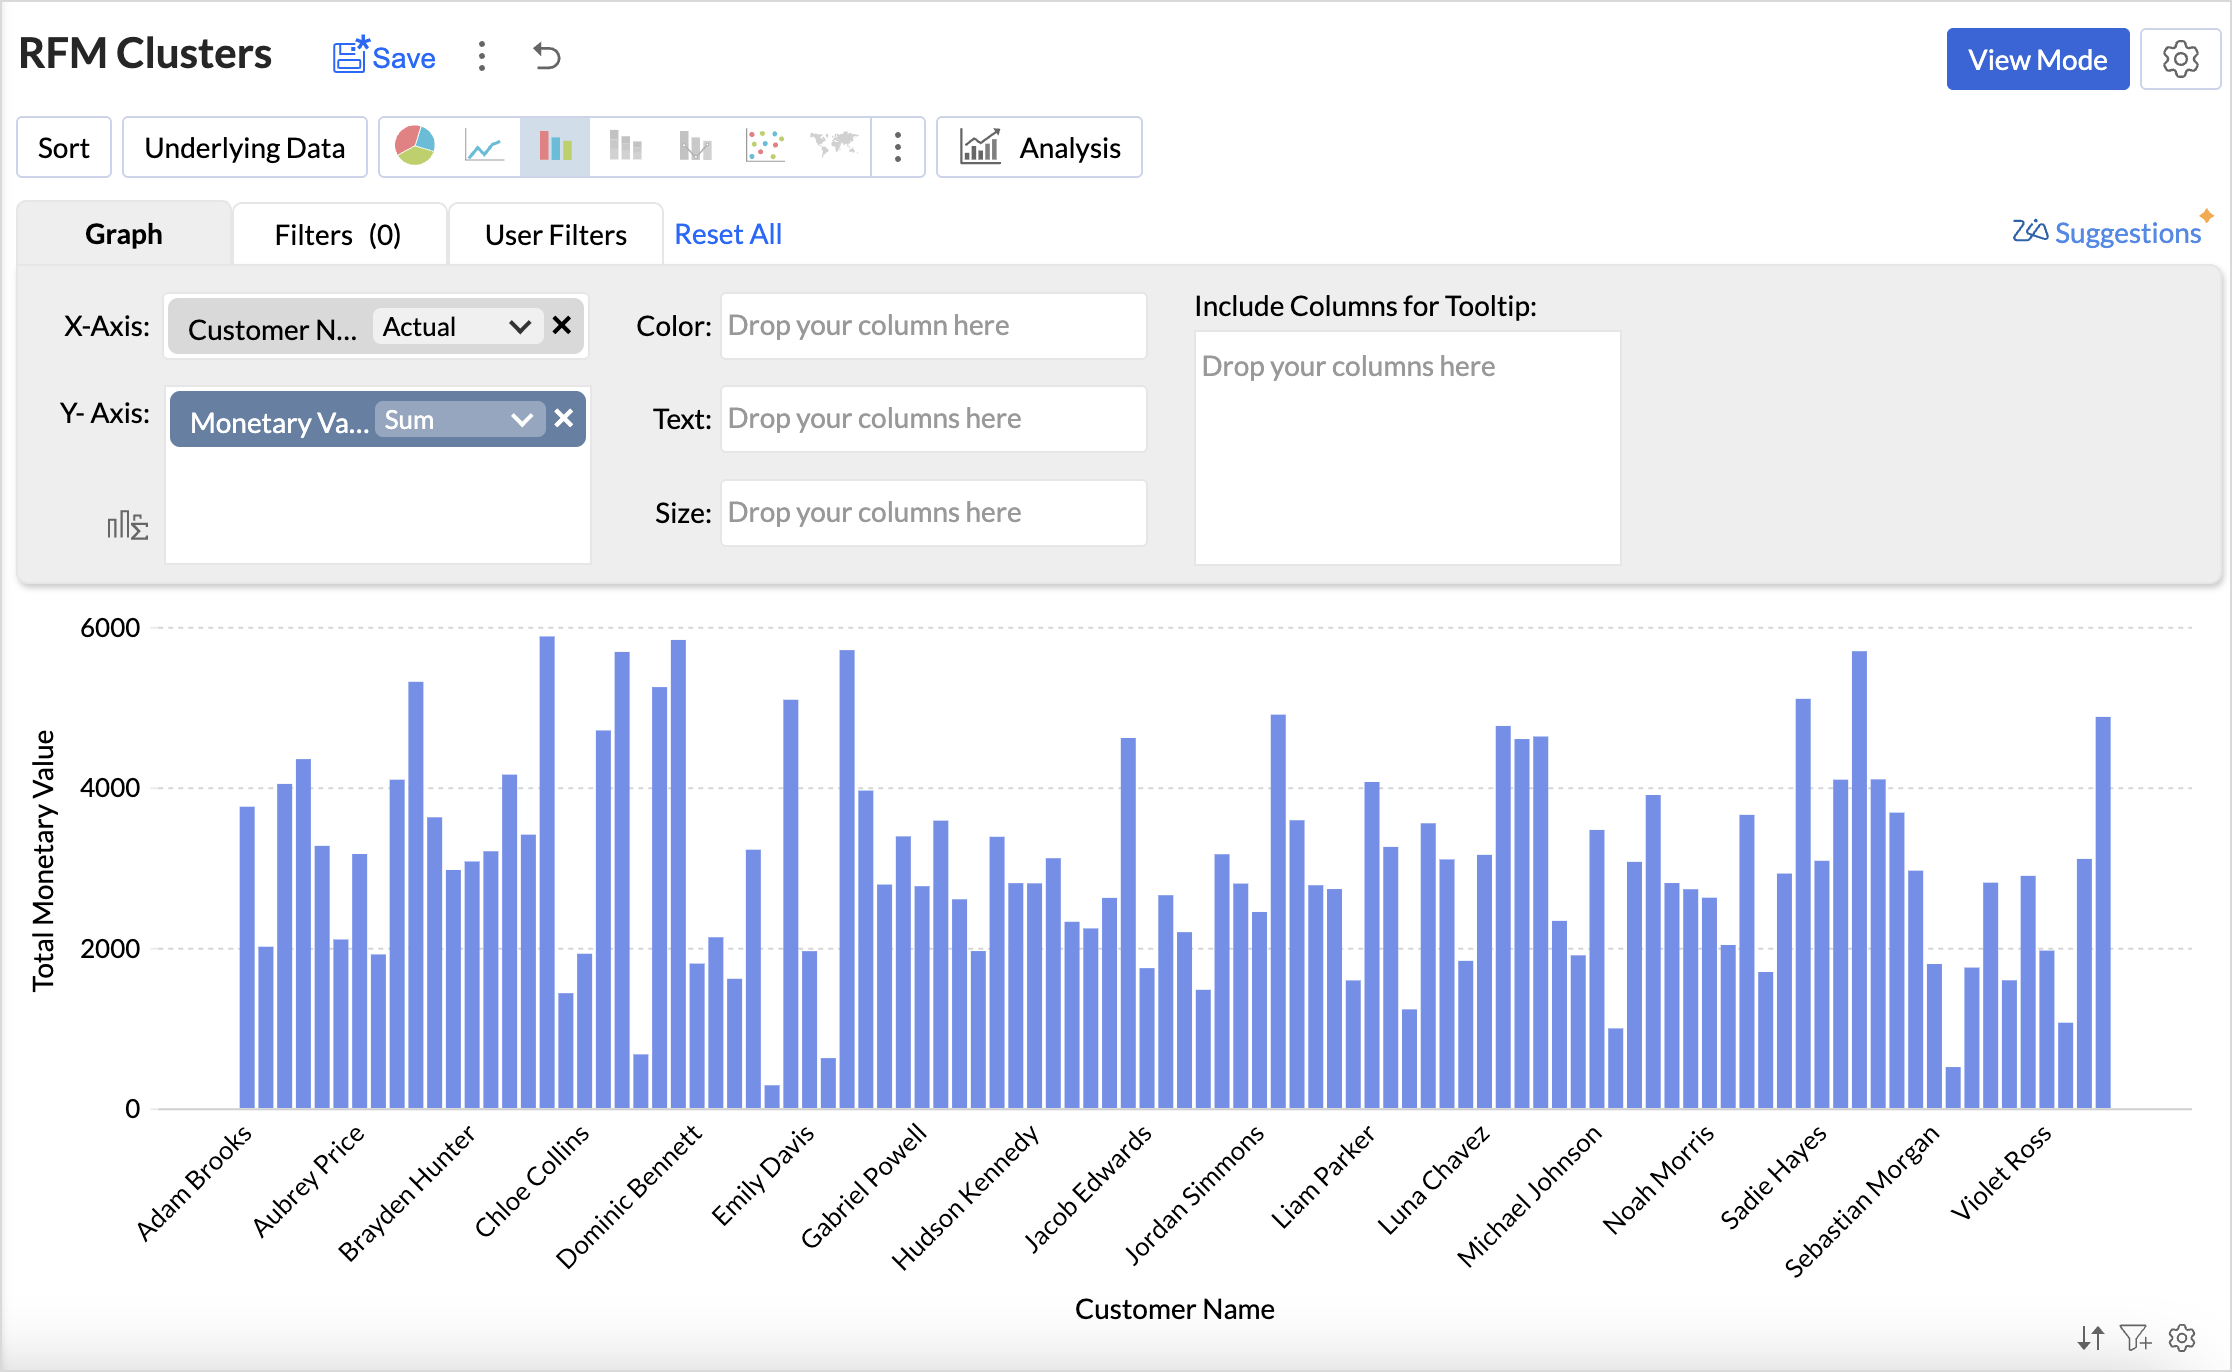
  4. Click the Analysis icon and select Cluster Analysis > Add Clusters.
  5. The Model is chosen automatically based on the columns dropped in the shelves.
  6. By default, the columns dropped in the shelves (Monetary Value) are selected as factors. Click the drop-down icon to include Recency and Frequency columns as factors.
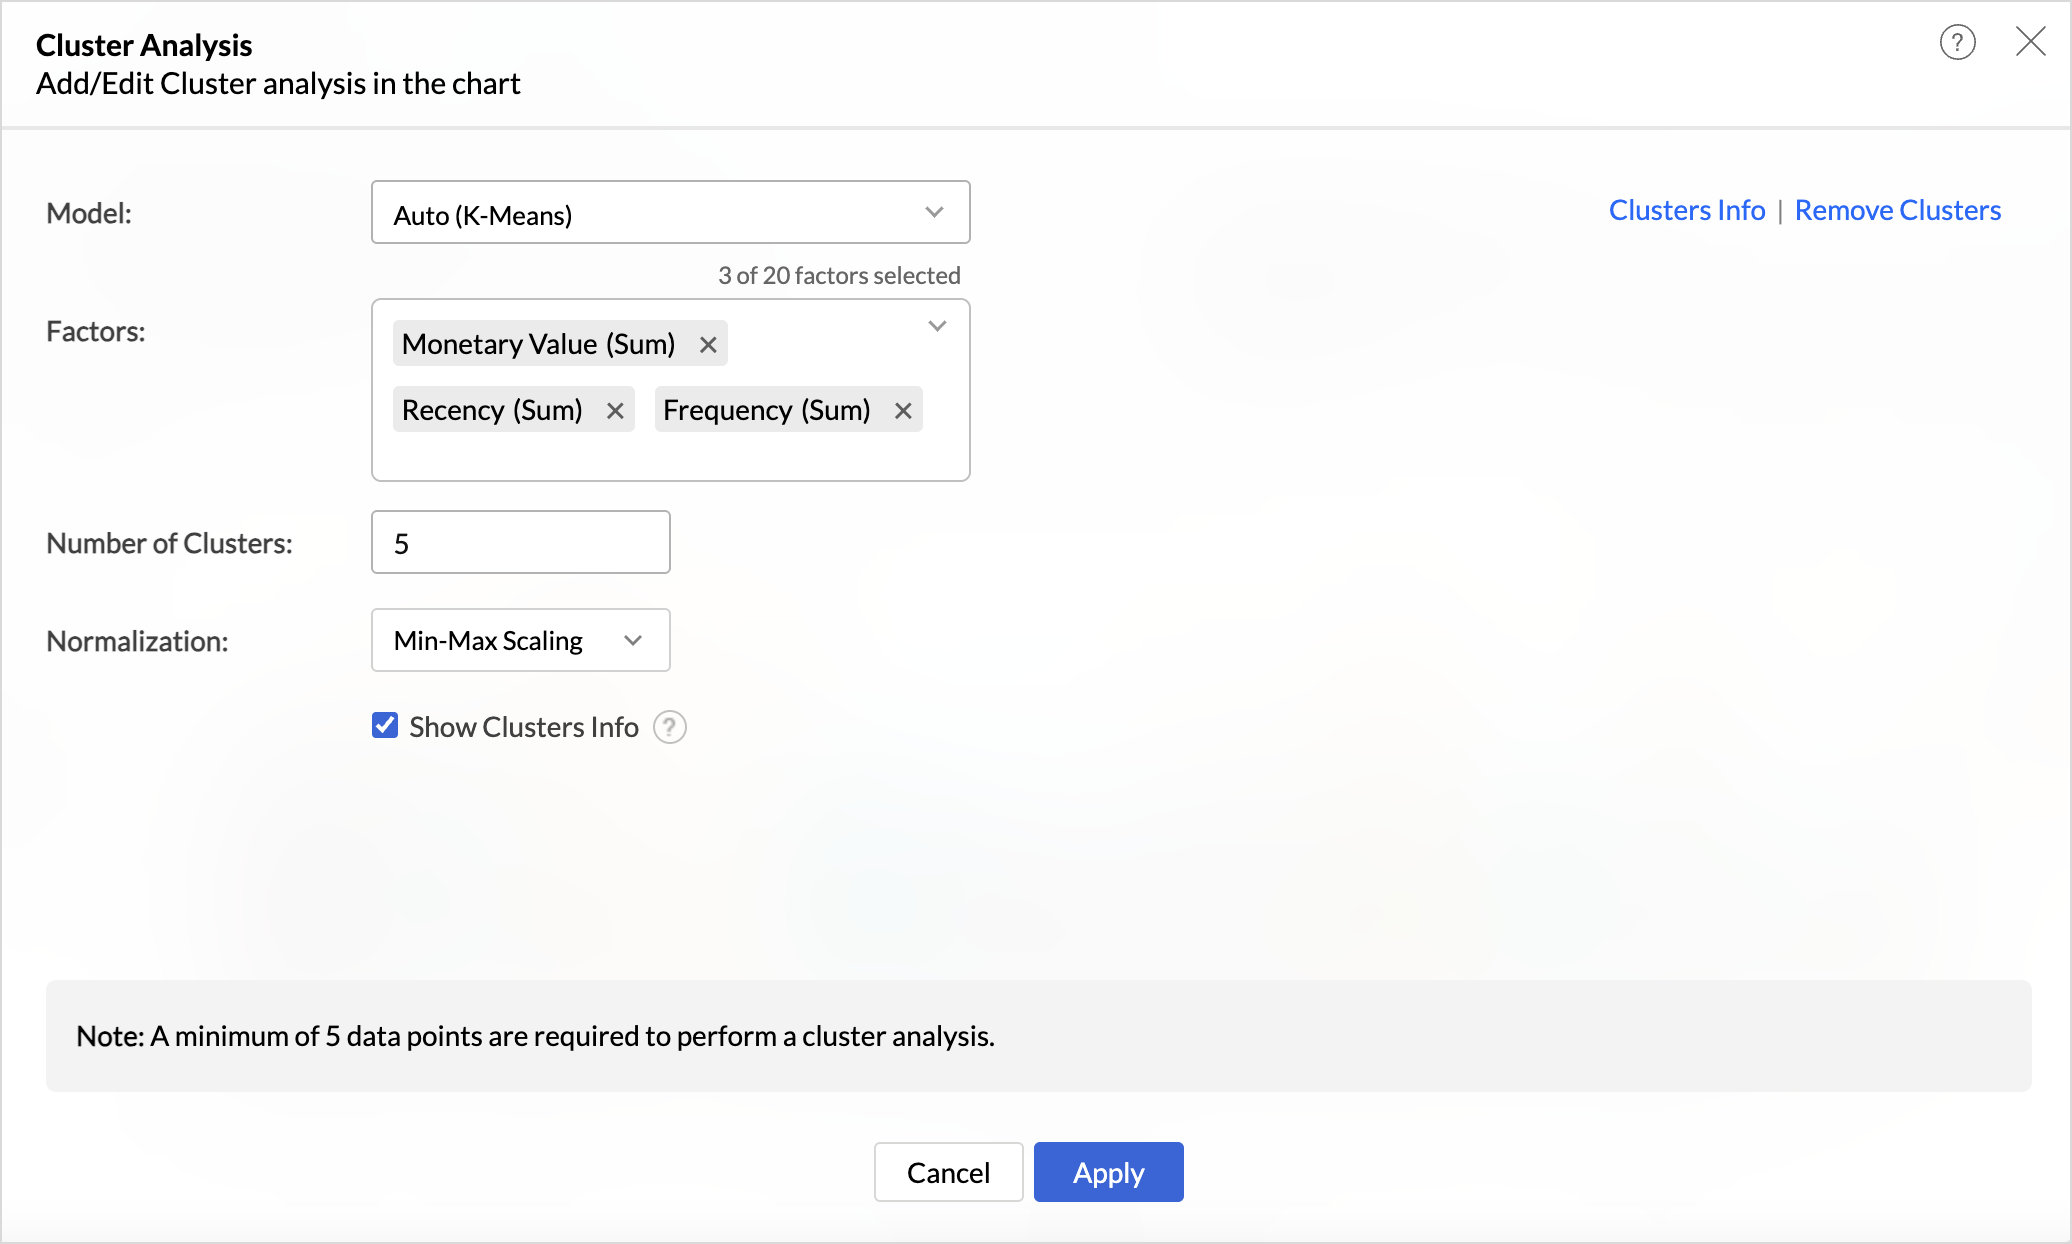
  7. The number of clusters is determined automatically but can be adjusted based on business needs and specific customer segmentation goals to ensure optimal categorization.
  8. Choose the Normalization method to prevent values of high ranges from dominating the results. For instance, Recency (measured in days) and Monetary Value (measured in currency) have different scales, and normalization ensures a balanced contribution from each metric.
  9. Click Apply.

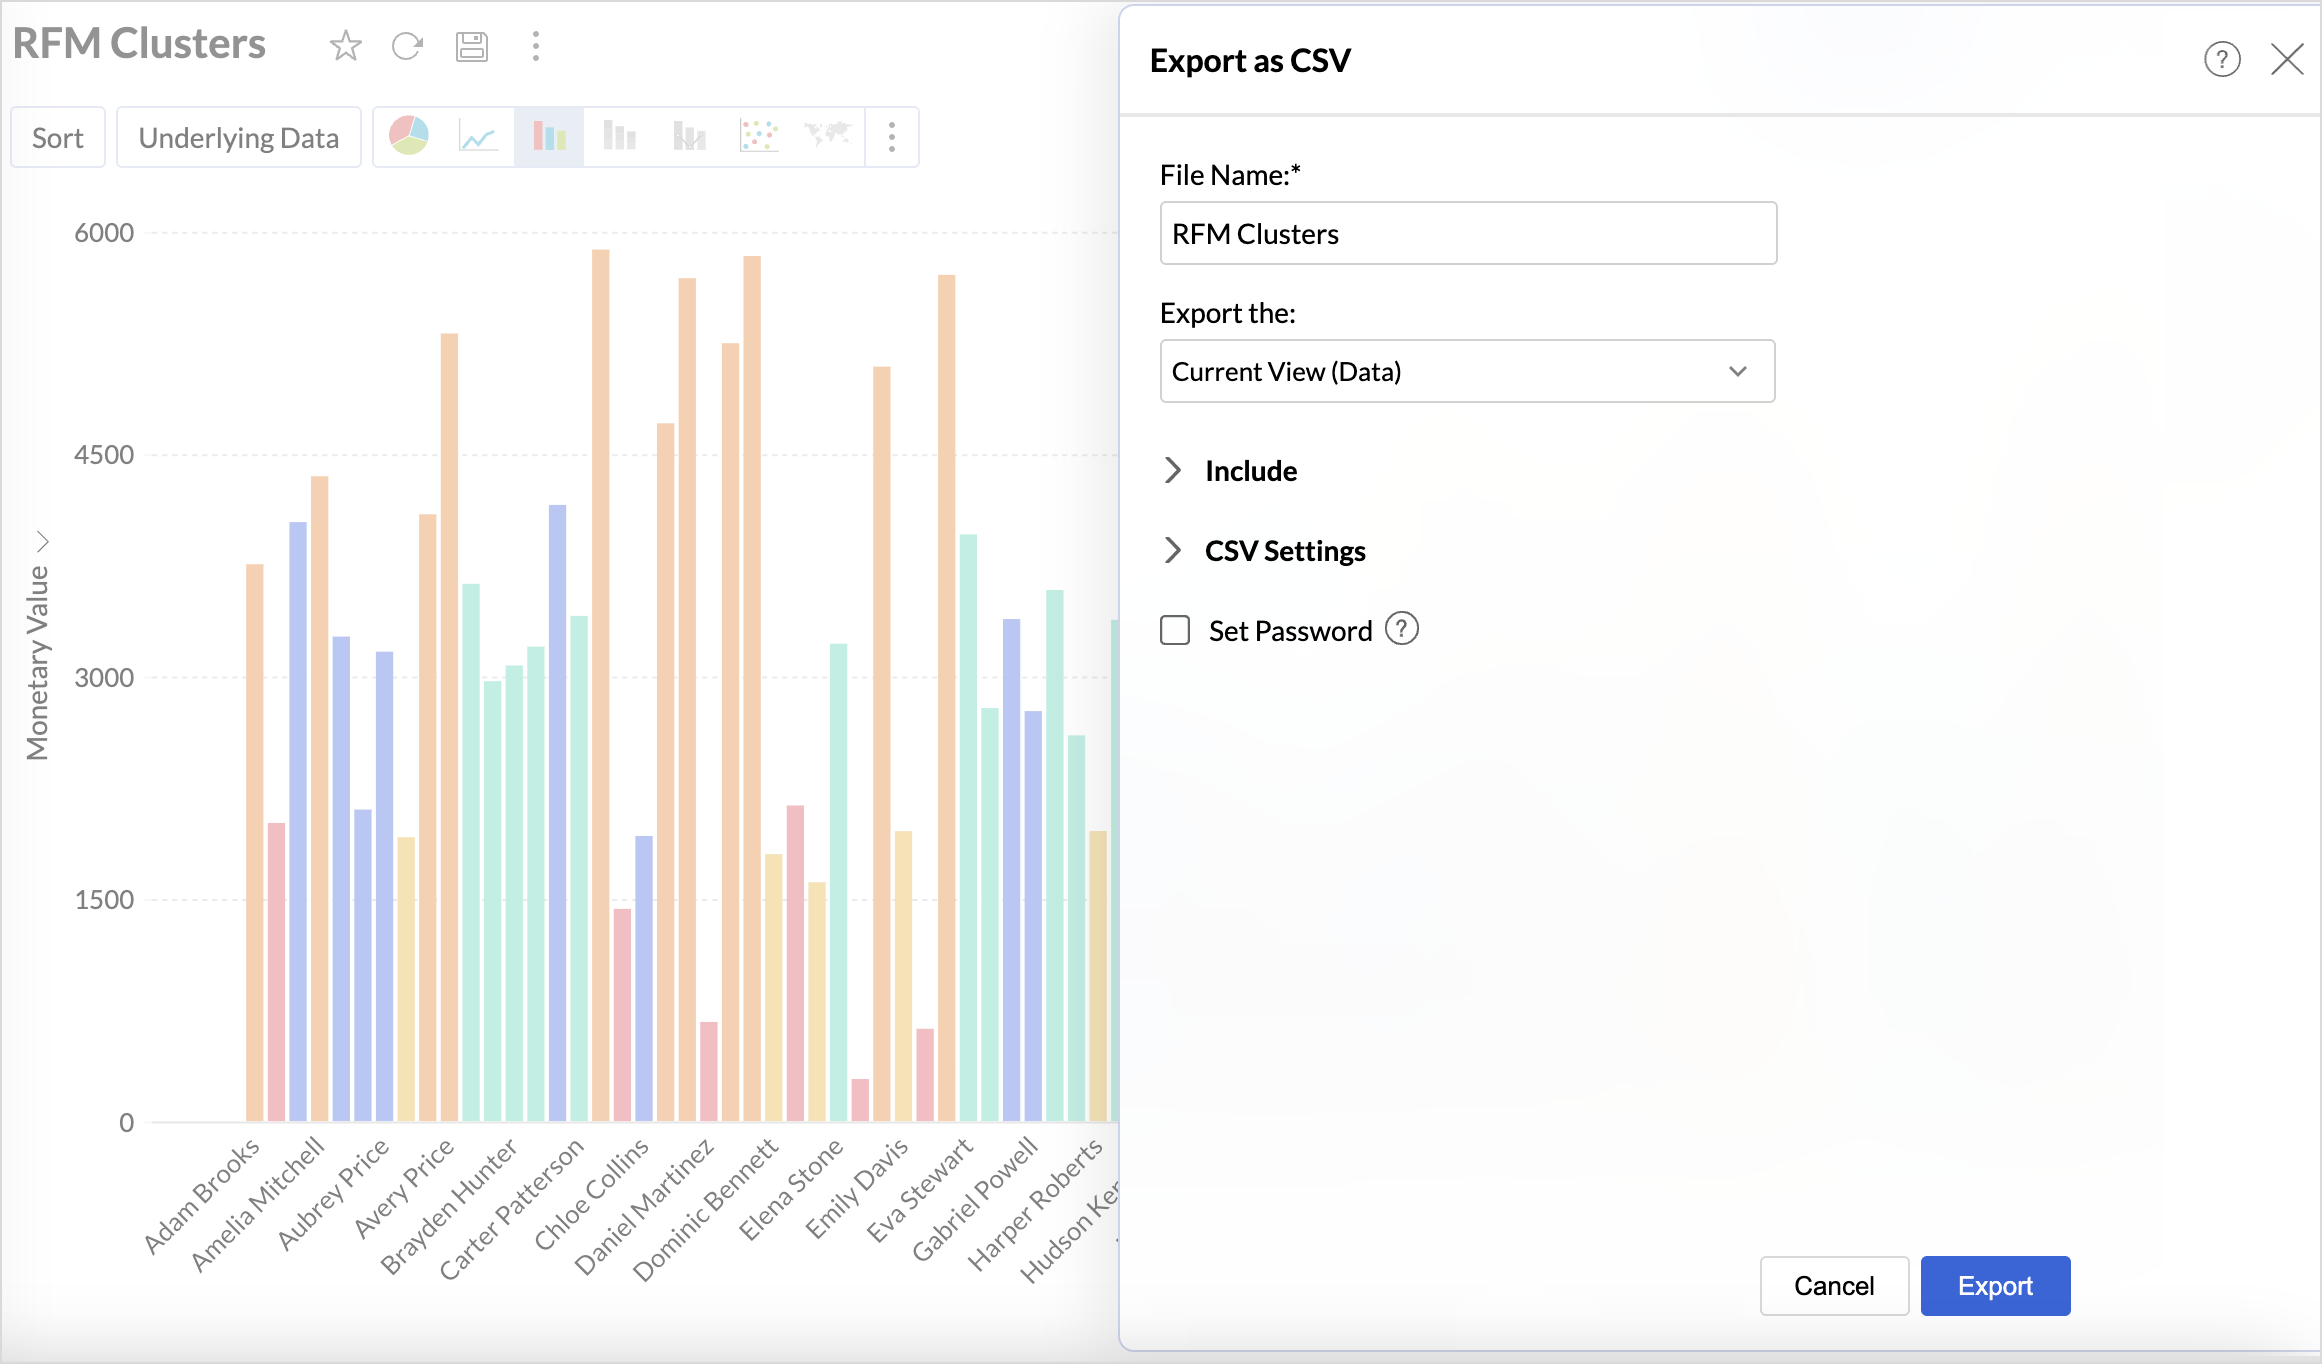
4. Export Clusters Data

Once the customer profiles have been segmented using cluster analysis, Export the Current view in the preferred table format to build more data visualizations to understand the clusters.

Build an RFM Analysis Dashboard

The RFM analysis dashboard provides a comprehensive view of customer behavior. Let's look at the steps involved in building this dashboard.

1. Import the Clusters Data

Import the downloaded clusters table back into Zoho Analytics using the files option as given below.
  1. Click the New icon on the side navigation panel and choose New Table/ Import Data.
  2. Select files and choose the Clusters Table to import and click Next.
  3. A data preview will be displayed; verify the data types of columns and click Create.

2. Create Reports to Understand the Characteristics of the Clusters

While the data is clustered, understanding the characteristics of each cluster is what enables businesses to take strategic actions. This includes identifying which customers need targeted marketing, personalized engagement, or retention efforts. Recognizing patterns within clusters provides insights into customer behavior, which is essential for optimizing marketing campaigns, improving retention strategies, and enhancing customer experience.
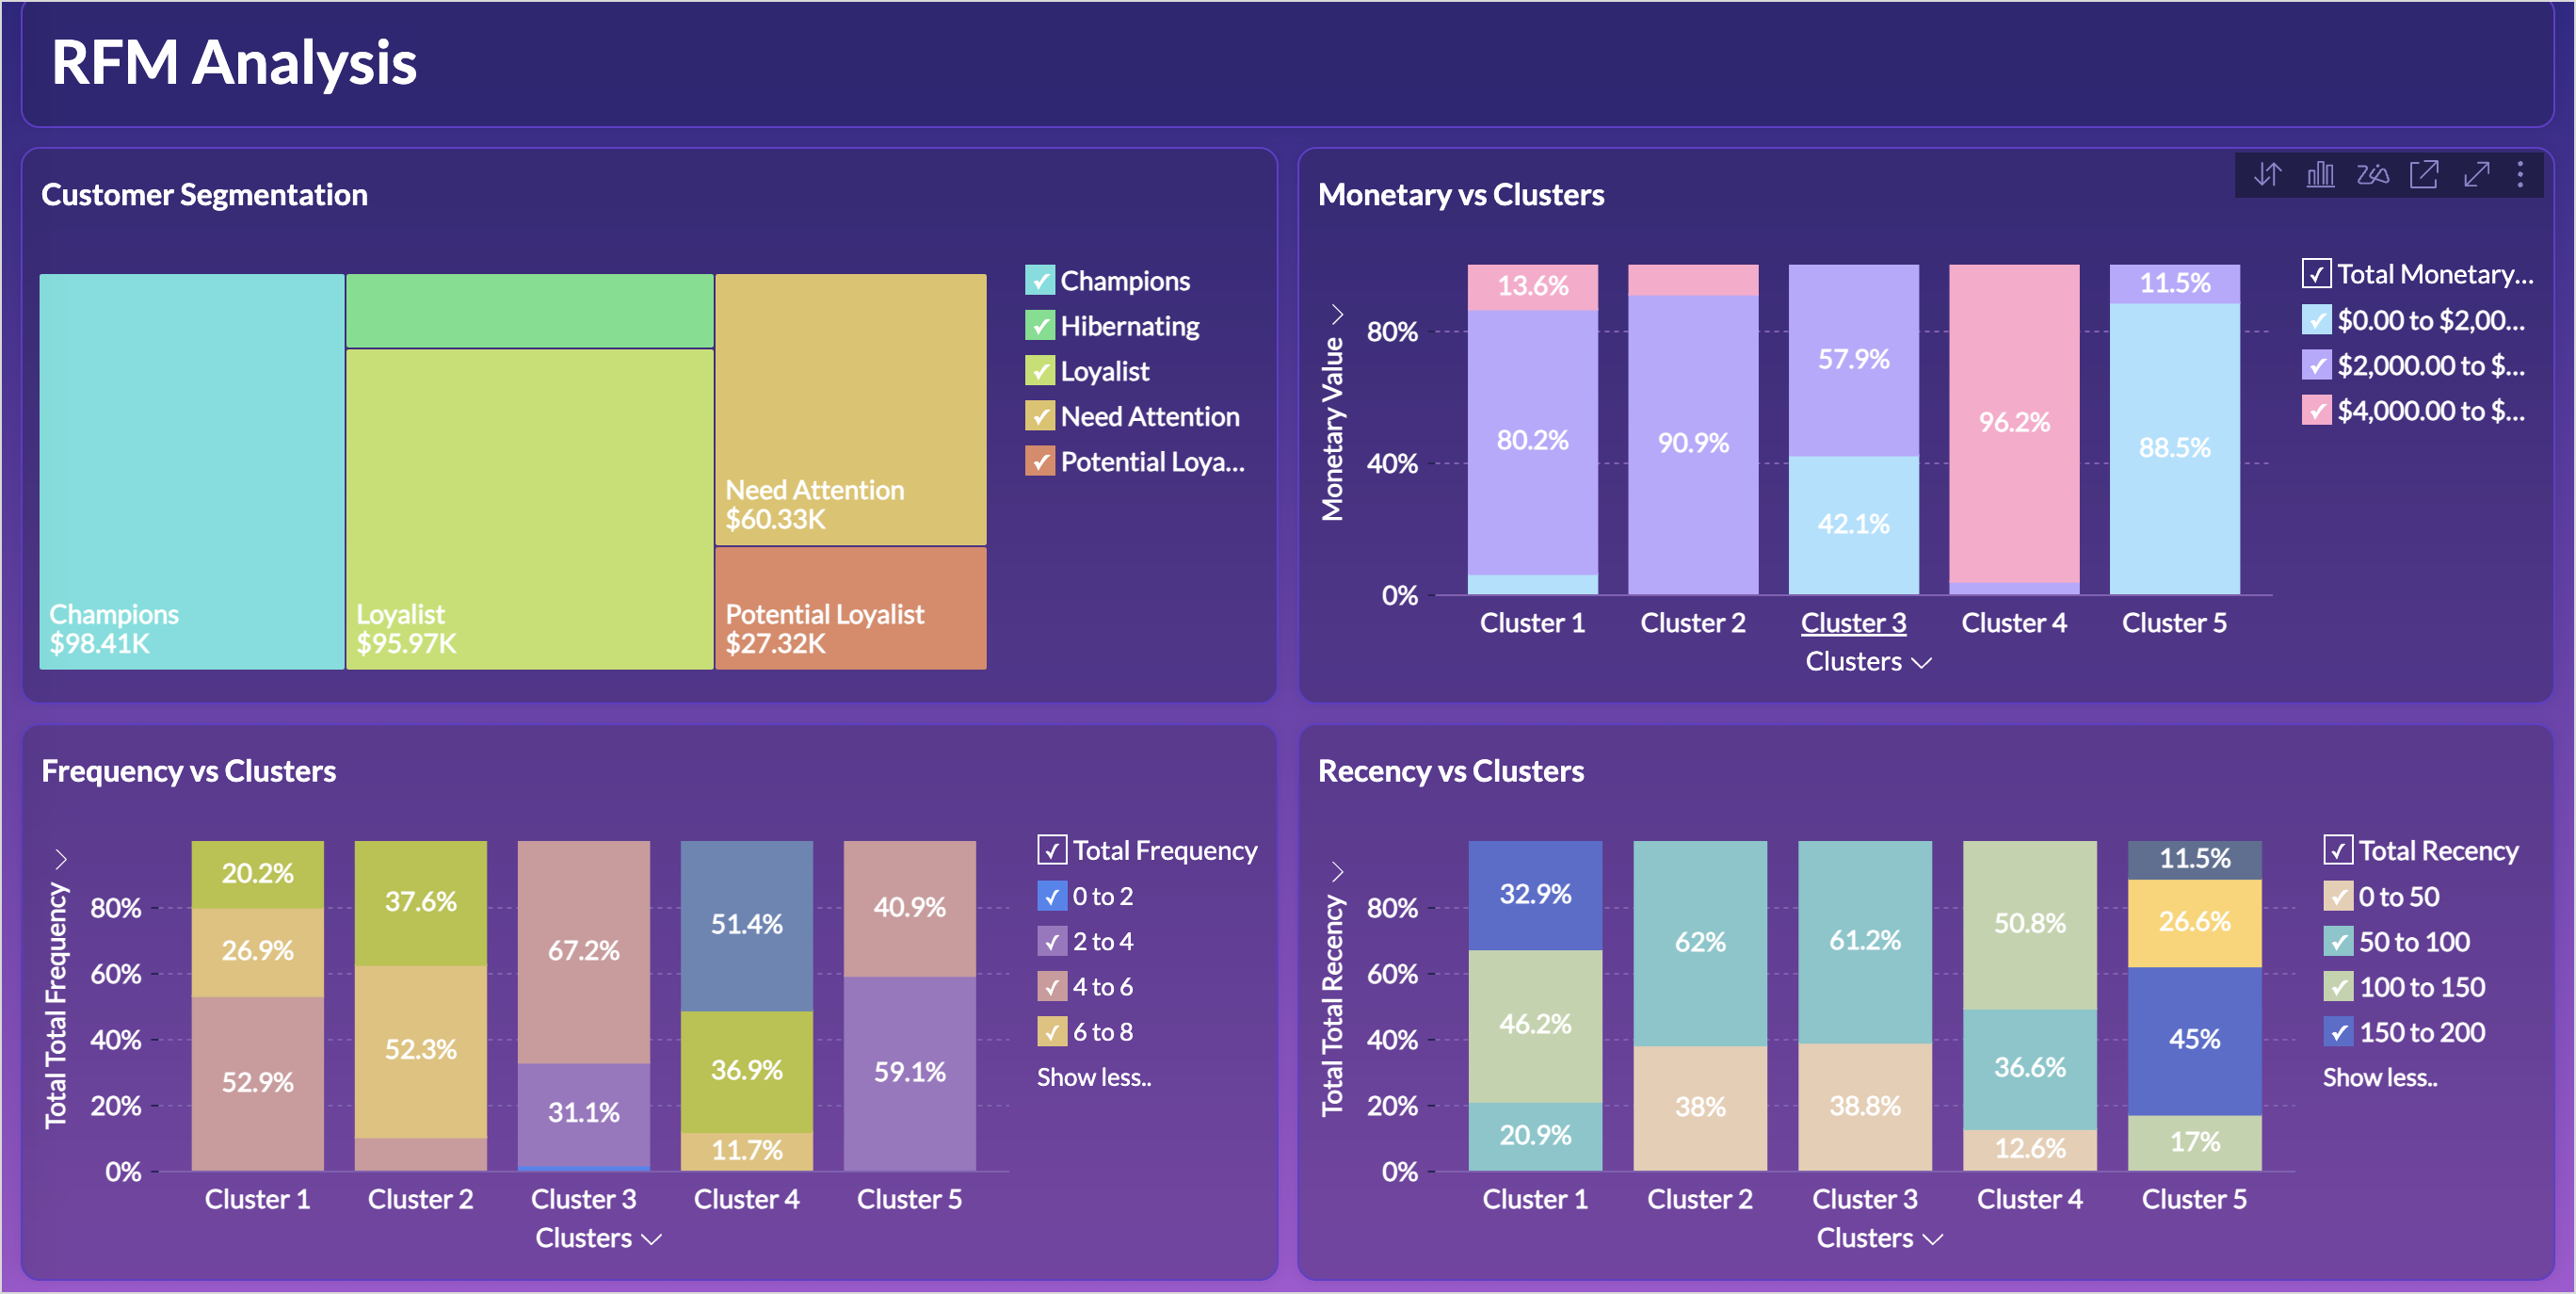
The below reports help understand the distribution of customers across different monetary value, recency and frequency segments within each cluster.

Clusters vs Monetary Value 

  1. Access the cluster table (imported data) and click the new icon > chart view.
  2. Drag and drop the columns as given below:
    1. X-axis - Clusters
    2. Y-axis - Monetary Value with the Count function.
    3. Color - Monetary Value with the Actual Range function.
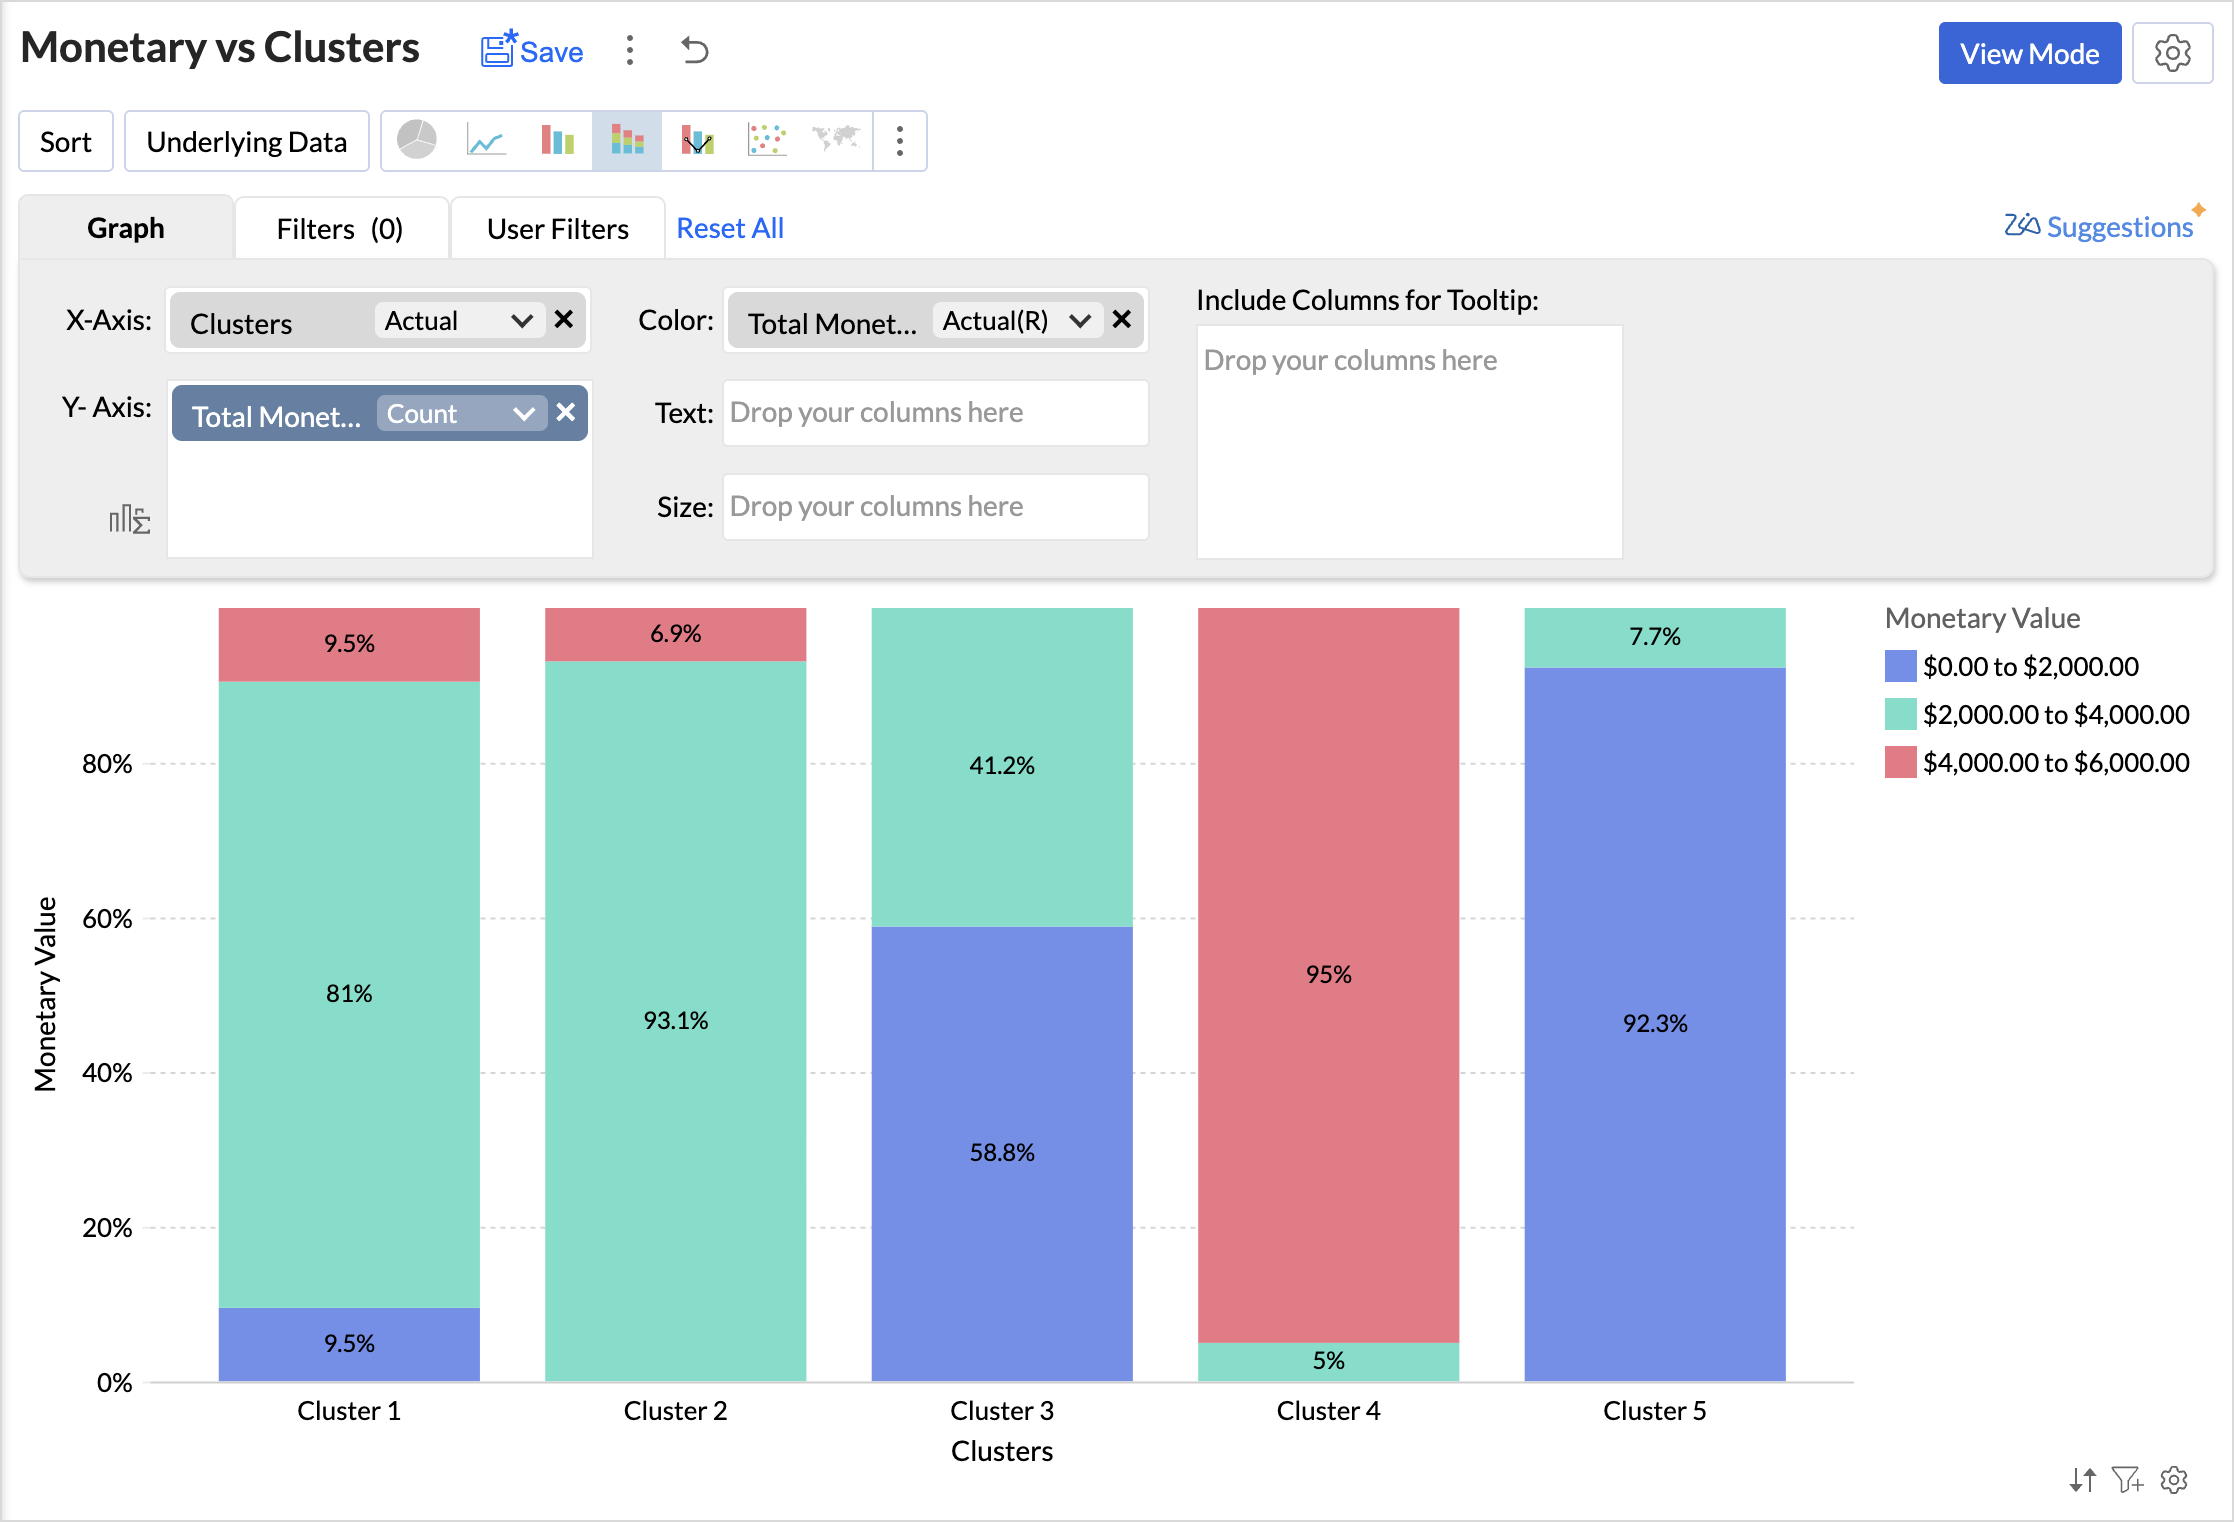
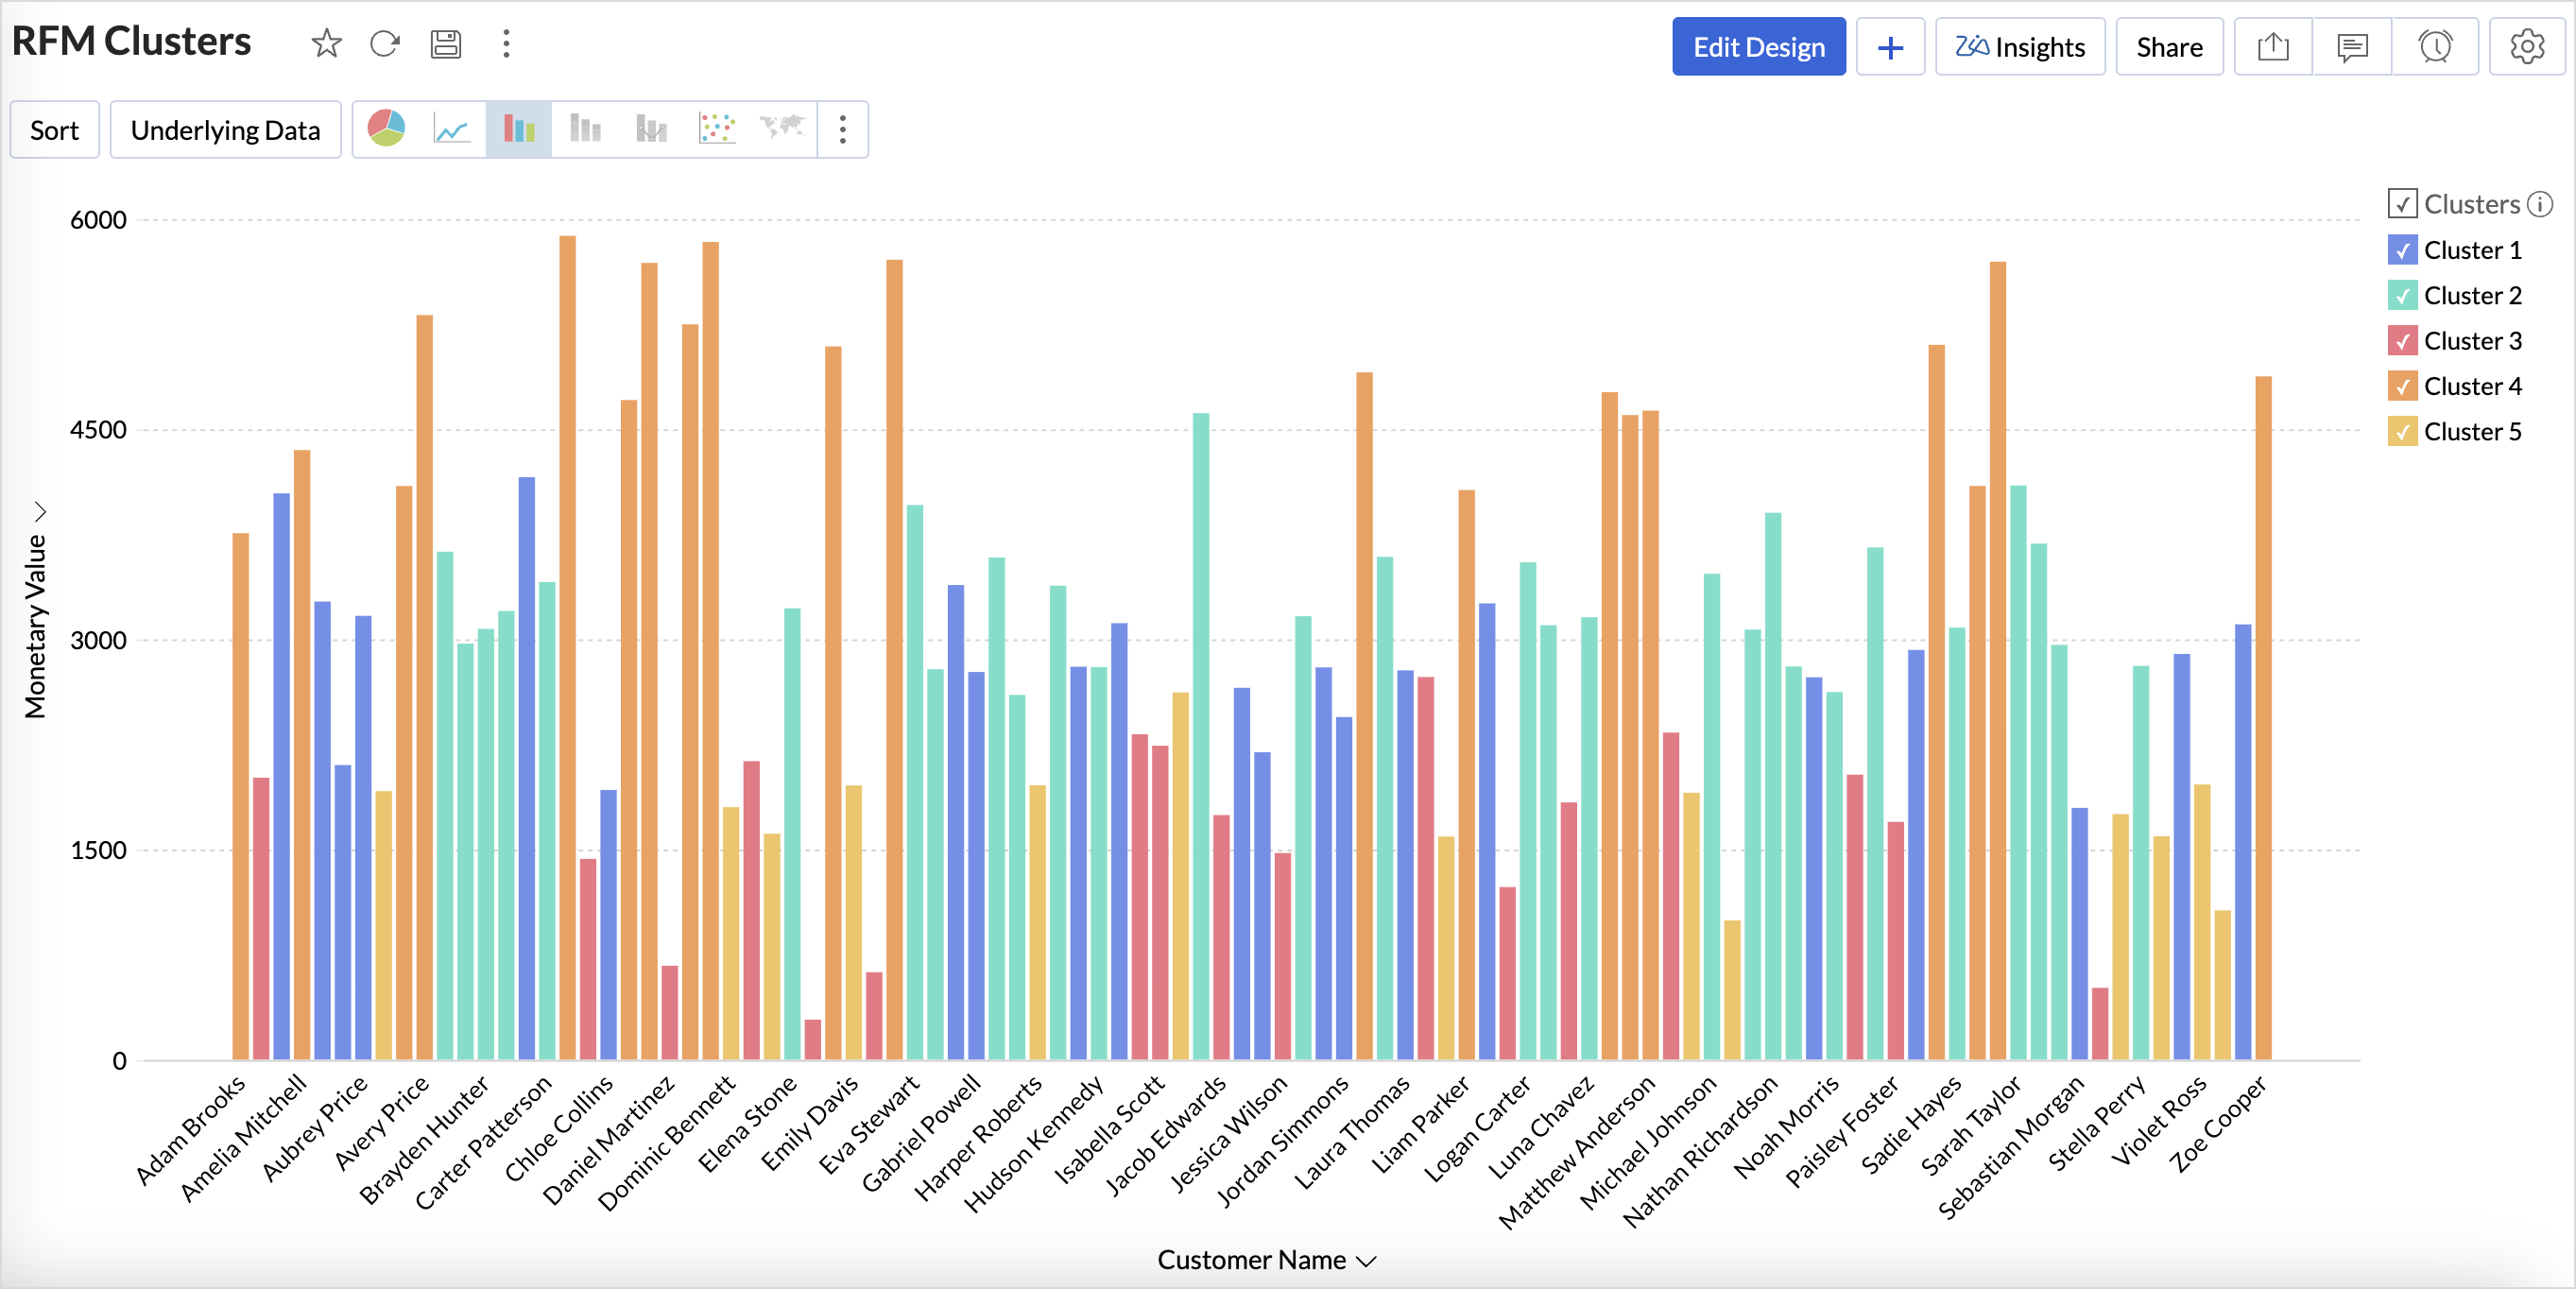
Analyzing the chart, we can infer that,
  • Cluster 1 consists of a diverse group of customers spanning all spending levels.
  • Cluster 2 includes moderate to high spenders who contribute significantly to revenue.
  • Cluster 3 comprises low to mid-range spenders, often occasional buyers.
  • Cluster 4 represents high-value customers with premium spending habits.
  • Cluster 5 consists primarily of low spenders with minimal purchasing activity.
You can similarly create reports to know about the distribution of customers for the Recency and Frequency metrics.

The below table lists the characteristics of clusters

Cluster
Cluster Classification
Recency
Frequency
Monetary
Recommended actions
Cluster 1
Needs Attention
100 to 150 days
Low to Moderate 
 Diverse spending
Re-engagement campaigns, discounts, or reminders to encourage repeat purchases.
Cluster 2
Loyalist
0-50 (Highly Active)
High
Consistent moderate-to-high spenders
Loyalty programs, exclusive deals, early access to new products to maintain engagement.
Cluster 3
Potential Loyalist
0-50 (Active)
Low to Moderate  Budget-conscious, occasional buyers Cross-selling, personalized recommendations, and value-based promotions.
Cluster 4
Champions
100-150 (Inactive)
Moderate to High (Frequent buyers)
High spenders
VIP experiences, personalized services, and premium offers to retain and enhance their spending.
Cluster 5
Hibernating
Mostly inactive or infrequent
Low
Minimal spending
Win-back campaigns, incentives, special discounts, and targeted ads to regain interest.


Based on the above table, you can give specific labels to the clusters using the bucket columns option.

RFM Dashboard

Limitations & Considerations of RFM Analysis

While RFM analysis is a powerful customer segmentation tool, businesses should be aware of certain limitations and factors that can influence results:

  • Data Freshness and Relevance: RFM analysis relies on transactional data, making the freshness and relevance of this data crucial for accurate customer segmentation. Setting up automated data imports ensures real-time updates, reducing the risk of working with stale data.
  • Seasonal Variations: Customer purchasing behavior often fluctuates due to seasonal trends, holidays, and industry-specific cycles, which can impact RFM scores and lead to misleading segmentation if not accounted for properly. Instead of analyzing only recent months, compare customer behavior for the same period in previous years to detect true engagement patterns.
    • Sticky Posts

    • What's New in Zoho Analytics - February 2026

      Hello Users! We're back with another round of updates for Zoho Analytics. This month's release focuses on giving you greater flexibility in how you visualize, manage, and act on your data - with new features like custom visualizations, remote MCP server,
    • What's New in Zoho Analytics - January 2026

      Hello Users! We are starting the year with a strong lineup of updates, marking the beginning of many improvements planned to enhance your analytics experience. Explore the latest improvements built to boost performance, simplify analysis, and help you
    • What's New in Zoho Analytics - November 2025

      We're thrilled to announce a significant update focused on expanding your data connectivity, enhancing visualization capabilities, and delivering a more powerful, intuitive, and performant analytics experience. Here’s a look at what’s new. Explore What's
    • What's New in Zoho Analytics - October 2025

      Hello Users! We're are back with a fresh set of updates and enhancements to make data analysis faster and more insightful. Take a quick look at what’s new and see how these updates can power up your reports and dashboards. Explore What's New! Extreme
    • What’s New in Zoho Analytics – September 2025

      Hello Users!! In this month’s update, we’re raising the bar across multiple touchpoints, from how you bring in data, plan and track projects to how you design and brand your dashboards. We’ve added the all-new Gantt chart for project visualization, expanded

    Nederlandse Hulpbronnen


      • Recent Topics

      • How to create a directory report from one-to-many relationship

        Hi all, Newbie here. I'm converting an Access DB to Creator. I've learned Forms are tables and Reports are used to edit table rows, not Forms. I've got the data loaded and can maintain it with the Reports already done. I've done filtering and sorting,
      • SalesIQ Email Delivery Issues to Microsoft

        Is anyone else having delivery issues to Hotmail, Outlook, and Live inboxes when sending transcripts and replies via email from SalesIQ? We’ve detected that emails sent from SalesIQ to these accounts aren't arriving—they don’t even bounce back; they simply
      • No Ability to Rename Record Template PDFs in SendMail Task

        As highlighted previously in this post, we still have to deal with the limitation of not being able to rename a record template when sent as a PDF using the SendMail Task. This creates unnecessary complexity for what should be a simple operation, and
      • Moving Project Task to other parent not possible

        We are trying to move an existing Zoho Projects task to a different parent task via API. Example: Task ID: 289214000001385113 Current parent: 289214000001281044 New parent: 289214000001281045 We tested updating the task with: taskParam.put("parent_task_id",
      • Best sales insights for target accounts?

        Question for all the sales power-users out there: I would like to gain insights from Zoho CRM for a rotating list of target accounts. Each Outside Salesperson has 5 target accounts, and they can change these targets quarterly with management approval.
      • Remove or hide default views

        I'm looking to only have the views pertinent to my organization. Is there a way to show only my custom views (or separate them to a different area or something)? If not, this should be a feature as switching from Zendesk we had this option...
      • Insert Template not inserting

        I have been using the "Insert Template" feature for years and I use it every single working day. Yesterday it was working fine. Today, on two different browsers (Chrome and Edge), I can select "Insert Template", select the template I want to insert, but
      • Add more than 7 sender addresses in campaigns

        I need to add at least 15 sender email addresses but am currently limited to 7. Please can you increase. Thank you
      • Email sent to Hotmail arrives to Spam

        I'm sending email tests to my Hotmail account and they arrives to the Spam folder all the time. My domain has been verified correctly. How can I fix it?
      • Hotmail

        I am sending an email to a hotmail, and this guy does not receive the email, either in his SPAM nor inbox. Can you help me? thanks!
      • Meeting integration with Otter.ai

        Would love for an integration with an AI transcription service like Otter.ai to be integrated with Zoho Meeting. Thanks
      • Let’s Talk Recruit: Your pipeline is full. So why aren’t roles closing?

        Welcome back to Let’s Talk Recruit, where we break down hiring workflows into simple, actionable insights for recruiters. The focus this month is on what slows down your pipeline even when everything looks like it’s working. Picture this. You log in to
      • Search through email contents

        Is there a way to search through the email history of a lead? Meaning if among the 50 emails to a lead about different topics I want to find all the ones with the word "pizza" in the body of the email, is that possible? Thanks for your help, Hanan
      • Marketing Tip #9: Track your traffic sources

        Not all marketing channels work equally well. Knowing whether your visitors come from Google, Instagram, or email helps you focus on what actually drives sales. Try this today: Check your Zoho Commerce reports or connect Zoho PageSense to see your top
      • It Really Can Be This Simple

        Let's be honest.... Running a business already comes with enough moving parts. Invoices, payments, follow-ups, reminders, tracking who paid and who disappeared. It can slowly turn into a full-time admin job on its own, especially when you are a Sole Proprietor,
      • Huge confusion in zoho crm and zoho analytics

        Context => We have reporting based hierarchy in zoho crm and basically there will be one sales head and couple sales managers and 10 pre sales excutives divided between 2 sales managers we have maintained that in zoho crm and there is complex reporting
      • Zoho Books | Product updates | May 2026

        Hello users, We're back with the latest updates and enhancements we've rolled out in Zoho Books. From sales tax automation to scanning receipts for free, explore the updates designed to upgrade your bookkeeping experience. Sales Tax Automation [US & Canada
      • Update: [Issue fixed] Temporary access issue on Android and iOS devices

        Hello, Zoho Sheet users! We're aware that some of you are currently unable to open spreadsheet files from your Android and iOS devices. We extend our sincere apologies for the inconvenience caused. We're working on fixing the issue with highest priority
      • Action Required: Migrate Your SQL Server Connection

        Dear Users, Following our earlier communication on the upcoming Zoho Analytics security updates affecting Microsoft SQL Server connections, we have revised our recommended approach. The previously shared cipher suite configuration is no longer the recommended
      • Currency Change for Companies

        Hello FSM Team, We would like your assistance in changing the company currency for our UAE organization from AED to USD. Currently, all customers and users are configured with AED currency settings, and we would like to standardize the organization currency
      • Accrual Data - Zoho Books API

        Hi Team, When we integrate Zoho Books with Zoho Analytics, we usually receive a consolidated dataset called “Accrual Transactions,” which contains all types of transaction data. Could you please confirm whether it is possible to retrieve this same data
      • Bank Fees - Allow User to Choose Expense Account

        Bank fees from Customer Payments can only be debited against the system Bank Fees account due to hard-coding. The user should be able to select which expense account those fees are debited against. The use case is pretty straightforward. A business like
      • Showing Cost Price and Profit Margin in PDF

        Hi there, We use two different types of quotes in our company. One is a version for our clients that does not include cost or profit margin information, and the other is for our internal team that includes profit margin and cost. We are running into an
      • Side bar menu

        It would be great if you could stop the auto collapse of expanded menus when selecting a different module. It would save a lot of mouse clicks for a lot of users that frequently switch between sales & purchases as we do, it's easier to collapse them manually when not required !
      • Syncing zoho books into zoho crm

        I was wondering how I can use zoho books in crm as I have been using them separately and would like to sync the two. Is this possible and if so, how? Thanks
      • Remove horizontal scroll bar

        Is there any way to remove or hide the horizontal scroll bars on the iframe reports? I removed columns, but it still stays there.
      • Rich Text Type Format for Notes Field

        Has it been discussed or is there a way to insert a table in the notes field? We sometimes receive information in a table format, and it would be beneficial to have it in the same format as a note on a record. Moderation Update (12-May-26): We are working
      • Multiple Blueprints on different fields at the same time.

        It looks only 1 Blueprint can run at the same time, it makes sense for many Blueprints on the same field (Eg. Stage). But what about multiple Blueprints on "different" fields? the multiple options must be available. (Eg. Stage, Documents Status, Contract
      • Updating Sales orders on hold

        Surely updating irrelevant fields such as shipping date should be allowed when sales orders are awaiting back orders? Maybe the PO is going to be late arriving so we have to change the shipment date of the Sales order ! Not even allowed through the api - {"code":36014,"message":"Sales orders that have been shipped or on hold cannot be updated."}
      • sales IQ issue on website

        i integrated the zoho sales IQ code on the website but it is comming in distroted form i am sharing the screenshot below the website is bulit in wix platform
      • Contract to payment flow

        Hi everyone, I’m trying to set up a contract-to-payment flow and want to avoid duplicating invoices or customers in Zoho Books. The flow should be: contract generated from CRM, sent via Zoho Sign, client signs, deposit is paid, and the invoice should
      • Automated entries past the current month in a calendar report

        Hi all, I have an automation problem. I have a form which on successfull entry adds either 5 or 10 more of these entries with a slight change so our customers can see it throug a calendar report on the webiste. The entry put in manually shows up perfectly
      • Linking Contacts to Other Modules

        In creator, I've got a Contacts page with a lookup that searches Suppliers. Is there a way to have the contacts attached to the Suppliers modular as a list automatically, similar to the CRM version? It goes the other way. If I entered an Employee in the
      • Multiple Pipelines

        Is it possible to create multiple candidate pipelines?
      • Automation #7 - Auto-update Email Content to a Ticket

        This is a monthly series where we pick some common use cases that have been either discussed or most asked about in our community and explain how they can be achieved using one of the automation capabilities in Zoho Desk. Email is one of the most commonly
      • Introducing Custom Columns in Forecasts in Zoho CRM

        Release Plan: Enabling in Phased Manner, Enabled for JP DC Hello all, Forecasts in Zoho CRM help sales representatives, managers, and business stakeholders evaluate performance and plan future sales activities. While standard metrics such as Target, Achieved
      • How would you handle Warranty replacement parts or items in zoho inventory

        Hi everyone, I'm working on setting up zoho inventory for our distribution business.  We handle the service for our customers and will replace items that malfunction under a warranty basis.  Does anyone else do this and how do you set it up in inventory?  Do you have to create a sales order and if you want to the original item back, do you use a RMA?  If so, how is it done so there isn't a credit memo associated with it? Thanks, Tim
      • Atlassian Jira integration live in Zoho Apptics

        Tracking crashes and fixing them often happen with different tools. You might use Zoho Apptics to track crashes and understand what went wrong and Jira to resolve those issues. If you use both, you're probably familiar with the manual effort involved
      • What's New in Zoho Billing | January 2026

        Excited about the latest enhancements in Zoho Billing? Our January updates bring an intelligent AI assistant, smarter subscription management, and improved tax compliance, saving you time and reducing manual work. Dive into the details below to see how
      • Auto-sync field of lookup value

        This feature has been requested many times in the discussion Field of Lookup Announcement and this post aims to track it separately. At the moment the value of a 'field of lookup' is a snapshot but once the parent lookup field is updated the values diverge.
      • Next Page