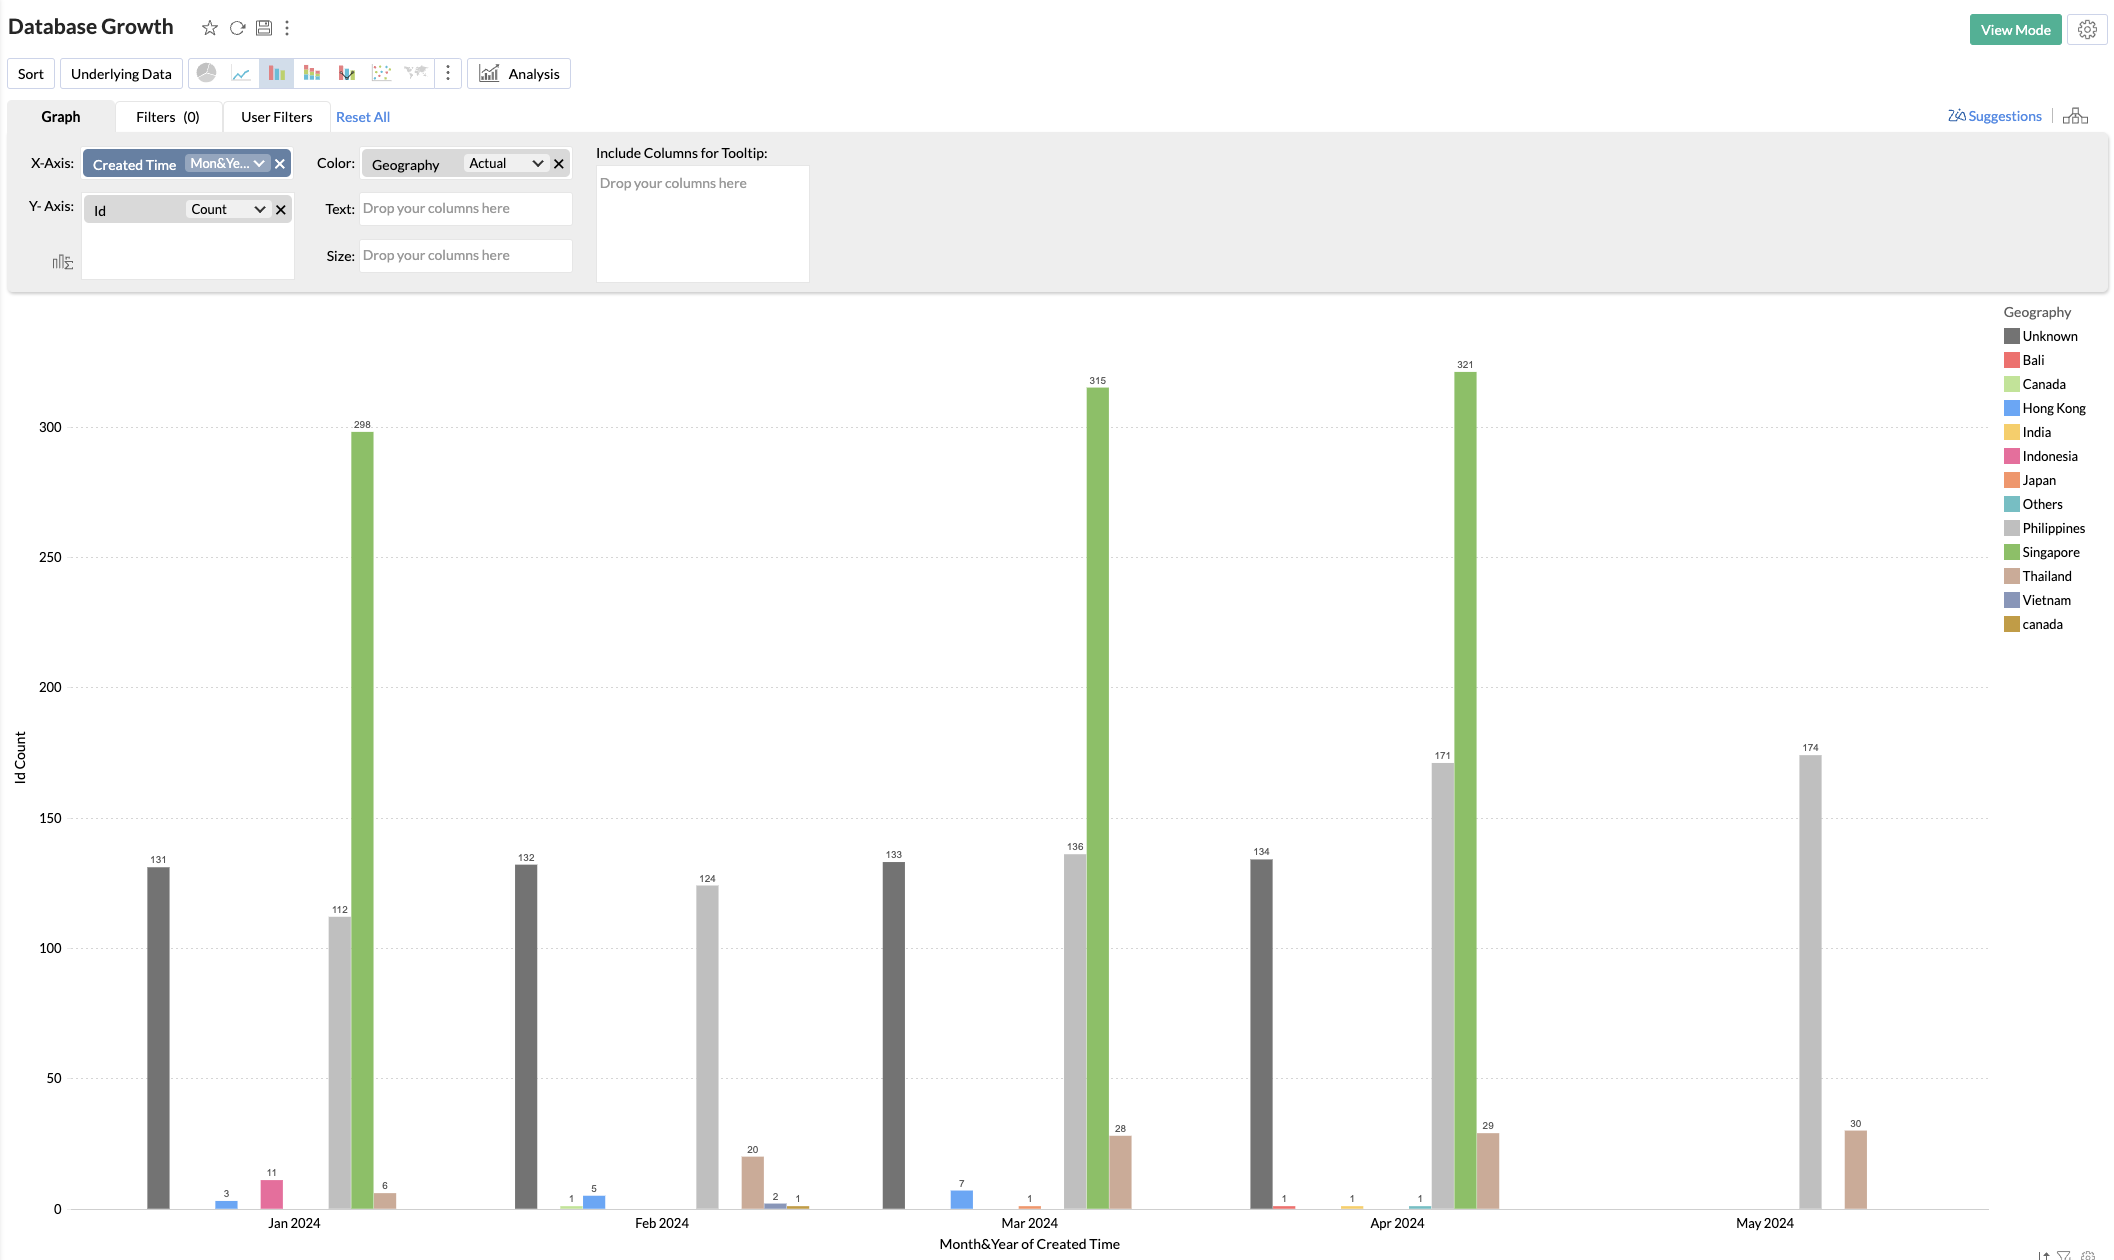
Chart showing the running total per Geography per month
I want to create a chart in Zoho Analytics that displays the running total of the growth of the leads per month in 2024, grouped by Geography. However, I only seem to be getting the number of leads per geography that were added per month, not the total number of leads per geography in total.
Can anyone help me with my configuration?