Introducing advanced statistics for all your social media posts
When you're publishing on social media, it's important to understand how the audience engages with your content. This insight helps you come up with ideas for different types of content and also identify the social media channel that's most effective for your business.
In Zoho Social, you have in-depth reports to help you understand performance across all social media channels. Apart from that, you can also view statistics for individual posts from the Post Stats tab.
Here, we've included numerous in-depth metrics that give you a complete picture on the performance of your post.
Below is the list of all the data that's available for your post, grouped by social media channel.
Facebook
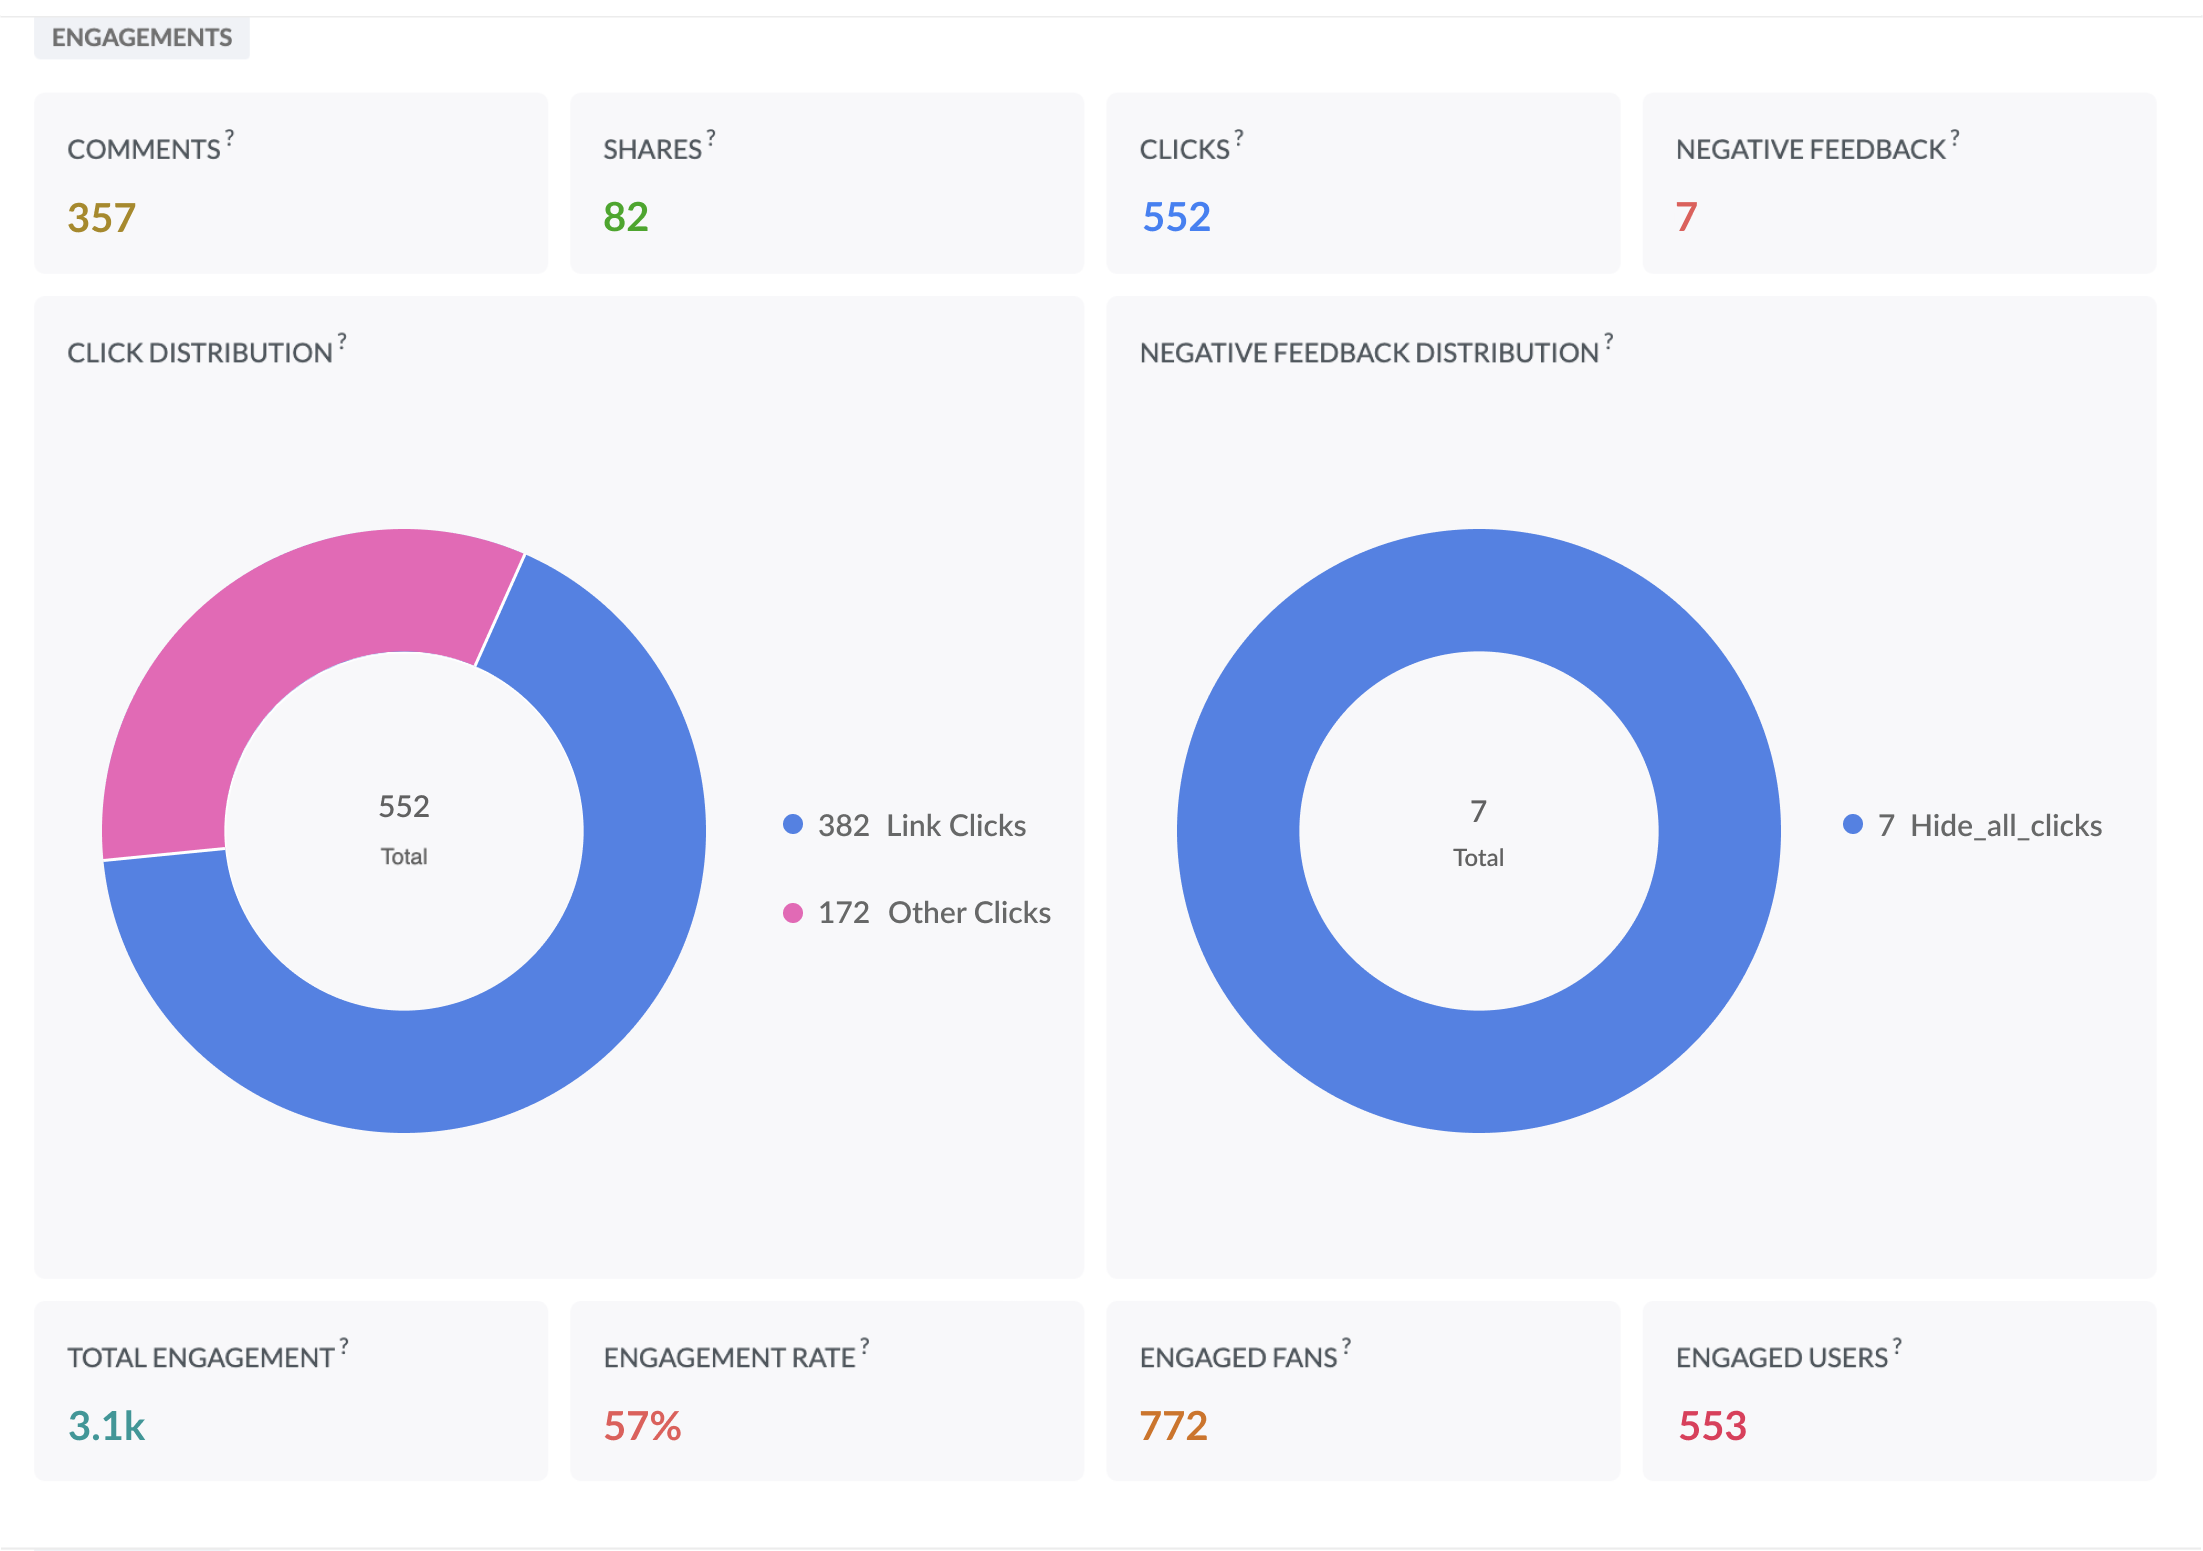
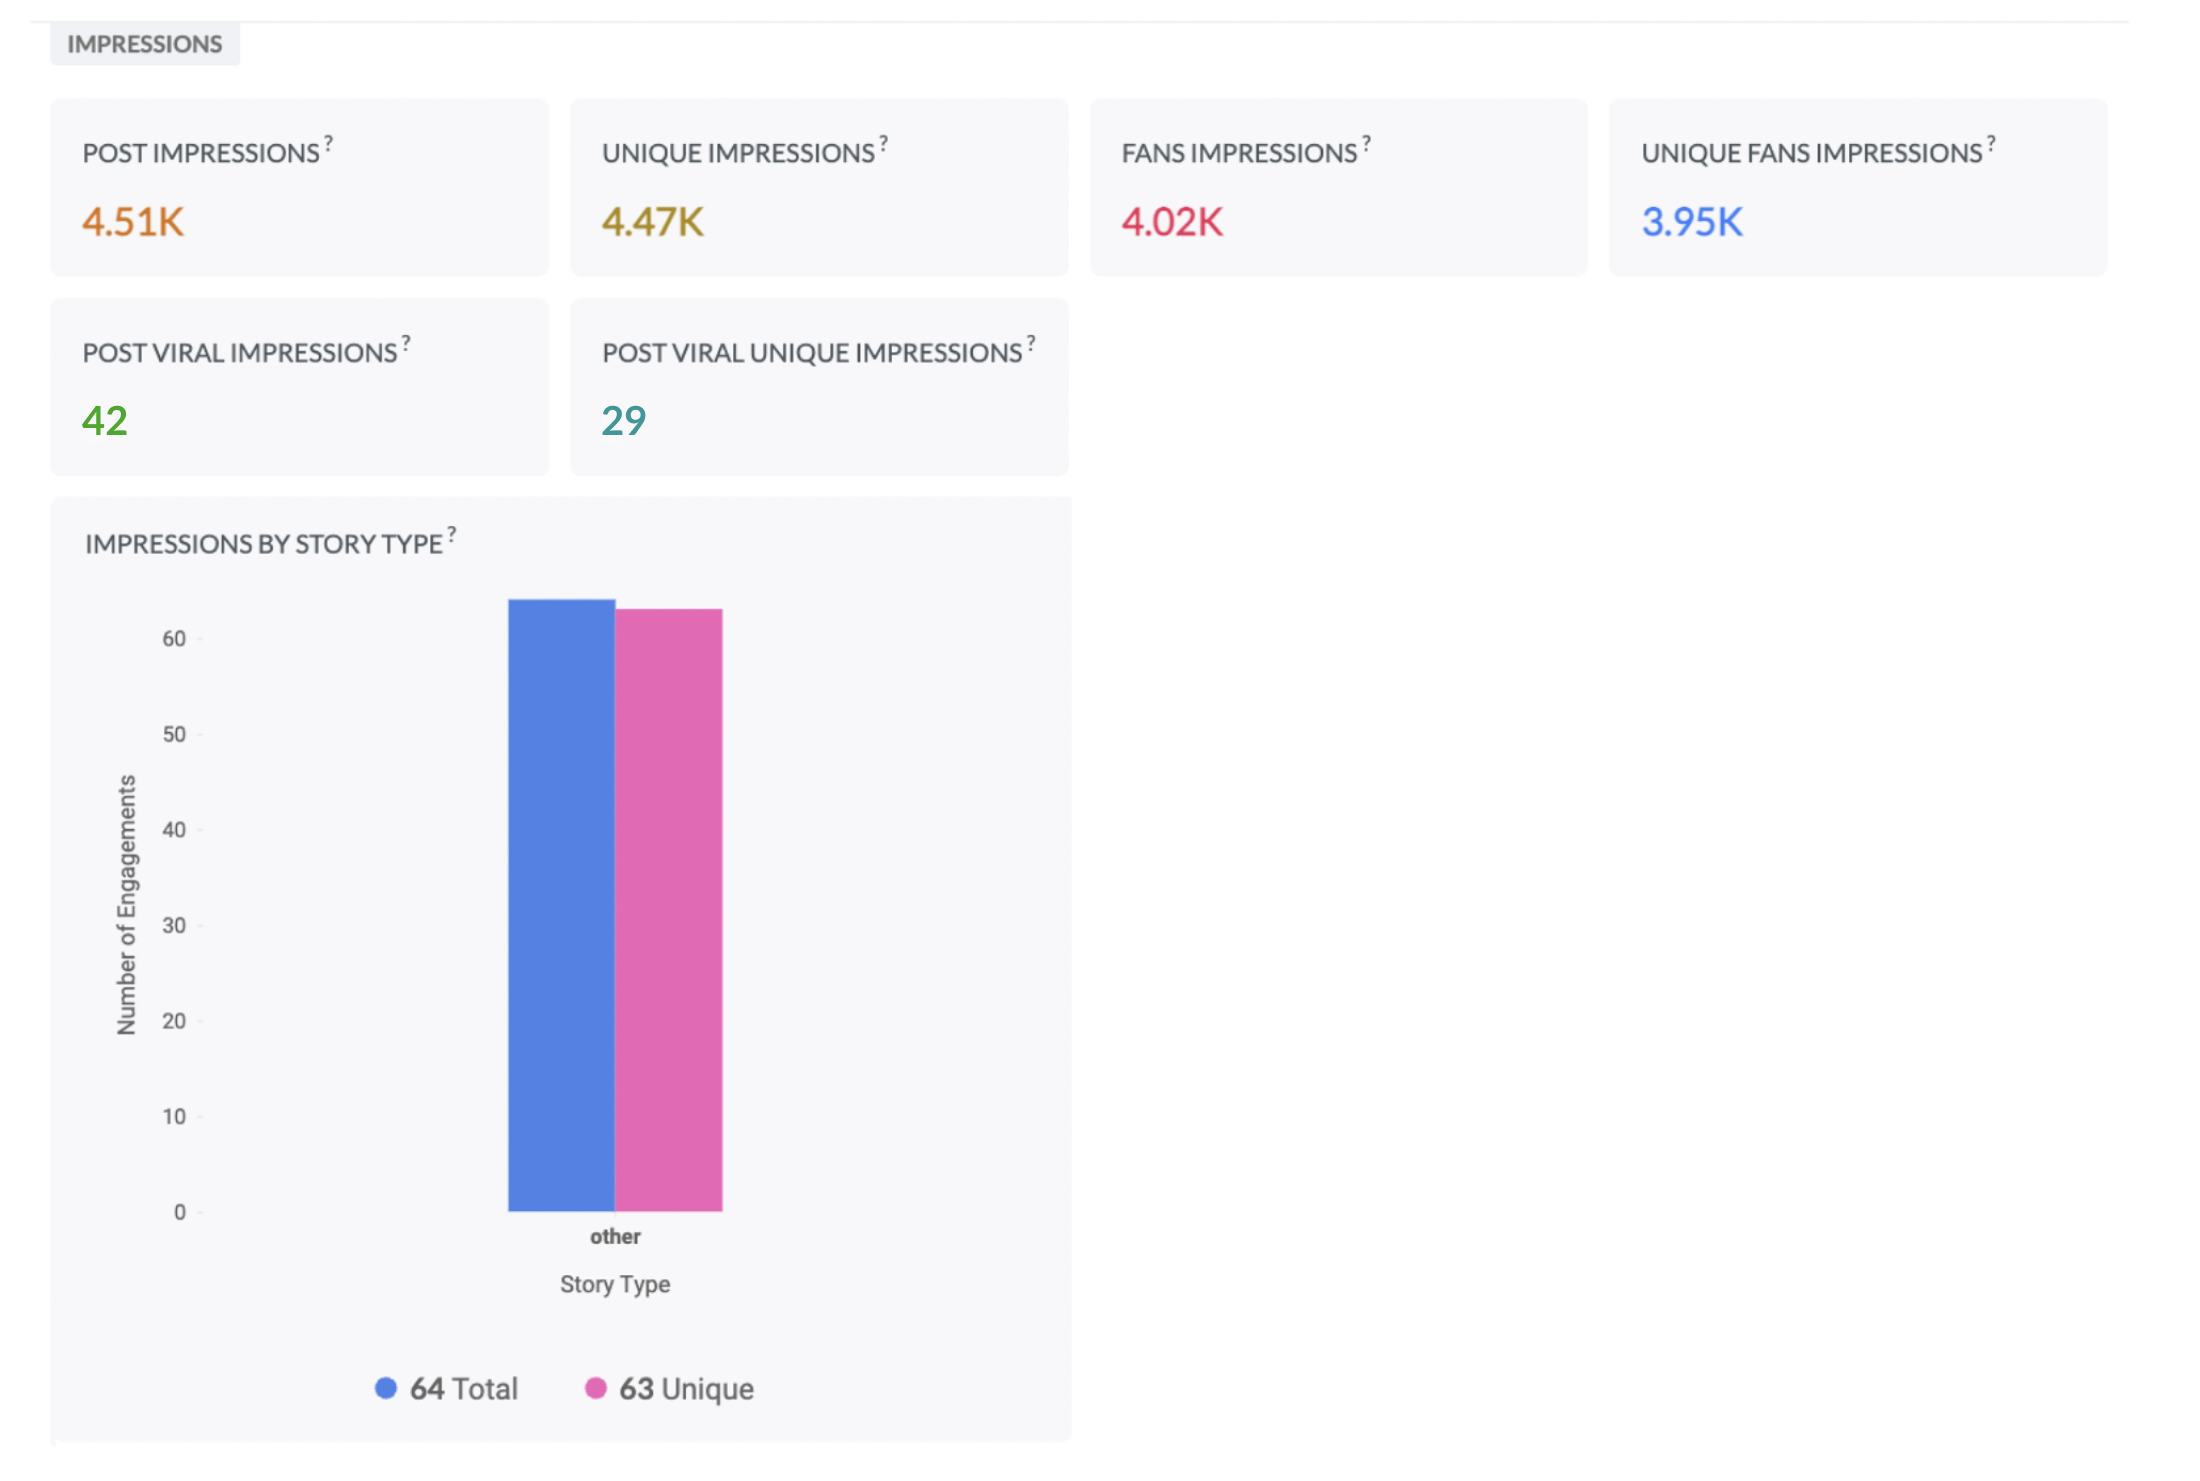
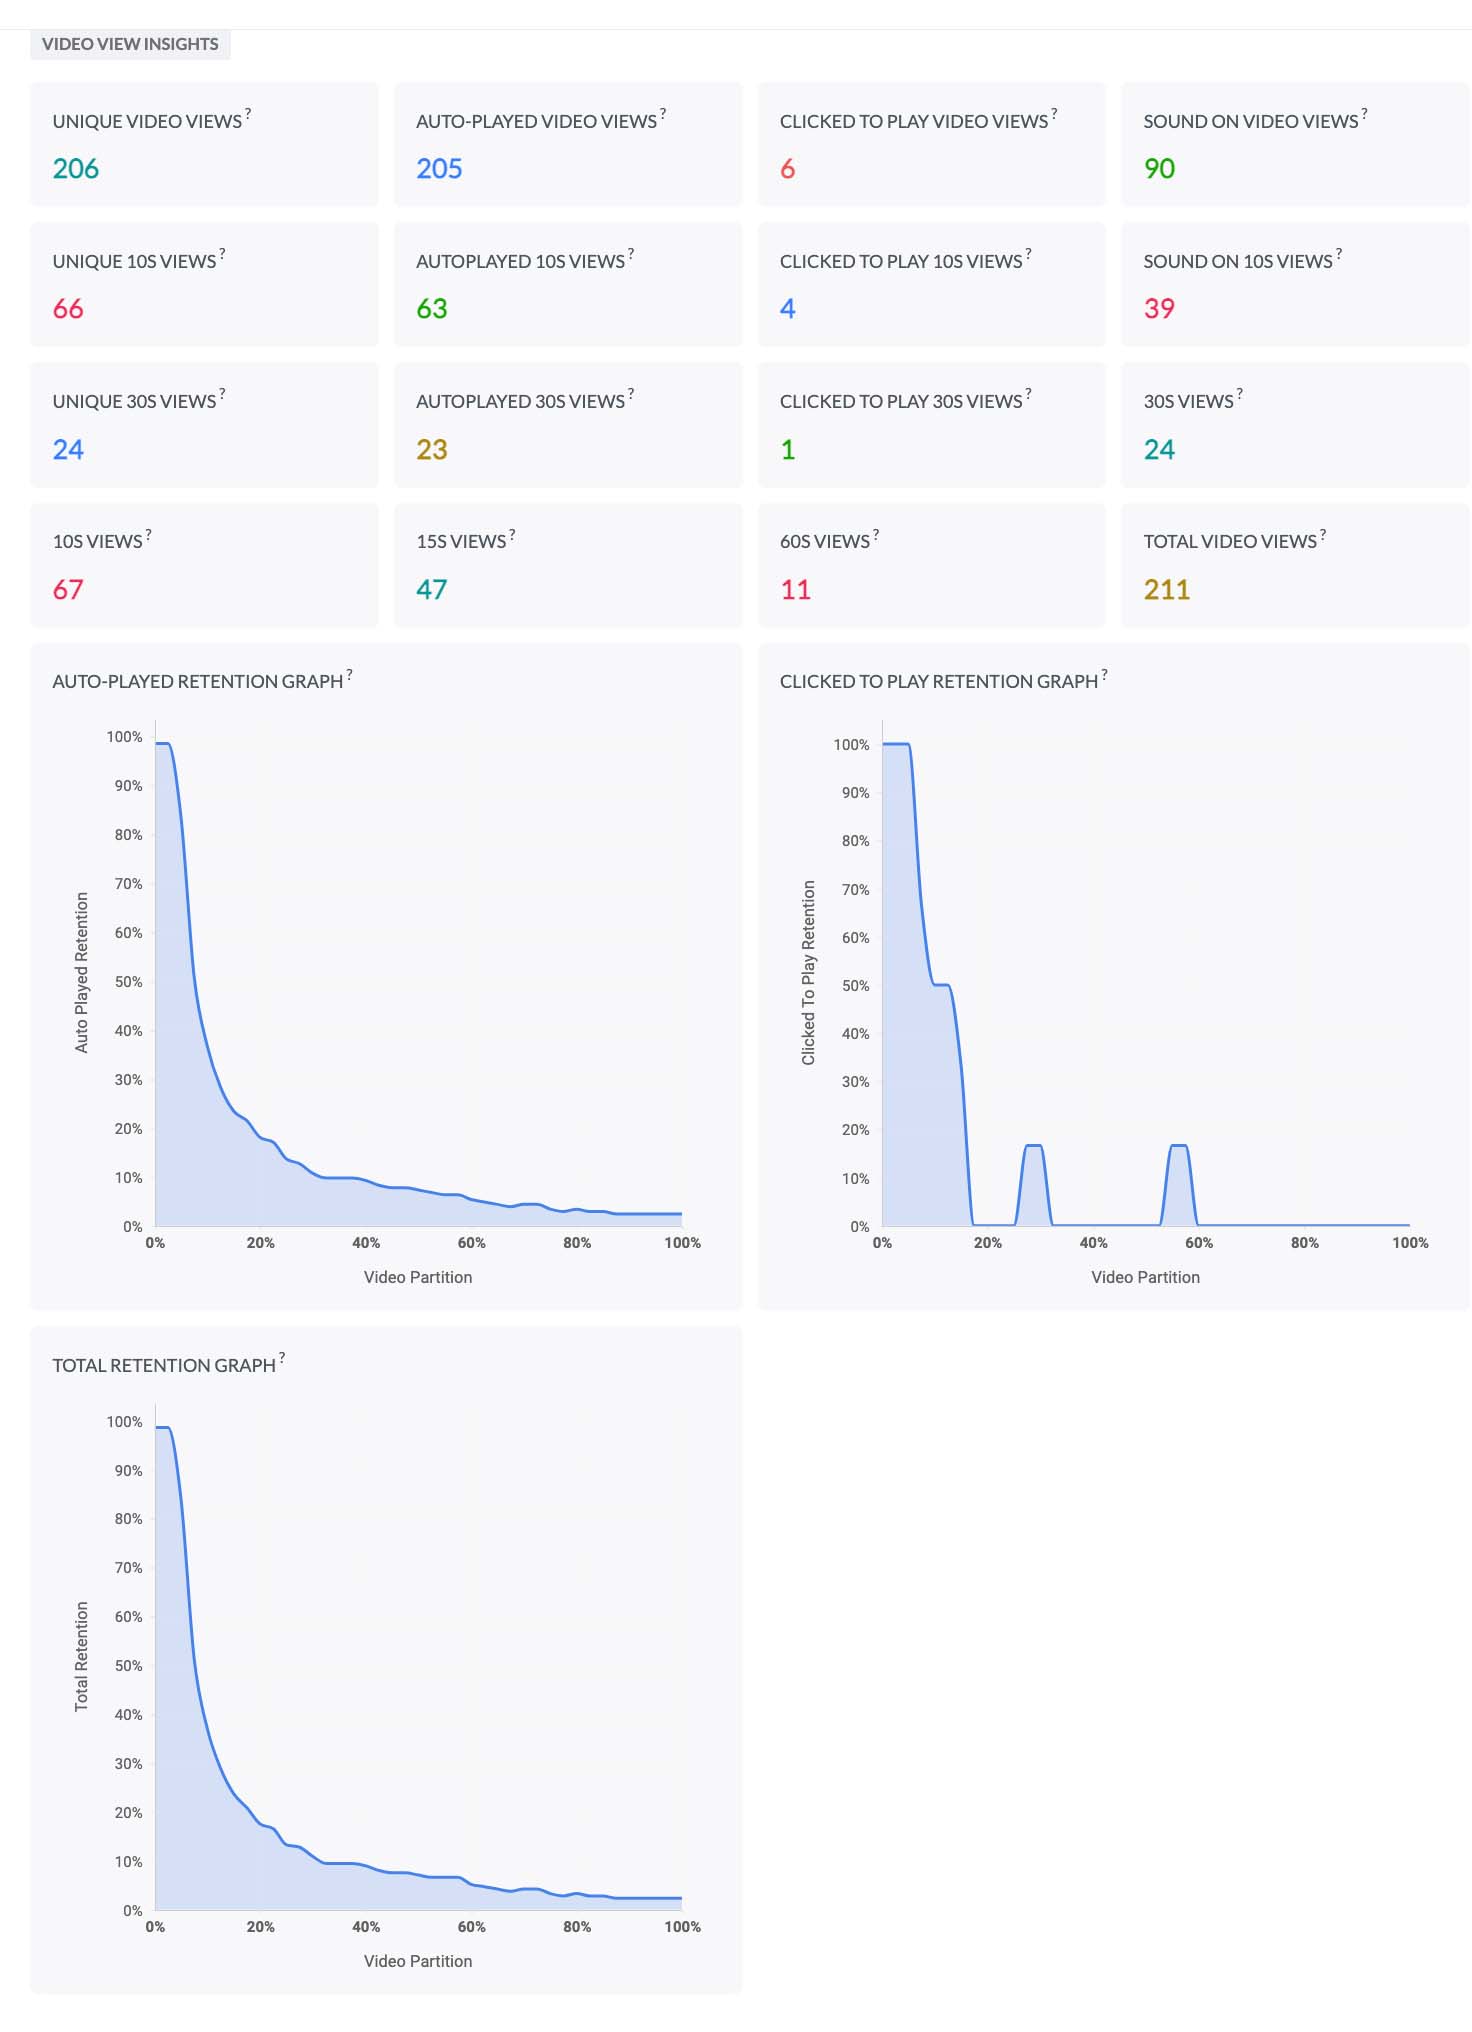
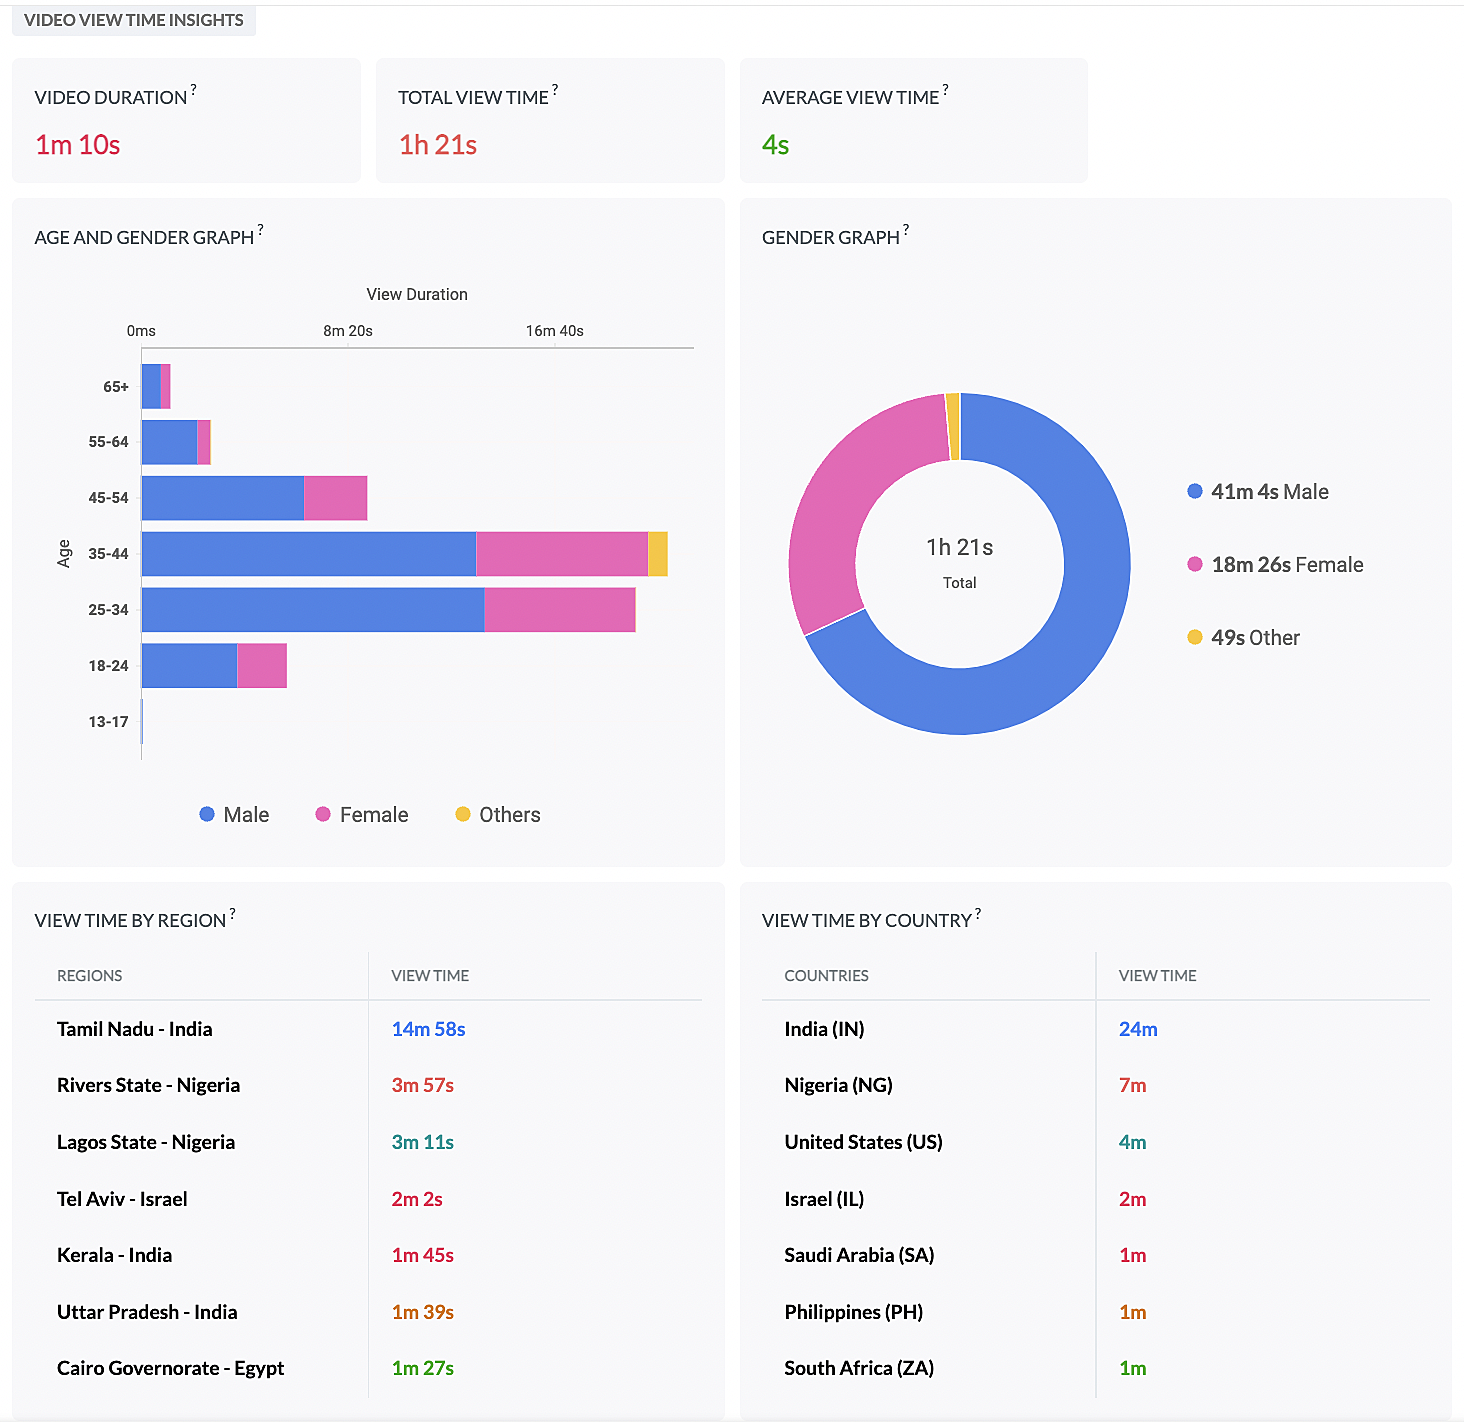
Facebook statistics are grouped into categories such as Reactions, Engagements, and Impressions. If the post consists of a video, you can see the stats for Video View and Video View Time. This helps you get an idea about the audience retention, age and gender, country with maximum view time, and so on.
Reactions

Engagements
Impressions
Video View
Video View Time
Twitter
All the engagement and impressions for a tweet can be viewed from the Post Stats tab. You can view the total number of likes, replies, retweets, quote tweets, number of clicks on the URL, impressions and the total number of clicks on the user's profile name or the image.

LinkedIn
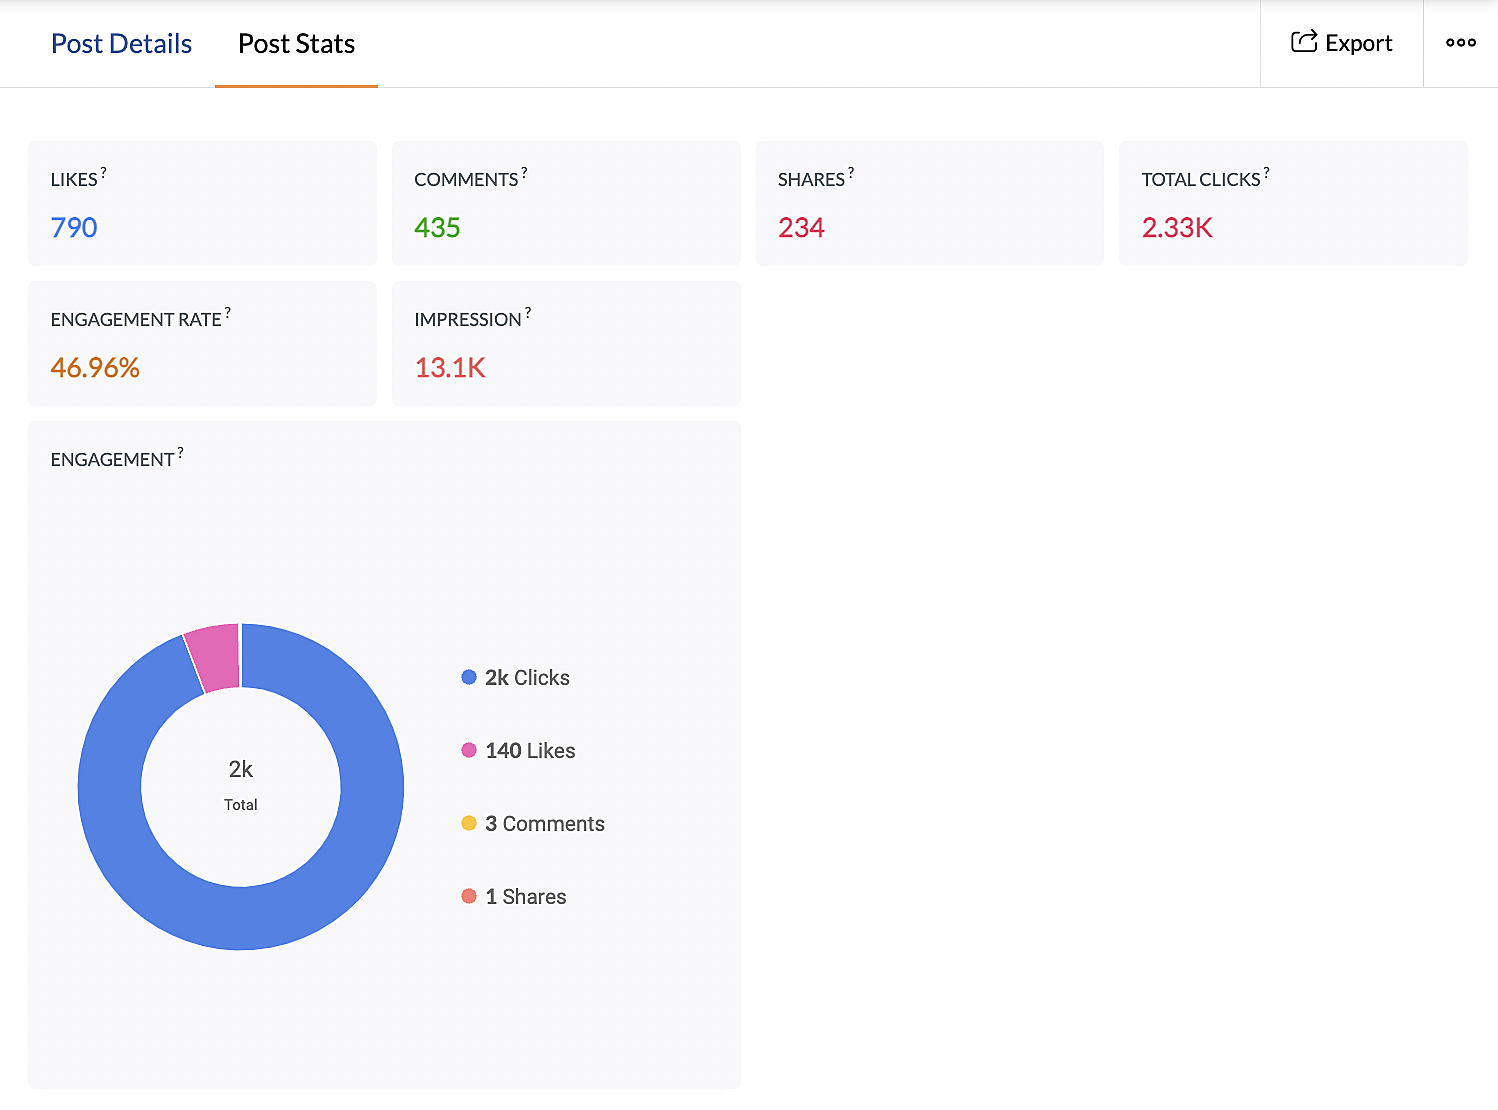
For a LinkedIn post, you can view the total number of likes, comments, and shares. You can also view the total number of clicks on the post, company name, or logo, analyze different types of engagement, the engagement rate, and impressions.
Instagram
For a post on Instagram, you can view the total number of likes, comments, engagement, impression and the number of times the post has been saved. You can also identify how the post has reached the audience. If the post consists of a video, you can also view the number of times the video has been played.

YouTube
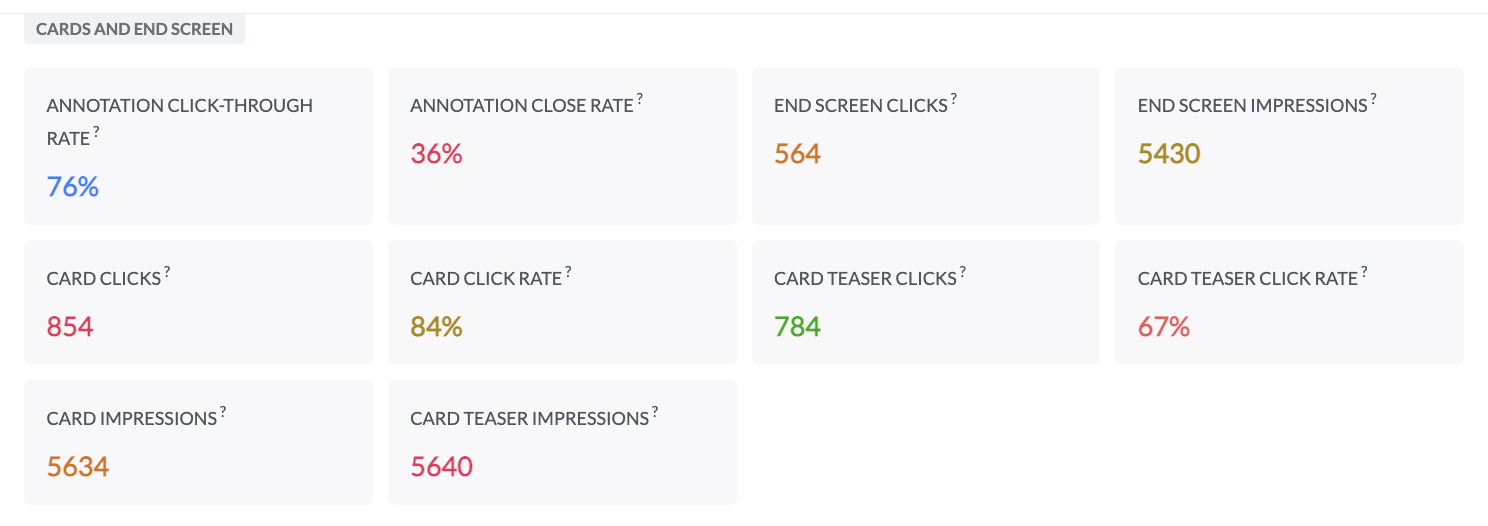
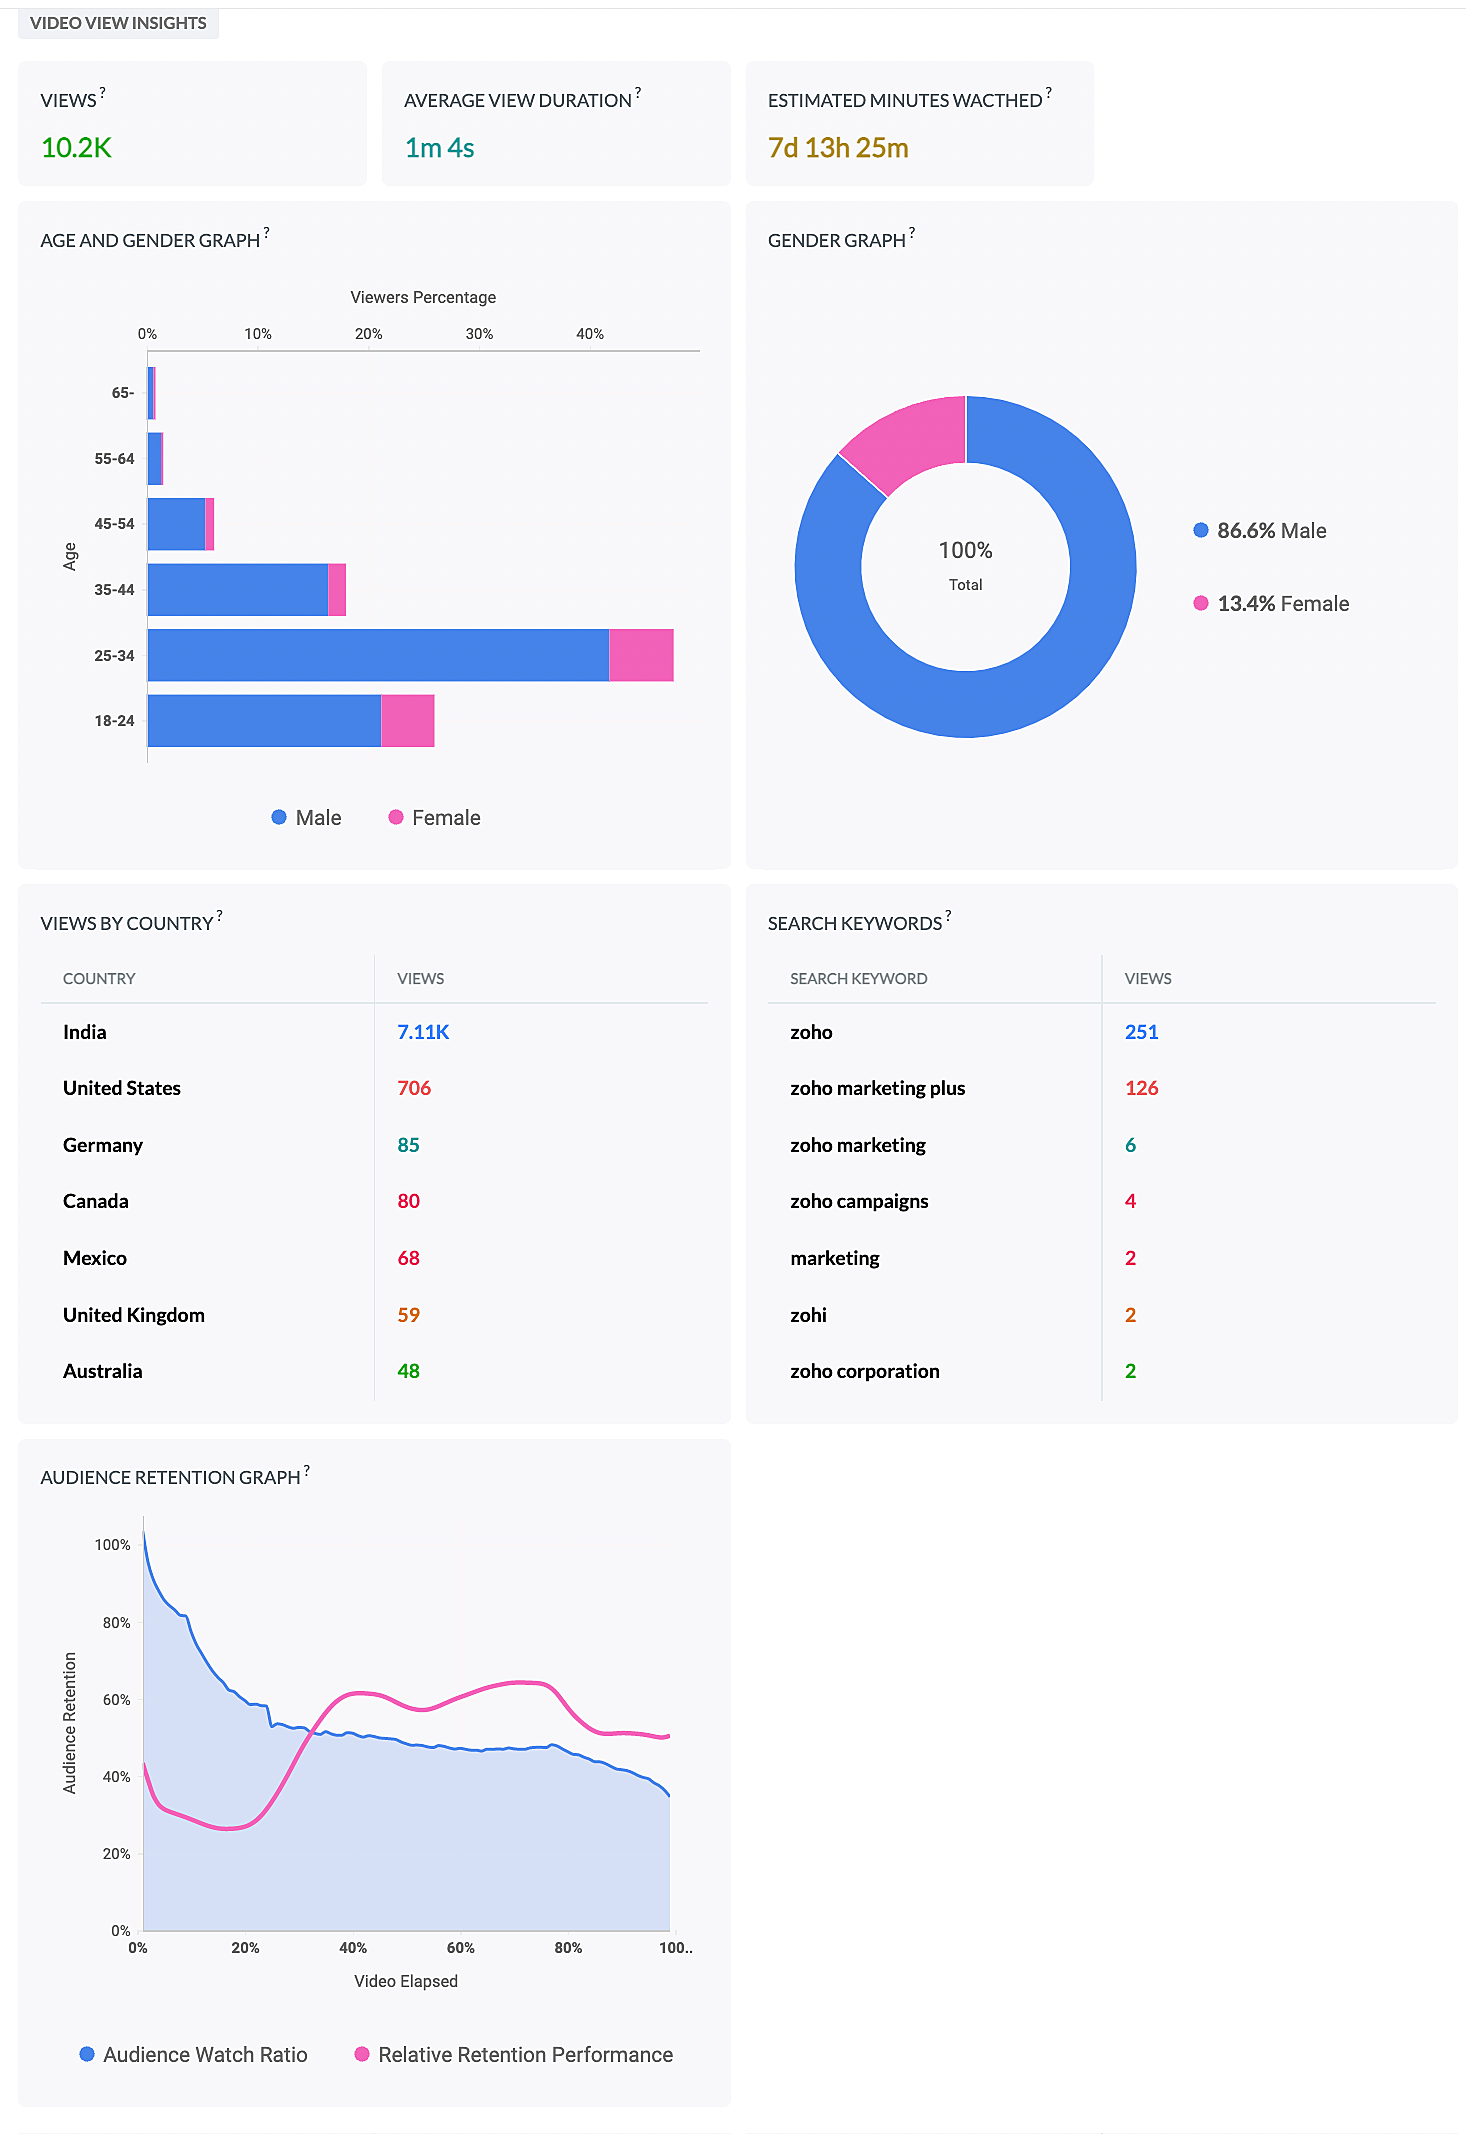
YouTube statistics are grouped into categories such as Engagements, Cards and End Screen, and Video View Insights. These sections help you monitor in-depth metrics such as subscribers gained, annotation click-through rate, card clicks, end screen clicks, total number of views sorted by country, and audience retention.
Engagements

Cards and End Screen
Video View Insights
We hope you find this information useful. Try it out and let us know your valuable feedback.
Topic Participants
Arun Kumar V
Brett Martin
20067733248@zohoclosedAccount.com
jack
Sarath R
Sticky Posts
Introducing Inbox in Zoho Social
Hey everyone, We are excited to introduce the Inbox in Zoho Social to help manage all social media interactions from Facebook, Instagram, X (formerly Twitter), Google Business Profile and YouTube for your brand in one place. You can track and assign themA decade together - Thank you for being a part of the journey with Zoho Social!
A decade ago, we started Zoho Social with a simple vision: to make social media management easier, smarter, and more impactful for your business. What began as a small idea has grown to a powerful platform that helps businesses across the globe reachAdvanced statistics for LinkedIn page, posts and monitor @mentions in Zoho Social
Hello everyone, We've made enhancements to the Monitor, Reports tabs, and Post Stats for the LinkedIn channel in Zoho Social, so we wanted to briefly share some information about the updates. Monitor LinkedIn mentions LinkedIn is one of the most popularIntroducing advanced statistics for all your social media posts
When you're publishing on social media, it's important to understand how the audience engages with your content. This insight helps you come up with ideas for different types of content and also identify the social media channel that's most effectiveIt's here! A Publishing Calendar to give you better view and more control over your posts.
Hello! Just a couple of days back my colleague Vishal announced that you can now do more on Twitter with the Advanced Search Filters, along with a bunch of other cool stuff. I hope you got a chance to check it out. In fact, I'm itching to you tell you all about the latest updates we have lined up, but I'd rather give you doses of excitement every week to last until the very end. ;) Alright, I hear you. That's enough tease for the day. Here we go! Introducing... an all-new Publishing Calendar,
Recent Topics
Facing Issues with Sites Mobile font sizes
my page renediaz.com is facing issues mobile view, when i try to lower font sizes in home page, instead of changing the size, it changes the line spaceDoes the Customer “Company Name” field appear anywhere in the Zoho Books UI outside of PDFs?
Hi everyone, I’m trying to understand how the Company Name field is actually used in Zoho Books. There is a Company Name field on the customer record, but when viewing transactions like a Sales Order in the normal UI (non-PDF view), that field doesn’tSet expiration date on document and send reminder
We have many company documents( for example business registration), work VISA documents. It will be nice if we can set a expiry date and set reminders ( for example 90 days, 60 days, 30 days etc.,) Does Zoho workdrive provide that option?Analytics : How to share to an external client ?
We have a use case where a client wants a portal so that several of his users can view dashboards that we have created for them in Zoho Analytics. They are not part of our company or Zoho One account. The clients want the ability to have user specific,Automatically Update Form Attachment Service with Newly added Fields
Hi, When I have a Form Setup and connected to a 3rd Party Service such as OneDrive for Form Attachments, when I later add a new Upload Field I have to remove and redo the entire 3rd Party Setup from scratch. This needs to be improved, such as when newZoho Sheet for Desktop
Does Zoho plans to develop a Desktop version of Sheet that installs on the computer like was done with Writer?Payroll and BAS ( Australian tax report format )
Hello , I am evaluating Zoho Books and I find the interface very intuitive and straight forward. My company is currently using Quickbooks Premier the Australian version. Before we can consider moving the service we would need to have the following addressed : 1.Payroll 2.BAS ( business activity statement ) for tax purposes 3.Some form of local backup and possible export of data to a widely accepted format. Regards Codrin MitinZoho Desk API - Send Reply to CUSTOMERPORTAL
Hello! I'll try to send a reply to Customer Portal, But the response is 500 (INTERNAL_SERVER_ERROR in service response). {"Error":"{\"errorCode\":\"INTERNAL_SERVER_ERROR\",\"message\":\"An internal server error occurred while performing this operation.\"}"}Python - code studio
Hi, I see the code studio is "coming soon". We have some files that will require some more complex transformation, is this feature far off? It appears to have been released in Zoho Analytics alreadyDheeraj Sudan and Meenu Hinduja-How do I customize Zoho apps to suit my needs?
Hi Everyone, I'm Meenu Hinduja and my husband Dheeraj Sudan, run a business. I’m looking to tweak a few things to fit my needs, and I’d love to hear what customizations others have done. Any tips or examples would be super helpful! Regards Dheeraj SudanFrom Zoho CRM to Paper : Design & Print Data Directly using Canvas Print View
Hello Everyone, We are excited to announce a new addition to your Canvas in Zoho CRM - Print View. Canvas print view helps you transform your custom CRM layouts into print-ready documents, so you can bring your digital data to the physical world withZoho Books Payroll
How am I supposed to do payroll and pay my employees with Zoho Books? I think it's pretty strange that an accounting software doesn't have the ability to perform one of the most common functions in business; paying your employees. Am I missing something,Layout Rules Don't Apply To Blueprints
Hi Zoho the conditional layout rules for fields and making fields required don't work well with with Blueprints if those same fields are called DURING a Blueprint. Example. I have field A that is used in layout rule. If value of field A is "1" it is supposed to show and make required field B. If the value to field A is "2" it is supposed to show and make required field C. Now I have a Blueprint that says when last stage moves to "Closed," during the transition, the agent must fill out field A. Nowvalidation rules doesn't work in Blueprint when it is validated using function?
I have tried to create a validation rule in the deal module. it works if I try to create a deal manually or if I try to update the empty field inside a deal. but when I try to update the field via the blueprint mandatory field, it seems the validationSort Legend & stacked bar chart by value
I'd love to see an option added to sort the legend of graphs by the value that is being represented. This way the items with the largest value in the graph are displayed top down in the legend. For example, let's say I have a large sales team and I createIs It Possible to Convert a Custom Module to a Quote?
I recently created a custom module in our CRM environment for RFQs so that our sales team can submit quote requests directly in Zoho rather than by email/phone. This allows for a cleaner overall process, minimizing potential errors and potentially encouragingAll new Address Field in Zoho CRM: maintain structured and accurate address inputs
The address field will be available exclusively for IN DC users. We'll keep you updated on the DC-specific rollout soon. It's currently available for all new sign-ups and for existing Zoho CRM orgs which are in the Professional edition. Latest updateHow can Data Enrichment be automatically triggered when a new Lead is created in Zoho CRM?
Hi, I have a pipeline where a Lead is created automatically through the Zoho API and I've been trying to look for a way to automatically apply Data Enrichment on this created lead. 1) I did not find any way to do this through the Zoho API; it seems likeClient Side Scripts for Meetings Module
Will zoho please add client side scripting support to the meetings module? Our workflow requires most meeting details have a specific format to work with other software we have. So we rely on a custom function to auto fill certain things. We currentlyProposal: Actionable API Error Messages to Reduce Support Ticket Volume
I've encountered a long-standing frustration with how Zoho Creator's API communicates errors to developers, and I'm hoping the Zoho team can address this in a future update. This issue has persisted for over 9 years based on community discussions, andZoho CRM - Option to create Follow-Up Task
When completing a Zoho CRM Task, it would be very helpful if there was an option to "Complete and Create Follow-Up Task" in the pop-up which appears. It could clone the task you are closing and then show it on the screen in edit mode, all the user wouldDynamic Field Folders in OneDrive
Hi, With the 2 options today we have either a Dynamic Parent Folder and lots of attachments all in that one folder with only the ability to set the file name (Which is also not incremented so if I upload 5 photos to one field they are all named the sameDrag 'n' Drop Fields to a Sub-Form and "Move Field To" Option
Hi, I would like to be able to move fields from the Main Page to a Sub-Form or from a Sub-Form to either the Main Page or another Sub-Form. Today if you change the design you have to delete and recreate every field, not just move them. Would be nice toFile Conversion from PDF to JPG/PNG
Hi, I have a question did anyone every tried using custom function to convert a PDF file to JPG/PNG format? Any possibility by using the custom function to achieve this within zoho apps. I do know there are many third parties API provide this withAllocating inventory to specific SO's
Is there a way that allocate inventory to a specific sales order? For example, let's say we have 90 items in stock. Customer 1 orders 100 items. This allocates all 90 items to their order, and they have a back order for the remaining 10 items which couldCliq iOS can't see shared screen
Hello, I had this morning a video call with a colleague. She is using Cliq Desktop MacOS and wanted to share her screen with me. I'm on iPad. I noticed, while she shared her screen, I could only see her video, but not the shared screen... Does Cliq iOS is able to display shared screen, or is it somewhere else to be found ? RegardsPull cells from one sheet onto another
Hello all! I have created an ingredients database where i have pricing and information and i want to pull from that database into a recipe calculator. I want it to pull based on what ingredient I choose. The ingredients database has an idea and i wantClosing the Loop: Why Lookup Asymmetry is Harming Data Integrity in Creator
TL;DR: Lookup fields allow users to add new related records inline via the "+" icon, but there's no equivalent ability to edit an existing related record without navigating away and losing form context. Adding a native "Edit" icon—with automatic UserAdd the ability to Hide Pages in Page Rules
Hi, We have Field Rules to show and hide fields and we have page Rules, but we can't hide a page in Page Rules so it isn't completed before the previous page (And then have the Deny Rules to prevent submitting without both pages completed), we can onlyEnable Free External Collaboration on Notecards in Zoho Notebook
Hi Zoho Notebook Team, I would like to suggest a feature enhancement regarding external collaboration in Zoho Notebook. Currently, we can share notes with external users, and they are able to view the content without any issue. However, when these externalusing the Client script on the load of the form if service no is empty means then i want to make issue relate to is Service
using the Client script on the load of the form if service no is empty means then i want to make issue relate to field is Service if Purchae no is empty means then i want to make issue relate to is PurchaseChanges to the send mail Deluge task in Zoho CRM
Hello everyone, At Zoho, we continuously enhance our security measures to ensure a safer experience for all users. As part of our ongoing security enhancements, we're making an important update on using the send mail Deluge task in Zoho CRM. What's changing?Work Order wont mark as Completed
I have a couple of work orders that won't mark as completed even when I've marked the Service Appointments as completed fully.Item name special charaters <>
Im trying to input speical characters such as < and > into item name and item description but comes up with following error: Invalid value passed for Item Name and Invalid value passed for Item Description How do i allow speical characters?Zoho Analytics Dashboard - How to hide the user filter
I am using the same dashboard template across different external clients and applying a user filter to the data by site URL. How can I hide the user filter in View Mode so the external client won't see the list of other clients in the drop-down menu?Customer Parent Account or Sub-Customer Account
Some of clients as they have 50 to 300 branches, they required separate account statement with outlet name and number; which means we have to open new account for each branch individually. However, the main issue is that, when they make a payment, theyCannot get code to work with v2.mergeAndStore!
Please can someone help me pass subform items into a repeating mail merge table row using v2.mergeAndStore? I have a mail merge template created in Writer and stored in Workdrive. This template is referenced by a custom CRM function which merges all ofKaizen #229: Email-Deal Associations in Zoho CRM
Hi All, Welcome back to another week of Kaizen! Emails are a core channel for customer communication in any CRM system. In Zoho CRM, emails can be associated with records across multiple modules. In this post, we will focus on email associations withDeprecation of the Zoho OAuth connector
Hello everyone, At Zoho, we continuously evaluate our integrations to ensure they meet the highest standards of security, reliability, and compliance. As part of these ongoing efforts, we've made the decision to deprecate the Zoho OAuth default connectorAction Required: Update Microsoft SQL Server Security Settings Before February 2026
Dear Users, We recently deployed security updates in Zoho Analytics that inadvertently caused connection failures for a few customers using Microsoft (MS) SQL Server hosted on older Windows versions (Windows Server 2012, 2012 R2, and 2014). To restoreNext Page