Minor enhancements in Zoho CRM Dashboards: drill-down for Funnels, flexible Duration settings, and more
Dashboards in Zoho CRM help you visualize data across modules, track performance, and make informed decisions. Components like charts, KPIs, and funnels bring together key metrics in a single view, making it easier to spot trends and take action. Over time, we've continued to enhance how these components work—giving you more control over how data is filtered, grouped, and explored.
This update brings four improvements to dashboards:
Drill-down support for the Funnel component
Greater flexibility with the Duration field
New operators for date filters
Clearer labels when grouping by week.
Let's look into the details.
Drill-down is now available for the Funnel component
When you click on a data point inside a dashboard component, drill-down opens a detailed view showing the underlying records. This helps you move from a summary view to the actual data without leaving the dashboard.
Until now, the Funnel component did not support drill-down. You could see the stages and their values, but clicking on a stage wouldn't open the record list. With this enhancement, you can now click on any stage in a Funnel component and drill down into the records that make up that value—just as you would with other component types.
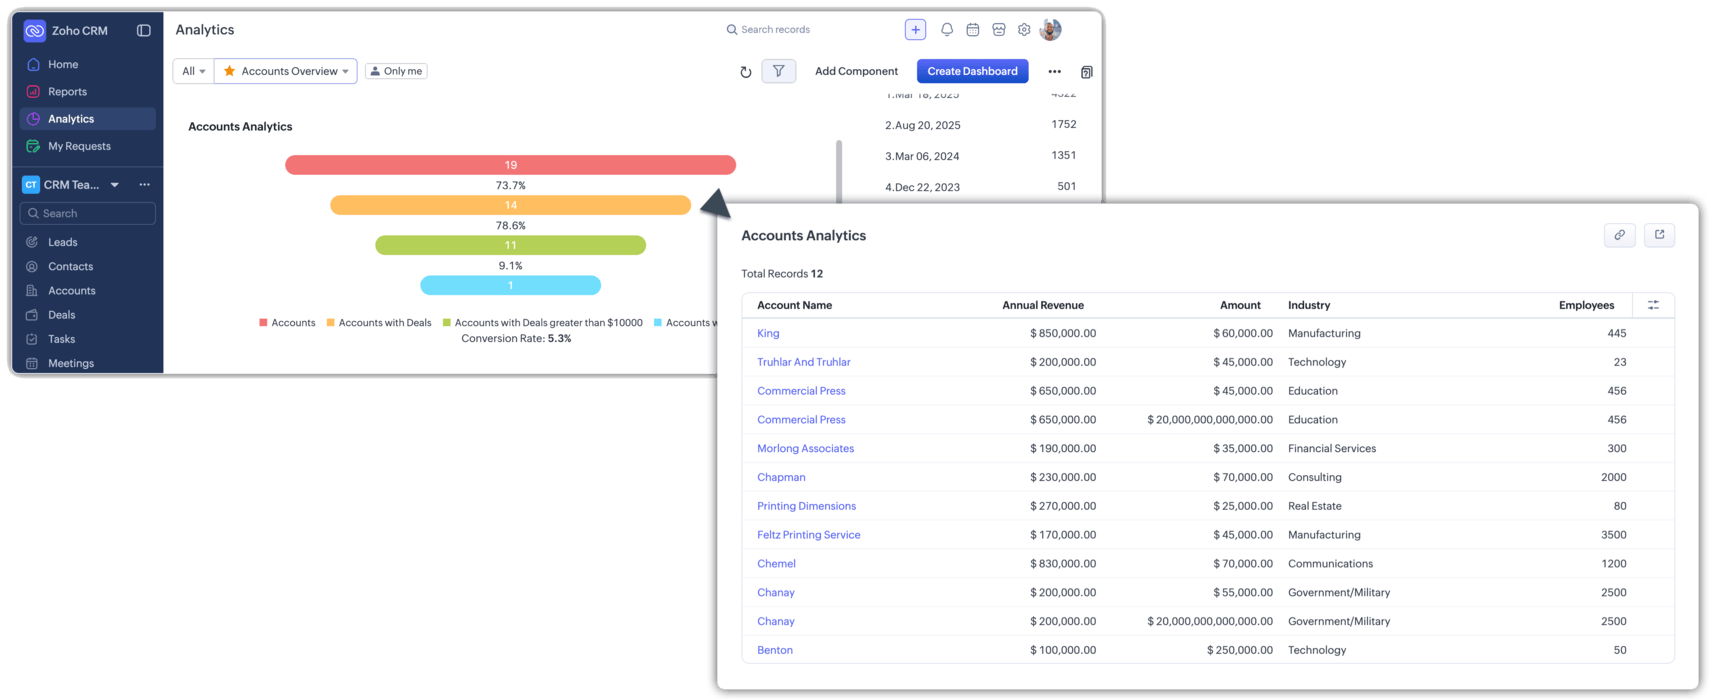
This makes funnel charts more actionable. Whether you're reviewing deal stages, lead progression, or case resolution flows, you can now explore the records behind each stage directly from the dashboard.
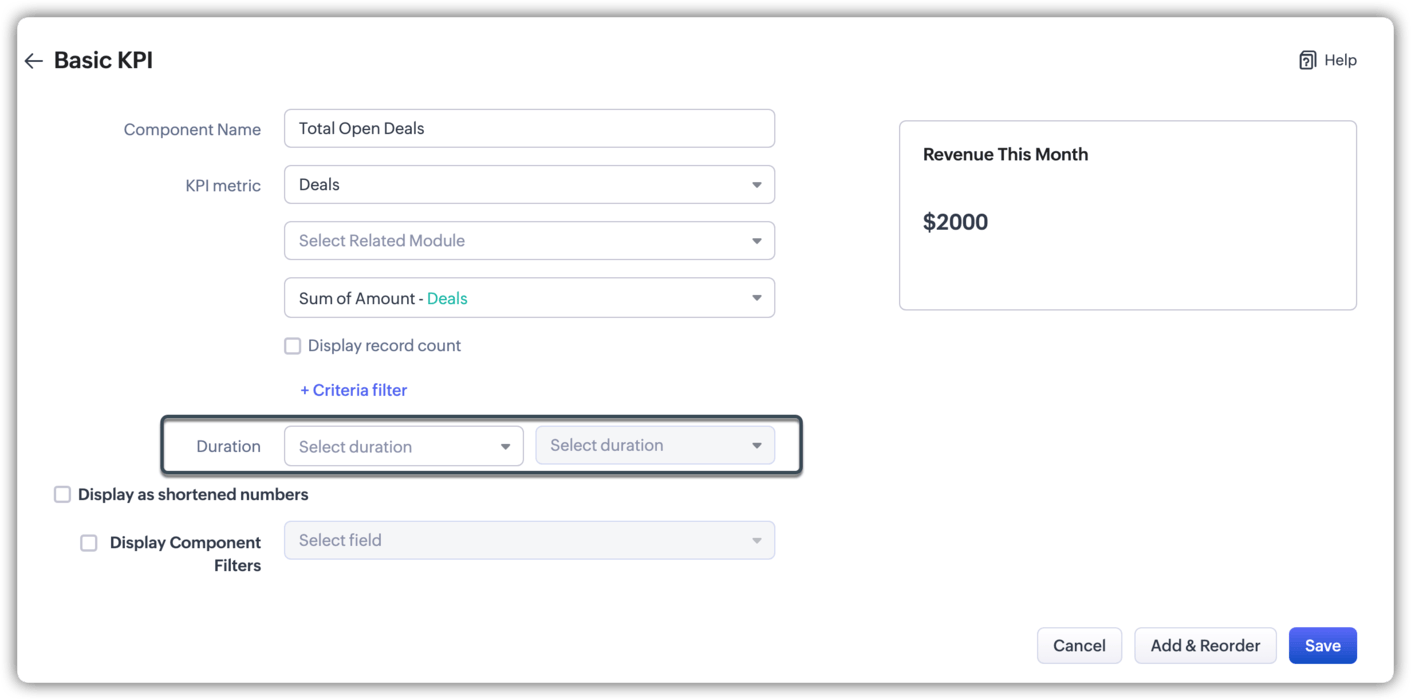
Some component types like KPIs, Target Meters, Funnels, and Comparators previously required you to set a Duration, or date range, before you could configure them. That was limiting when the metric made more sense across all your data. Think of a KPI for total open deals, or a Funnel tracking your entire active pipeline. Neither really belongs to a single period.
That restriction is now gone. You can build these components against your whole dataset by leaving Duration empty, or still apply a date range when you actually need a time-bound view.
"Before" and "After" operators for date filters
Date fields in both Component filters and Dashboard filters now support two new operators: Before and After.
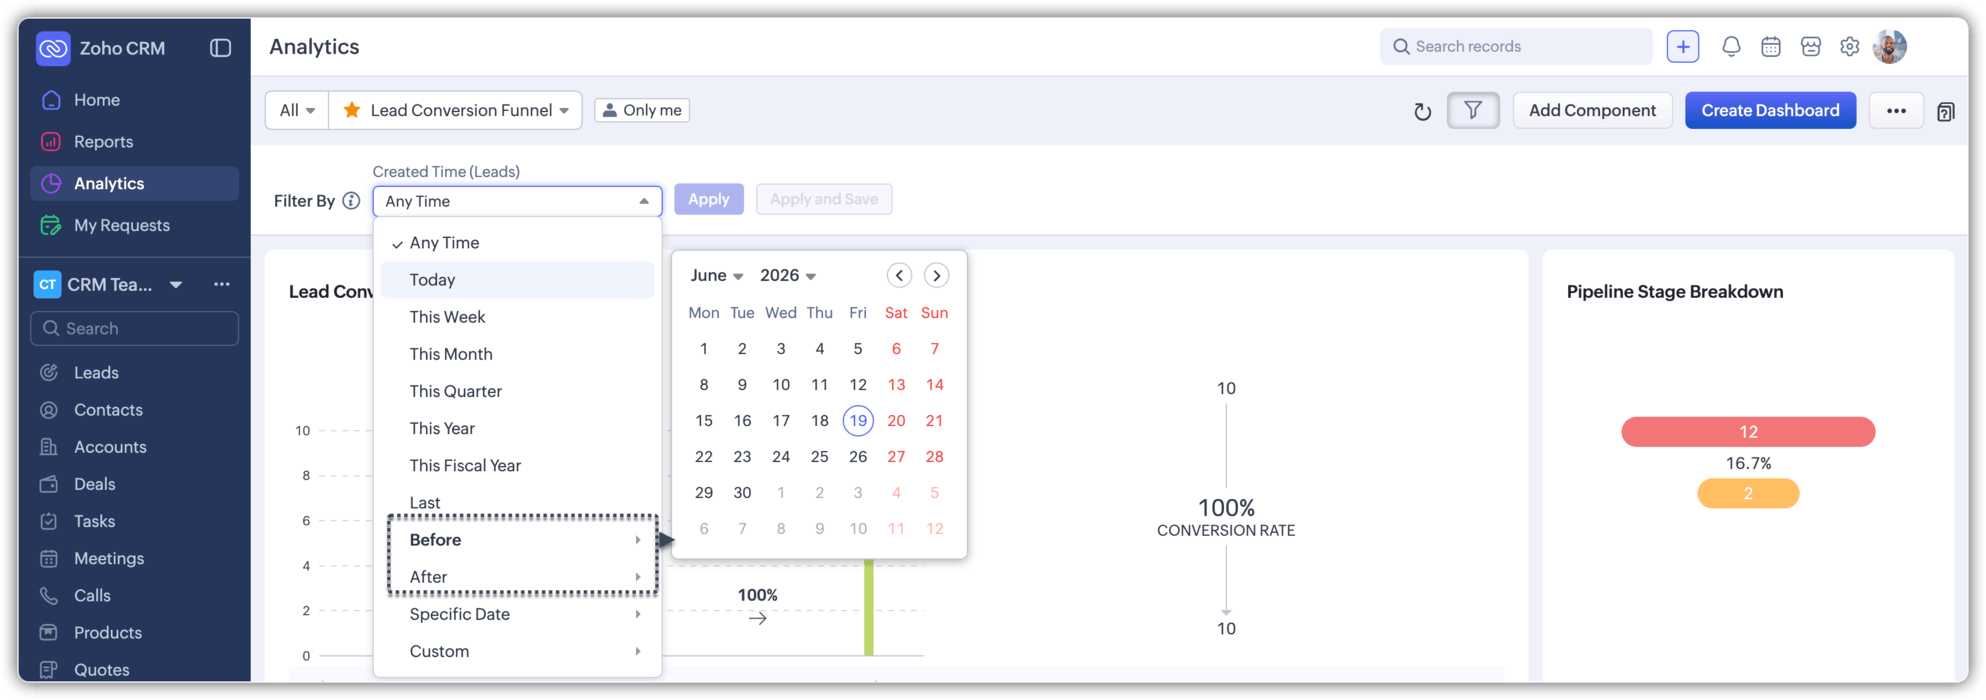
These operators let you filter records based on whether they fall earlier or later than a specific date, without having to define a full range. Say you want deals closed after a product launch, or leads created before a campaign started. These are cases where you care about everything before or after a milestone, not a window with two ends. The new operators handle this directly, so you can skip the workarounds and keep your filter logic simple.
Clearer week labels when grouping by Week
When a component is grouped by Week, the grouping labels previously appeared as week numbers within the year—for example, "W12, 2026" or "W13, 2026." These labels required mental conversion to understand which actual dates they represented, making charts harder to read at a glance.
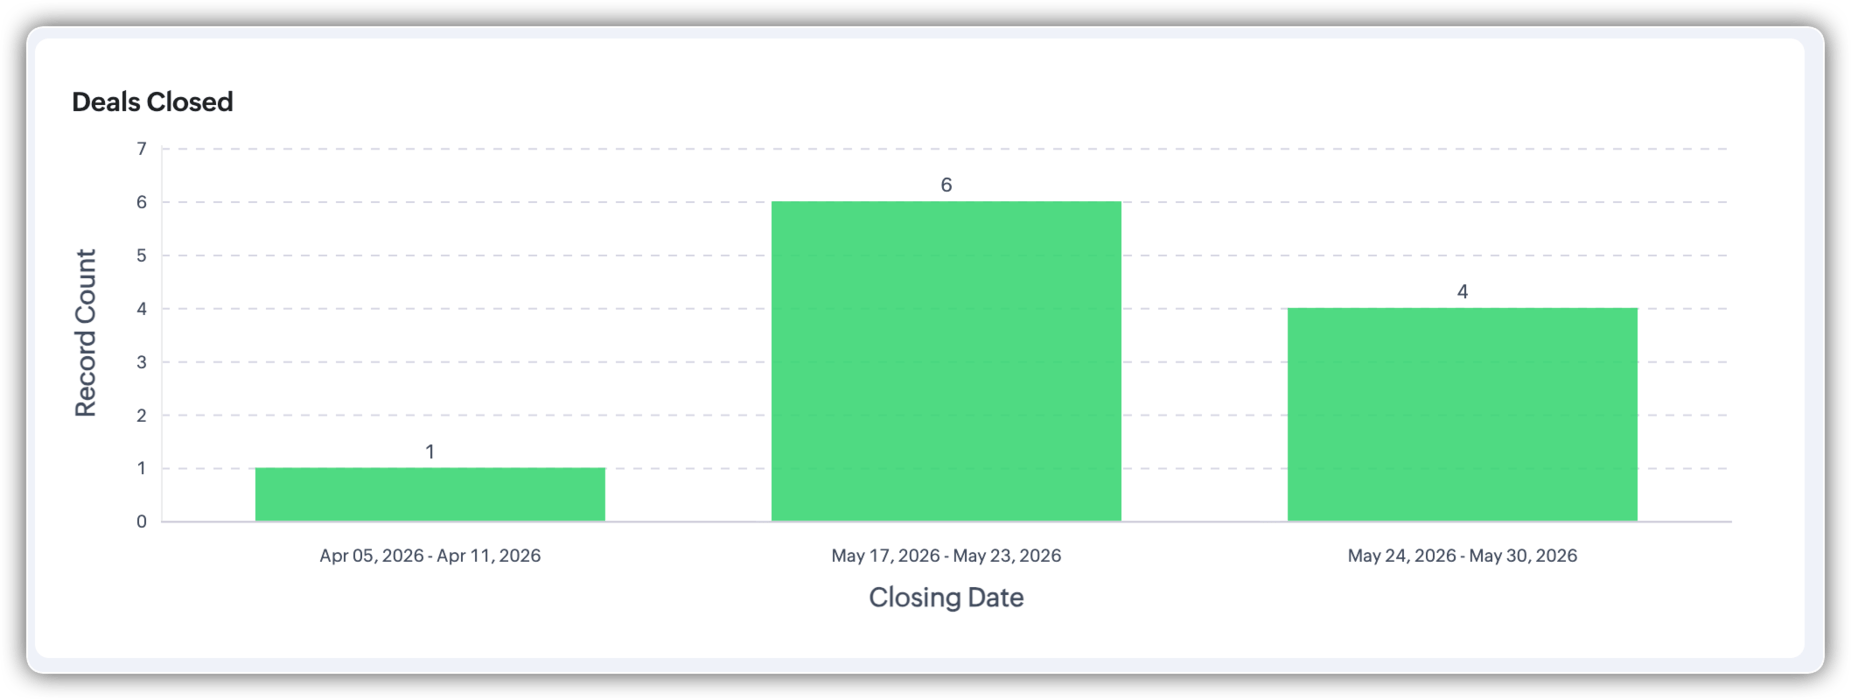
Week groupings are now shown as a Start date – End date range. Instead of seeing "W12, 2026," you'll see the specific days that week covers. This makes the chart easier to interpret without needing to reference a calendar or decode week numbers.
The improvement applies wherever week-based grouping is used, helping you quickly understand the time frame each bar or segment represents.
Thanks,
Nizamuddin
