Visualize your data with a new set of charts: Treemap, Butterfly, Sankey, and Cluster charts in Zoho CRM
Dear customers,
When it comes to analytics, it's not just about the numbers; it's about understanding the story behind them.
With that philosophy in mind, we’re excited to introduce a line of representations to the existing array of chart types in Zoho CRM: Treemap, butterfly, sankey and cluster charts. Let's go!
Treemaps
Treemap charts are used to visually represent hierarchical datasets in a rectangular layout. It aligns its parent categories as larger tiles with their sub-categories nested within them. The size of each tile is proportional to its corresponding value, making it easy to compare different segments within the hierarchy.
This is how a treemap chart looks:

These structured data representations help you understand overall performance and contributions, as well as compare participating entities at a glance.
Unlike traditional bar charts or pie charts, treemaps can be used if your datasets are large and exhibit parent-child relationships.
Here are some examples to better understand their usage:
Comparing revenue distribution between functions
A company's revenue is distributed among its functions before it gets further disbursed to its employees. Treemap charts can be used to depict this distribution and compare it between functions. As you can see below, the hierarchy can be represented as a treemap to compare it directly with other functions:

The hierarchy at the top shows just the numbers and levels, but the treemap chart represents the numbers proportionally, allowing leaders to visualize the difference in distribution.
Interpretation: As you can easily see in the treemap, sales and marketing receive the same amount of revenue, while engineering is given significantly more than the other two.
Likewise, with treemap charts, you can:
- Compare popular lead sources with lead counts is the measure and lead source being the participating entity—a classic single-grouping configuration.
- View cost savings achieved across departments. With the departments as the grouping parameters and the cost saved as the measured amount, the chart lays out all the departments as tiles in proportion, based on money saved.
- Compare ad spends across channels, where channels are the parent grouping and ad spend is the measured unit.
Butterfly
Butterfly charts are used to compare two related datasets side-by-side, resulting in a representation that looks like a butterfly or tornado.
Now, how does it differ from bar charts?
The standard bar chart can compare two entities for a given measure. Say, you are comparing the performance of Mary and Charles. The two users' data is represented using bars, and the length will denote their performances. But, when it comes to comparing their performances over a period or their contribution across different stages, a bar chart is not sufficient.


With butterfly charts, you can:
- Compare revenue between two of your branches each month. With branches being compared for sum of sales revenue, grouped by closing date.
- Compare the performance of two reps in a given quarter. Compared between two users for average of amount of deals, grouped by closing date until today.
In addition to the user-based comparison above, butterfly charts are well-suited to visualizing other types of data comparisons, like:
- Picklist-based comparisons
- Duration-based comparisons
- Aggregate-based comparisons
Business scenario
Comparing the number of deals closed for each lead sources: Duration-based comparison
You can identify the productive lead source by comparing the number of deal closures for every lead source in your organization based on their closing week.

Analyzing effective sales methodology, inbound vs. outbound: Picklist-based comparison
Businesses use both inbound and outbound lead generation strategies, and each of these methods can reap different results based on the season and occasion. By comparing inbound versus outbound each month, you can identify which works best at what time.

Analyze the amount versus the expected revenue between accounts: Aggregate-based comparison
Expected revenue is a result of a deal's progression in the sales pipeline. Comparing the amount versus their expected revenue will not only help visualize the expected revenue of participating accounts but also indicate the accounts' stage in the sales pipeline.

Sankey
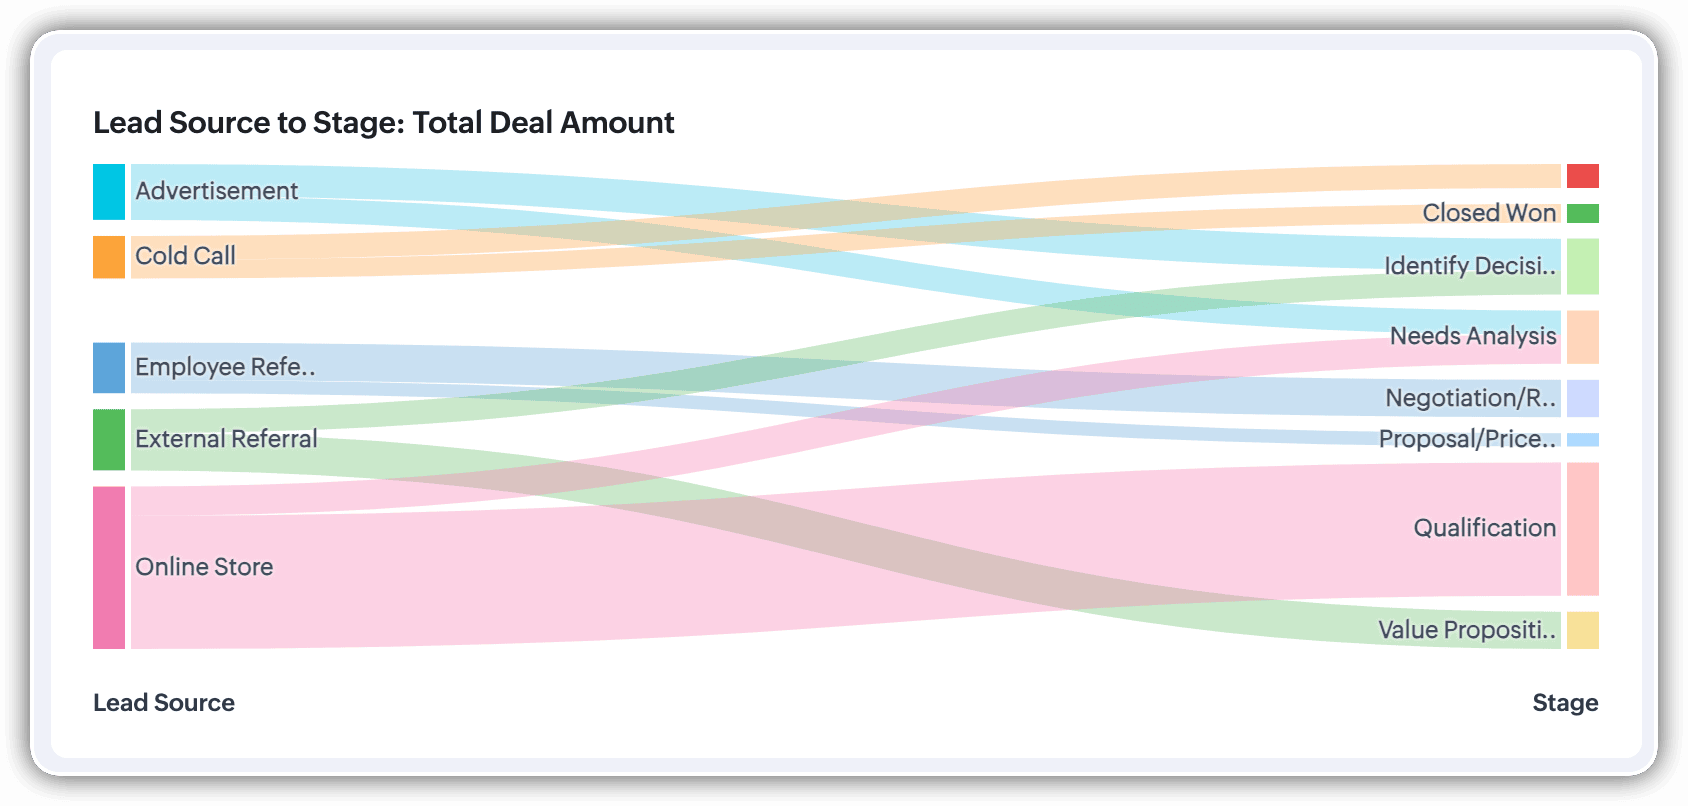
A Sankey Chart is designed to visualize the movement of data across different data groups. Unlike traditional charts—such as bar, column, pie, or donut—that mainly provide a static distribution of values, the Sankey Chart focuses on illustrating the flow between multiple segments or grouping fields. This makes it an ideal choice when you want to track how values (like lead counts, revenue, or deal statuses) move from one category to the next.

Key features
- Flow visualization: With the Sankey Chart, you can observe the movement of data between different groups.
- Multiple grouping fields: This chart works best when you have at least two grouping fields. You can go even further and add a third grouping to see an even more detailed mapping of your data flow.
- Simple configuration: The configuration for the Sankey Chart is as simple as any other chart type in Analytics.
Business scenarios:
Imagine you’re a sales manager trying to get a better handle on your team’s performance and your company’s pipeline. You want to understand not just how many deals are coming in, but also which sources are contributing the most value—and how those deals are progressing through different sales stages.
Let’s say you want to understand which lead sources are driving the most deal activity and how those deals progress through the pipeline. You can create a Sankey chart that maps the count of deals from Lead Source to Stage.

After analyzing the chart, you might notice that Online Store brings in a high volume of early-stage deals, while sources like External Referral contribute fewer deals that are more likely to reach advanced stages like Proposal or Negotiation.
This insight helps you prioritize nurturing the most profitable channels.
Sankey charts can also be helpful in other operational scenarios where understanding transitions across stages or teams is essential:
- Regional revenue distribution: Visualize how revenue flows across different regions, product categories, and their corresponding annual revenue. This helps you compare which regions contribute the most to each product line and where your high-value segments lie.
- Ticket handling flow: Visualize the flow of support tickets from their origin channel to internal departments and finally to resolution statuses. This can reveal workload imbalances or common points of delay in your support process.
Cluster
A cluster chart is similar to stacked column charts, but instead of stacking horizontally, the data is represented as vertical bars. As you create a column chart with multiple groupings, you can change the type of column chart to a cluster chart to achieve this representation.

In the above image, you can see the stacked column chart compares the number of lead conversions based on popular sources between countries. The stacks appearing on top of existing stacks ask you to calibrate the record count (y-axis) based on the previous stacks, which can lead to inaccurate interpretations. In this case, a cluster representation will paint a clearer picture of the analyses.
Other minor enhancements:
In addition to the three charts we mentioned above, we've also made the following minor changes:
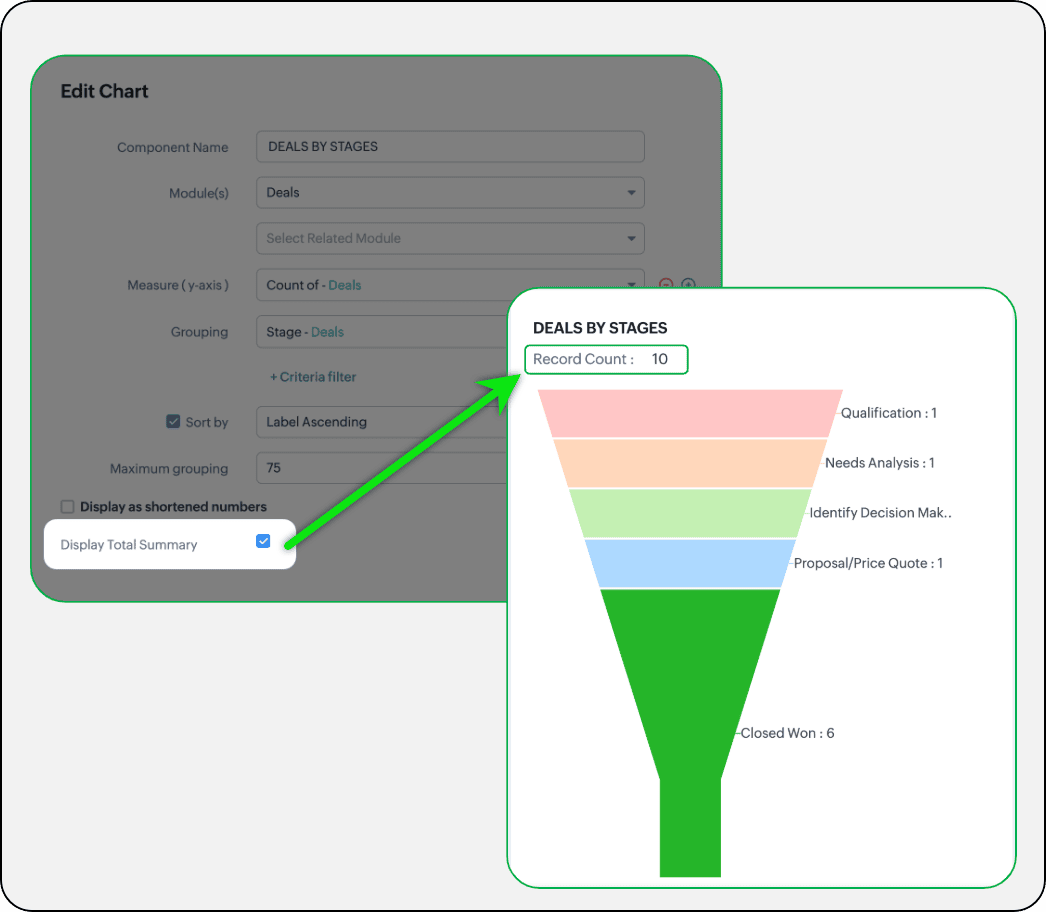
- Display total summary: Thus far, for all charts, each participating measure included labels. Now, to better understand overall contributions, a check box to display the total summary is provided under More options on the Chart Configuration page. Based on the configuration, the total revenue or the rolled-up quantities will be prominently displayed.
- Merge Y-axis: For charts that use two y-axis measurements, the intention is to view the progression of one entity against these two measures. Despite the scale, if the y-axis on the left is disproportionate to the values of the y-axis on the right, the plotted graph will result in a graphically and logically incorrect representation.
As you can see in the image below, the plot area of the sum of amount bar and the sum of expected revenue aligns close together, while, the difference between $700,000 and $40,500 is drastic, creating inaccurate interpretations.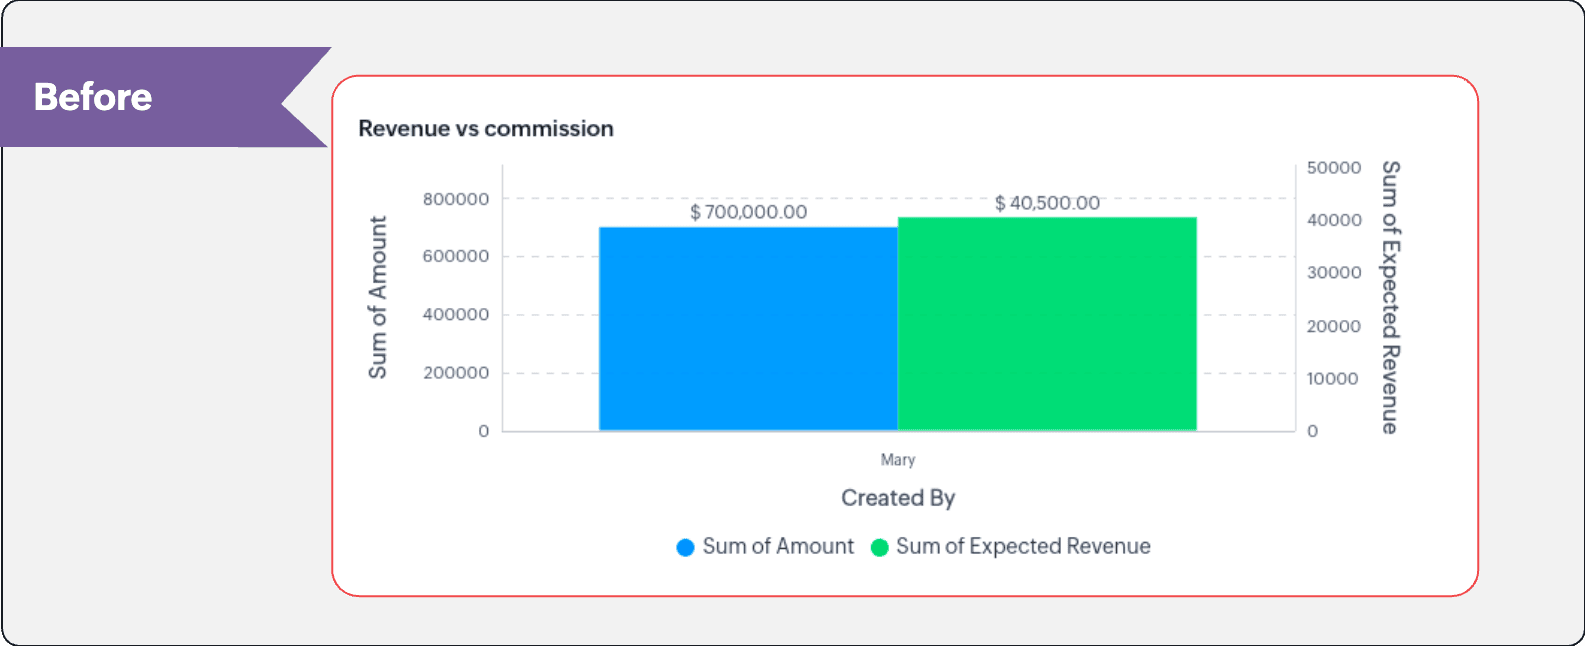
In this enhancement, we're allowing neighboring values of measures to merge so that the interpretation can be more visually accurate.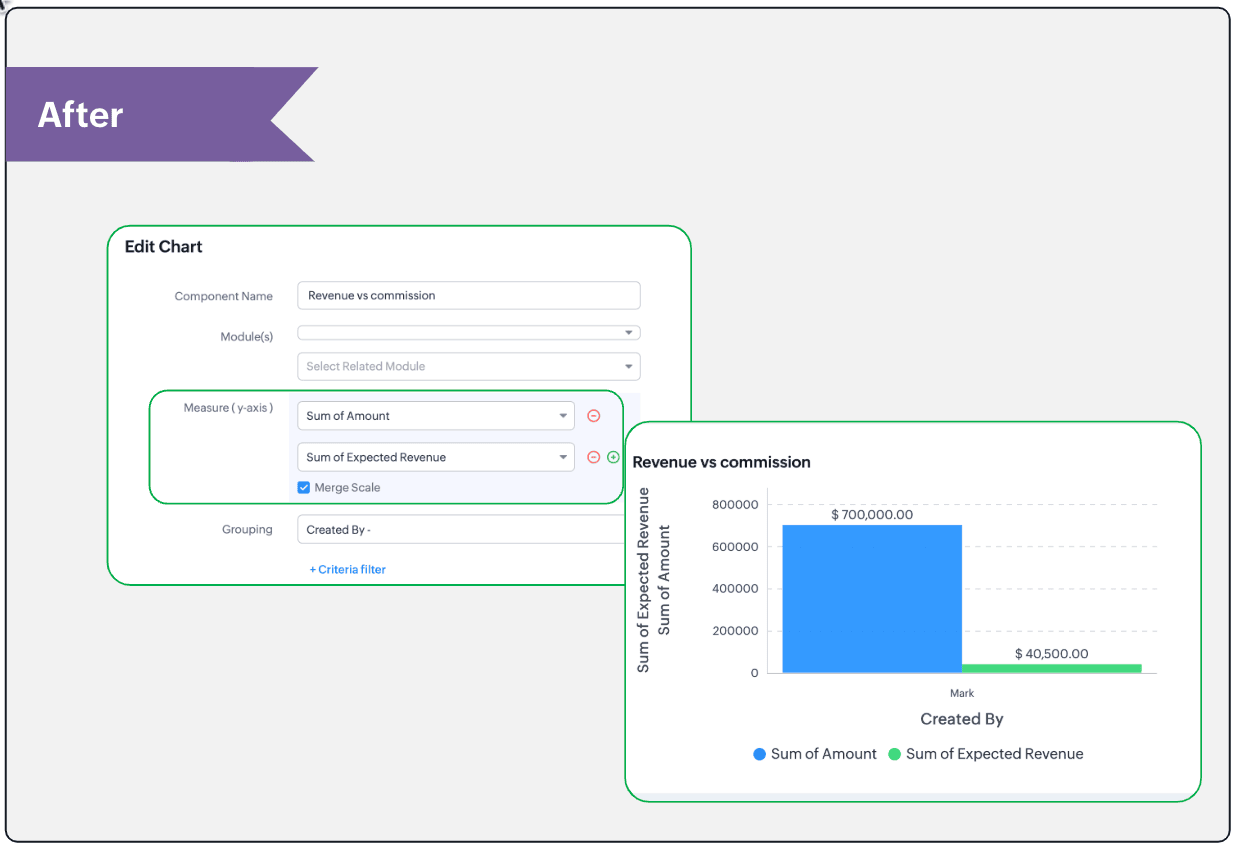
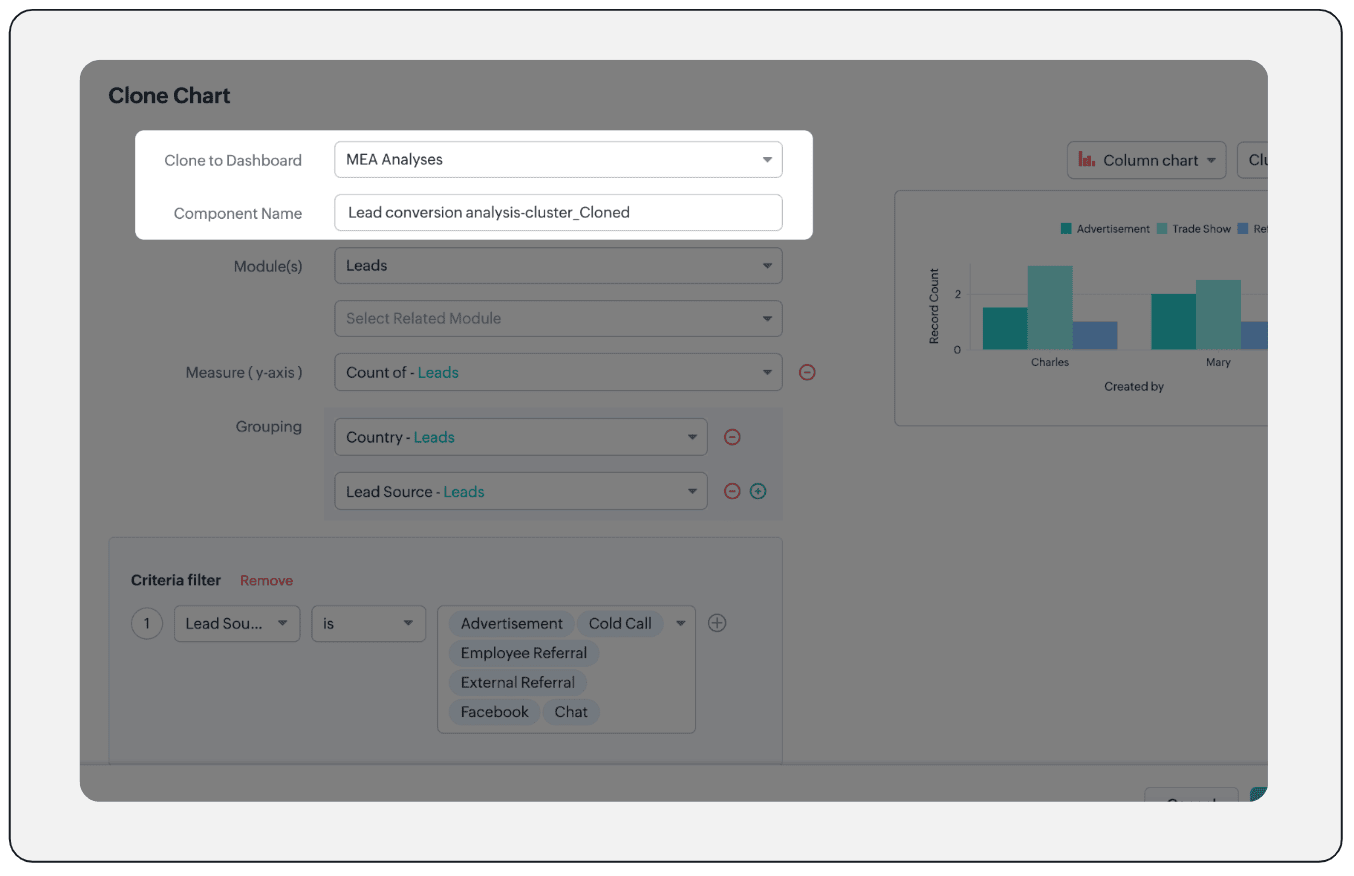
- Clone components to a different dashboard: Dashboards in Analytics serve in unique ways for various audiences—there can be separate dashboards for the sales team, marketing team, engineering team, and so on, and the chances of using the same measure for reference is common. Thus, when you clone a chart, you can now determine the target dashboard in which the cloned chart can be placed.
Resource: Help document
Thanks and have a good one!
Kind regards,
Saranya Balasubramanian
Saranya Balasubramanian
Topic Participants
Saranya Balasubramanian
Sticky Posts
Zoho CRM's sales trend and sales follow-up trend dashboards are now customizable
Dear Customers, We're here with good news! Sales trend and sales follow-up trend are two system-defined dashboards that help you understand trends and anomalies in your sales outreach and conversion efforts. They use Zia's intelligence to identify patternsIntroducing Multiple Sandbox Types and Support for Module's Data Population
Register here for the upcoming Focus Group webinar on Multiple Sandbox | Help documentation to learn more about the new enhancements Hello everyone, Sandbox in CRM is a testing environment for users to create and test new configurations like workflowGood news! Calendar in Zoho CRM gets a face lift
Dear Customers, We are delighted to unveil the revamped calendar UI in Zoho CRM. With a complete visual overhaul aligned with CRM for Everyone, the calendar now offers a more intuitive and flexible scheduling experience. What’s new? Distinguish activitiesVoC in Zoho CRM is now data savvy: Explore response drilldown, summary components and participation in CRM criteria
VoC has all the goods when it comes to customer intelligence—which is why we're constantly enhancing it. We recently added the following: A customer drilldown component that shows you the list of prospects and customers behind a chart's attribute ExpandedWrapping up 2025 on a high note: CRM Release Highlights of the year
Dear Customers, 2025 was an eventful year for us at Zoho CRM. We’ve had releases of all sizes and impact, and we are excited to look back, break it down, and rediscover them with you! Before we rewind—we’d like to take a minute and sincerely thank you
Recent Topics
Deprecation of the Zoho OAuth connector
Hello everyone, At Zoho, we continuously evaluate our integrations to ensure they meet the highest standards of security, reliability, and compliance. As part of these ongoing efforts, we've made the decision to deprecate the Zoho OAuth default connectorI need to know the IP address of ZOHO CRM.
The link below is the IP address for Analytics, do you have CRM's? IP address for Analytics I would like to know the IP address of ZOHO CRM to allow communication as the API server I am developing is also run from CRM. Moderation Update: The post belowImportant Update: Google Ads & YouTube Ads API Migration
To maintain platform performance and align with Google's newest requirements, we are updating the Google Ads and YouTube Ads integrations by migrating from API v19 to the newer v22, before the official deprecation of v19 on February 11, 2026. Reference:Zoho recruit's blueprint configuration is not functioning as mapped
Current Status: Zoho Blueprint is not functioning as configured. Issue: We are moving a Candidate status in Zoho Recruit "for active file" but we encountered: "Status cannot be changed for records involved in Blueprint." This happens to various clientBlocklist candidates in Zoho Recruit
We’re introducing Block Candidate, which helps recruiters to permanently restrict a candidate from applying to current/future job openings. Once the candidate is blocked, they will no longer be able to participate in the recruitment process. This willAdmin asked me for Backend Details when I wanted to verify my ZeptoMail Account
Please provide the backend details where you will be adding the SMTP/API information of ZeptoMail Who knows what this means?Zoho Desk - Upsert Ticket
Hi Desk Team, It is common to request more information from end-users. Using forms is a great way to ensure all the required information is collected. It would be great if there were an "upsert" option on the Zoho Form -> Zoho Desk integration which wouldAll new Address Field in Zoho CRM: maintain structured and accurate address inputs
The address field will be available exclusively for IN DC users. We'll keep you updated on the DC-specific rollout soon. It's currently available for all new sign-ups and for existing Zoho CRM orgs which are in the Professional edition. Latest updateClient Side Scripts for Meetings Module
Will zoho please add client side scripting support to the meetings module? Our workflow requires most meeting details have a specific format to work with other software we have. So we rely on a custom function to auto fill certain things. We currentlyIntroducing Multiple Sandbox Types and Support for Module's Data Population
Register here for the upcoming Focus Group webinar on Multiple Sandbox | Help documentation to learn more about the new enhancements Hello everyone, Sandbox in CRM is a testing environment for users to create and test new configurations like workflowCreator Offline
We had online access setup and working on our iphones. We have just set it up on an 'Android Tablet' and it is not downloading all the images? We use it to show customers our catalogue. Any ideas. Offline components all setup on both devicesUpdated font library: New font styles and custom font options in Zoho Sheet
Zoho Sheet's font library now supports 500+ font styles in 60+ languages! The updated font library is stacked with new font styles, and some of the previously available font styles have been replaced with equivalent options. There are two ways you canEnable or disable any Field Rule!
Hello Zoho Forms Community, We are excited to announce a powerful new enhancement to Field Rules that gives you greater control and flexibility in managing your form logic! Previously, if you wanted to temporarily deactivate a field rule, you had twoMarketing Tip #20: Increase traffic with strong meta titles and descriptions
Meta titles and descriptions are what people see first on search results before they ever click through to your website. If your pages use generic titles or basic descriptions, you miss the chance to stand out, and search engines may not know which pageKanban view on Zoho CRM mobile app!
What is Kanban? The name doesn't sound English, right? Yes, Kanban is a Japanese word which means 'Card you can see'. As per the meaning, Kanban in CRM is a type of list view in which the records will be displayed in cards and categorized under the givenNot able to delete a QC nor able to revert or create a cycle of manufacturing for QC failed Jobs
Not able to delete a QC nor able to revert or create a cycle of manufacturing for QC failed JobsDheeraj Sudan and Meenu Hinduja-How do I customize Zoho apps to suit my needs?
Hi Everyone, I'm Meenu Hinduja and my husband Dheeraj Sudan, run a business. I’m looking to tweak a few things to fit my needs, and I’d love to hear what customizations others have done. Any tips or examples would be super helpful! Regards Dheeraj Sudanis there any way to change the "chat with us now" to custom message?
is there any way to change the "chat with us now" to custom message? I want to change this textDeprecation Notice: OpenAI Assistants API will be shut down on August 26, 2026
I recieved this email from openAI what does it means for us that are using the integration and what should we do? Earlier this year, we shared our plan to deprecate the Assistants API once the Responses API reached feature parity. With the launch of Conversations,Capture Last check-in date & days since
I have two custom fields on my Account form, these are "Date of Last Check-In" and "Days Since Last Contact" Using a custom function how can I pull the date from the last check-in and display it in the field "Date of Last Check-In"? and then also display the number of days since last check-in in the "Days SInce Last Contact" field? I tried following a couple of examples but got myself into a bit of a muddle!Able to Send Emails from Zoho but Not Receiving Emails from Gmail
Hello, I am experiencing an issue with my shopify domain email setup and would appreciate your help. Current situation: I can successfully send emails using Zoho. I can receive emails from some services (for example, Facebook). However, I cannot receiveHAVING PROBLEM WITH SENDING EMAIL
Hi all, I'm unable to receive emails on info@germanforgirls.eu. I'm getting an error code 550. 5.1.1. invalid email recipients. Moreso, I would like info@germanforgirls.eu to be the default "send from" email and not solomon@germanforgirls.eu. Kindly seeSubscriptions for service call
So we install products and we want to offer a service contract for the customers yearly service calls to be billed monthly. So ideally at some point we want to email them a quote for their needs. WE will choice it our end based on the equipment. It wouldDelay in rendering Zoho Recruit - Careers in the ZappyWorks
I click on the Careers link (https://zappyworks.zohorecruit.com/jobs/Careers) on the ZappyWorks website expecting to see the job openings. The site redirects me to Zoho Recruit, but after the redirect, the page just stays blank for several seconds. I'mHow to add interviews through API
I'm trying to add an interview without much luck. The documentation gives examples of adding just about everything except an interview. However, the issue might be the way I'm formatting it, because the documentation is unclear to me. It seems as if the xml should be passed in the url, which seems unusual. I've tried the data as both plain and character escaped, but nothing seems to work, nor do I even get an error response. https://recruit.zoho.com/recruit/private/xml/Interviews/addRecords?authtoken=***&scope=recruitapi&version=2&xmlData=<Interviews> <rowConnection to other user
Zoho Cliq handles sharing of Custom OAuth Connections that require individual user logins.How to invite friends on other social media platforms to one of my group chats in arattai?
Hello, I have formed chat groups in arattai. I want to invite my friends on other social media platforms like WhatsApp/ FB to one of my groups. Different friends would be invited to different groups. How to share an invite link of one of my groups toCliq does not sync messages after Sleep on Mac
I'm using the mac app of Cliq. When I open my mac after it was in sleep mode, Cliq does not sync the messages that I received. I always have to reload using cmd + R, which is not what I want when using a chat application.Re: Ca.gory groups and not all email addresses being added to a group emails
Hi, I have added emails under 'Contacts' into categories but when sending a group email and putting the category name in not all email addresses go onto the email. I have refreshed the page, deleted and redone the info etc with no luck. I only found outBookings duration - days
Hi team, Is there any way to setup services/bookings that span multiple days? I am using Zoho Bookings for meeting room bookings. Clients may wish to book a room for more than one day, for up to a month. If not, is there a plan to allow services to be setup with durations of Days as well as hours and minutes? Many thanks, Anna.Set expiration date on document and send reminder
We have many company documents( for example business registration), work VISA documents. It will be nice if we can set a expiry date and set reminders ( for example 90 days, 60 days, 30 days etc.,) Does Zoho workdrive provide that option?Analytics : How to share to an external client ?
We have a use case where a client wants a portal so that several of his users can view dashboards that we have created for them in Zoho Analytics. They are not part of our company or Zoho One account. The clients want the ability to have user specific,Payroll and BAS ( Australian tax report format )
Hello , I am evaluating Zoho Books and I find the interface very intuitive and straight forward. My company is currently using Quickbooks Premier the Australian version. Before we can consider moving the service we would need to have the following addressed : 1.Payroll 2.BAS ( business activity statement ) for tax purposes 3.Some form of local backup and possible export of data to a widely accepted format. Regards Codrin MitinZoho Desk API - Send Reply to CUSTOMERPORTAL
Hello! I'll try to send a reply to Customer Portal, But the response is 500 (INTERNAL_SERVER_ERROR in service response). {"Error":"{\"errorCode\":\"INTERNAL_SERVER_ERROR\",\"message\":\"An internal server error occurred while performing this operation.\"}"}Python - code studio
Hi, I see the code studio is "coming soon". We have some files that will require some more complex transformation, is this feature far off? It appears to have been released in Zoho Analytics alreadyIssue with open-rate reporting in Zoho Campaigns
Hello, Since yesterday I’ve been experiencing an issue with the open-rate reports in Zoho Campaigns. The campaigns I send appear in the reports as if none of the emails have been opened, even though I know they have. To verify this, I replicated the campaignBest practices for managing Project Charters, Business Case and RAID logs within Zoho?
Hello everyone, I’m currently refining our PMO setup within Zoho Projects and I’m curious how others are handling high-level governance documentation. We’ve been using the standardized Project Charter, Business Case and RAID frameworks from projectmanagertemplate.comIs It Possible to Convert a Custom Module to a Quote?
I recently created a custom module in our CRM environment for RFQs so that our sales team can submit quote requests directly in Zoho rather than by email/phone. This allows for a cleaner overall process, minimizing potential errors and potentially encouragingProposal: Actionable API Error Messages to Reduce Support Ticket Volume
I've encountered a long-standing frustration with how Zoho Creator's API communicates errors to developers, and I'm hoping the Zoho team can address this in a future update. This issue has persisted for over 9 years based on community discussions, andAllocating inventory to specific SO's
Is there a way that allocate inventory to a specific sales order? For example, let's say we have 90 items in stock. Customer 1 orders 100 items. This allocates all 90 items to their order, and they have a back order for the remaining 10 items which couldNext Page