Customer Segmentation using RFM Analysis
How well do you know your customers? Whether you operate in a B2B or B2C space, chances are that 80% of your business comes from just 20% of your customers (Pareto's Principle). According to a study by Forbes, acquiring new customers costs five times more than retaining the existing ones. Identifying high-value customers is crucial to increase revenue and building brand loyalty.
Customer Segmentation is a critical strategy for businesses to understand and engage with customers effectively. Understanding the behavioral patterns of customers can help personalize the purchases they make and cater to their needs better.
Questions like who are the customers who contribute more to sales, who are the customers about to churn, will help digital marketers understand the behavioral patterns of their customers.
While there are many criteria based on which the customer base can be segmented, this solution focuses on segmenting customers based on the RFM analysis.
What is RFM Analysis?
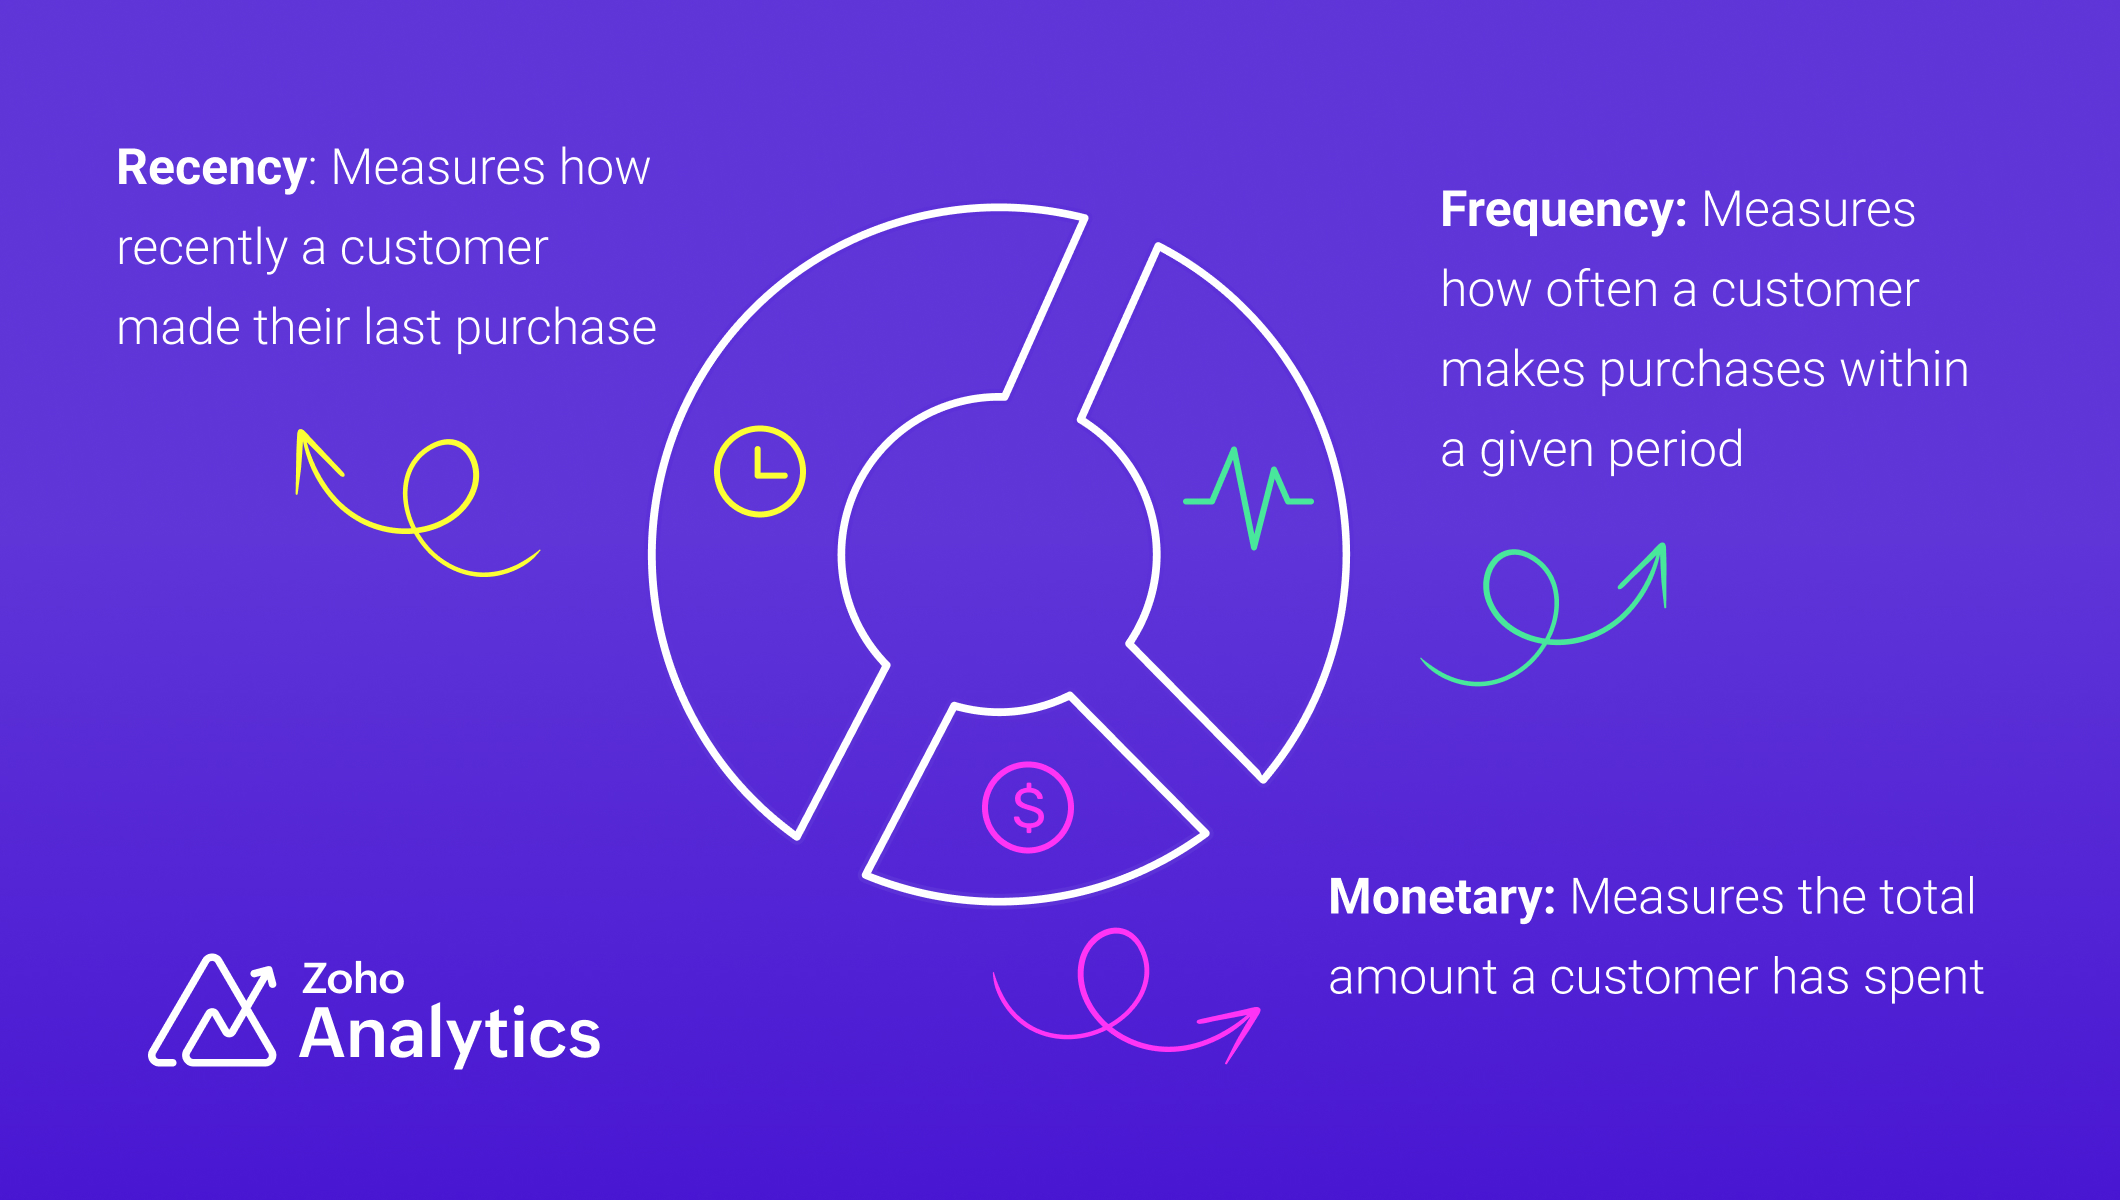
RFM analysis (Recency, Frequency and Monetary) is a method used to identify and segment existing customers based on their purchasing behavior. The key metrics of RFM analysis include
Recency
Recency refers to how recently a customer has made their purchase and this is the most important metric of the other metrics. This metric is a strong indicator of customer loyalty and interest.
Frequency
Frequency refers to how often a customer makes purchases or interacts with a business within a specific period. It measures the level of engagement and loyalty of a customer.
Monetary
Monetary value refers to the total amount of money a customer has spent with a business during a specific period.
Industry-Specific Applications of RFM Analysis
- SaaS and subscription services: RFM analysis can be adapted for SaaS and subscription services to segment users based on engagement, renewals, and revenue contribution.
- Financial Sector: RFM analysis can improve credit scoring and risk assessment by evaluating customer transaction patterns, helping financial institutions make more informed loan approval decisions.
Data Requirements
For RFM analysis, you'll need a transactional dataset with the following equivalent columns (details)
- A product (Product ID)
- A related transaction (Transaction ID)
- Number of products purchased in a transaction (Product Quantity)
- The product purchase price (Product Price)
- Transaction date (Date)
- Customer who made the purchase (Customer ID, Customer Name)
We have used a sample table of e-commerce data for illustration.
Steps for Implementing RFM analysis
1. Gather and Prepare Transaction Data :
Gather all transaction data, ensuring it includes customer identifiers, transaction dates, and monetary amounts, and address missing or inconsistent values, ensuring data integrity before analysis.
2. Compute RFM Metrics:
To segment customers based on their behavior, we compute three key metrics: Recency (R), Frequency (F), and Monetary Value (M). Below are SQL queries for each, along with detailed explanations.
Recency (R)
Recency measures how recently a customer made a purchase. It is calculated as the number of days since their last transaction. Customers with recent purchases are more engaged, while those who haven’t bought in a long time may be at risk of churn.
The time frame for RFM analysis should be tailored to your business model and industry. Choosing the right period for RFM analysis is essential, as it directly influences the accuracy of customer segmentation and the quality of insights derived.
Frequency (F)
Frequency tracks how often a customer makes purchases within a specific period. A higher frequency indicates a loyal customer who regularly shops, while a lower frequency suggests occasional or one-time buyers.
Monetary Value (M)
The total amount spent by the customer in the same period
RFM Query Table
|
SELECT
"Customer ID",
"Customer Name",
DAYS_BETWEEN(MAX("Transaction Date"), CURRENT_DATE()) AS "Recency",
COUNT ("Order ID") AS "Frequency",
SUM("Transaction Amount") AS "Monetary Value"
FROM "Customer Data"
GROUP BY "Customer ID",
"Customer Name"
ORDER BY "Recency" ASC,
"Frequency" DESC,
"Monetary Value" DESC
|
3. Segment Customers using Cluster Analysis
Manual scoring can skew the results and may not be practical for handling large volumes of data. In contrast, using machine learning algorithms like cluster analysis ensures unbiased, efficient, and data-driven segmentation. Unlike traditional scoring methods such as the quantile or percentile-based approach, cluster analysis recognizes inherent relationships and patterns in the data. With cluster analysis, business can obtain accurate segmentation and devise targeted strategies to improve sales and customer retention.
Follow the below steps to apply cluster analysis,
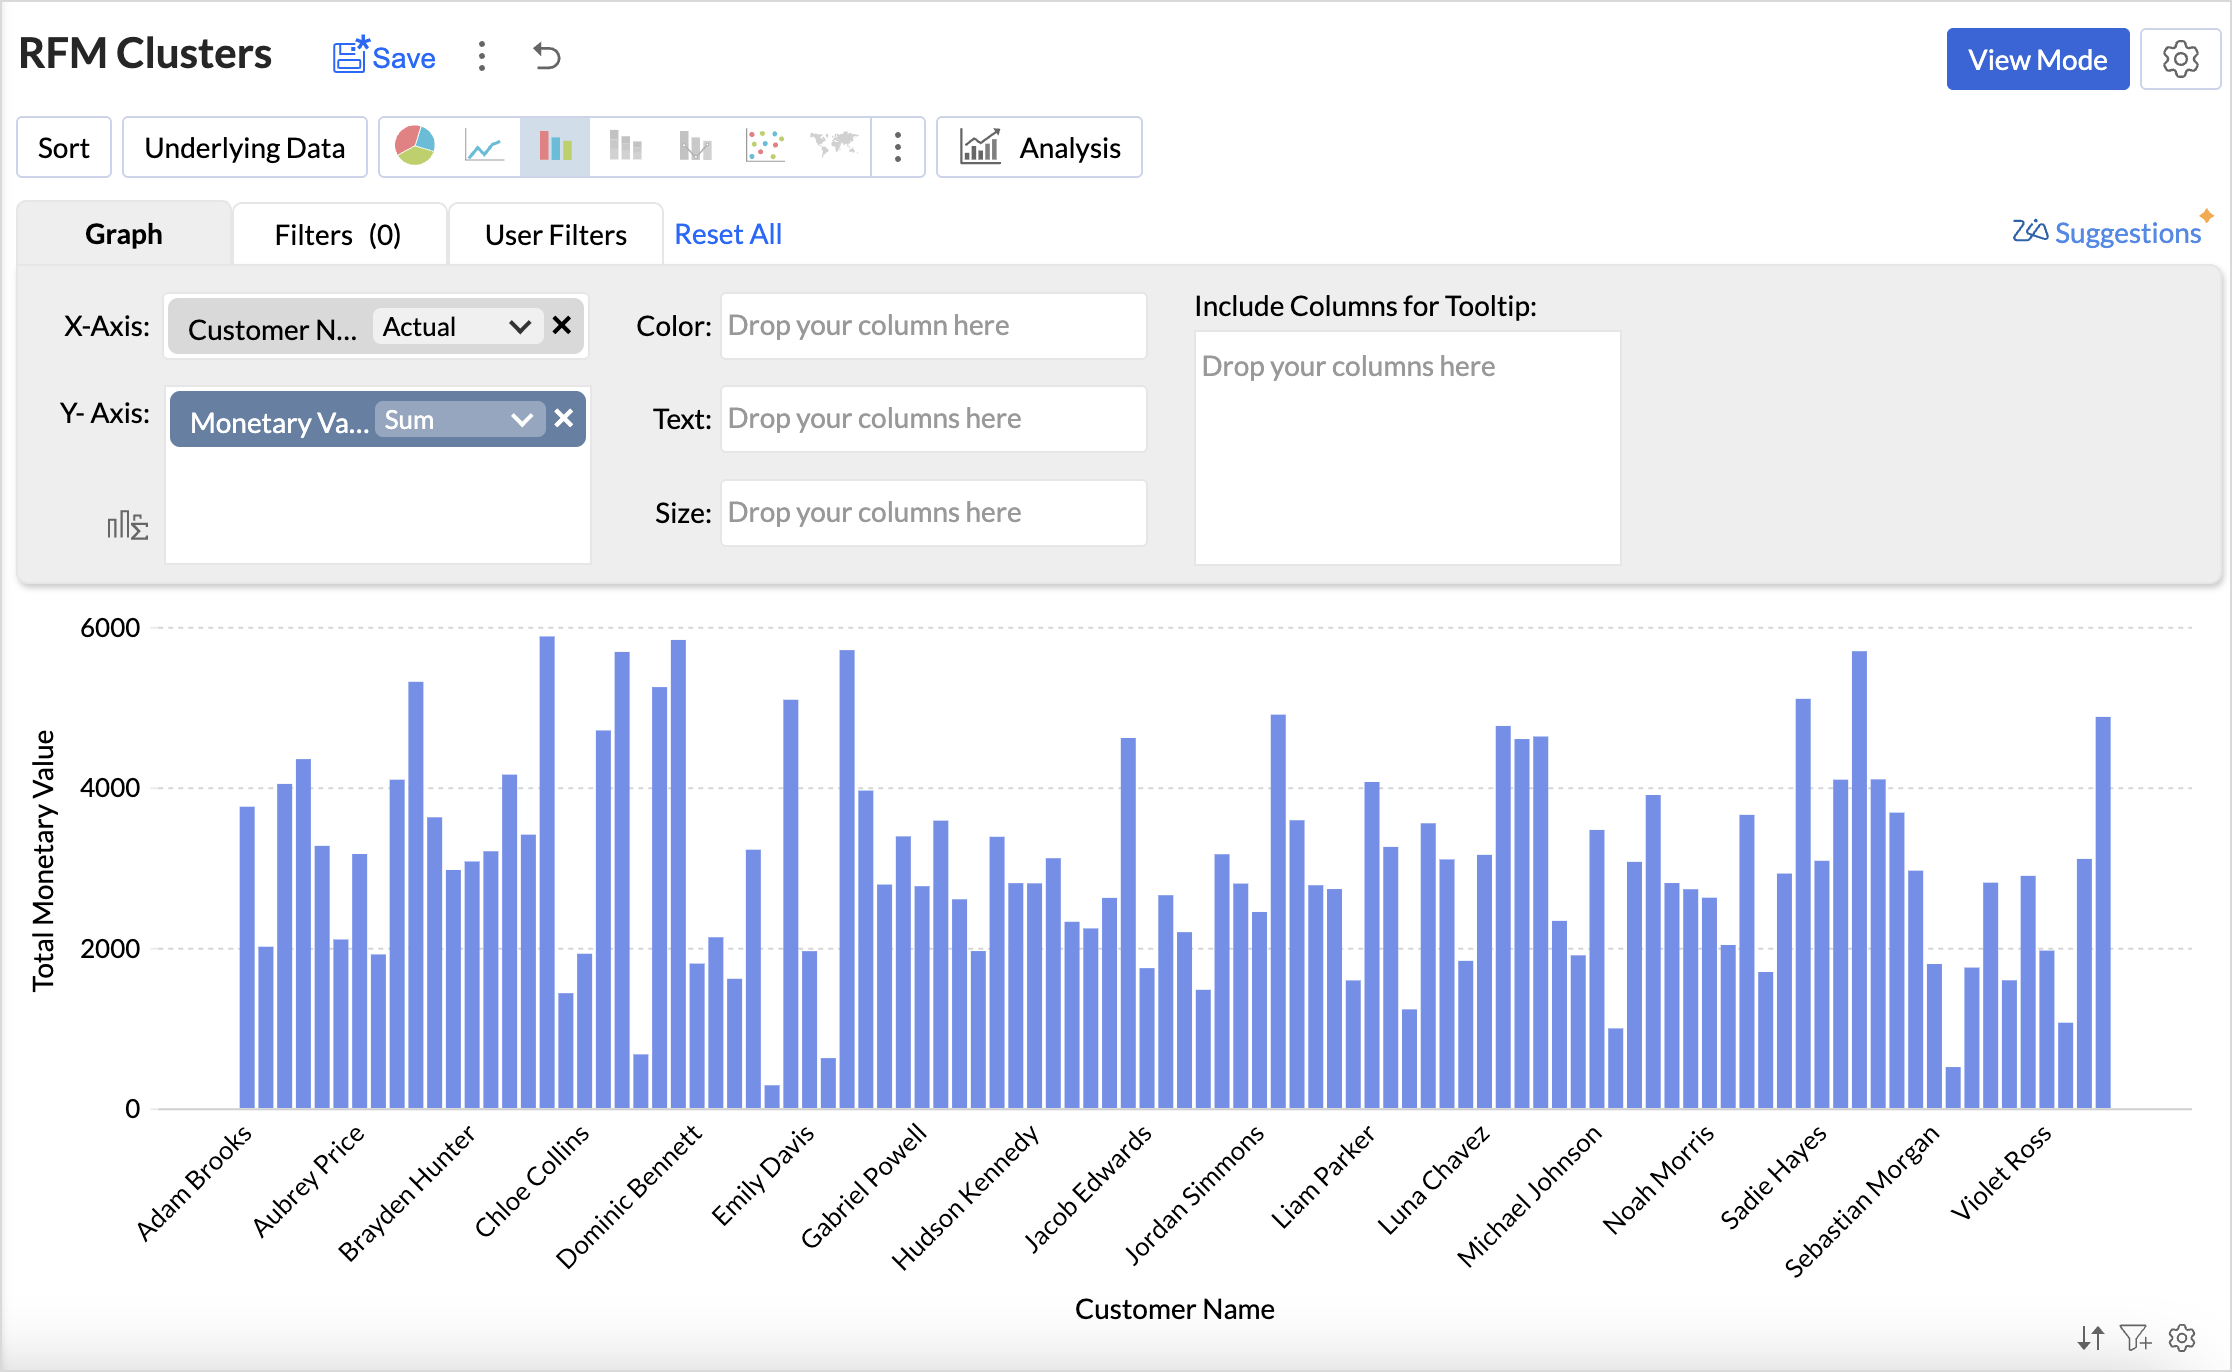
- Click the Create New icon and choose New chart from the drop-down menu.
- Add the columns to the chart shelf as shown below,
- X-axis: Customer Name
- Y-axis: Monetary Value with Sum function.
- Click Generate Graph and change the chart type to bar chart.
- Click the Analysis icon and select Cluster Analysis > Add Clusters.
- The Model is chosen automatically based on the columns dropped in the shelves.
- By default, the columns dropped in the shelves (Monetary Value) are selected as factors. Click the drop-down icon to include Recency and Frequency columns as factors.
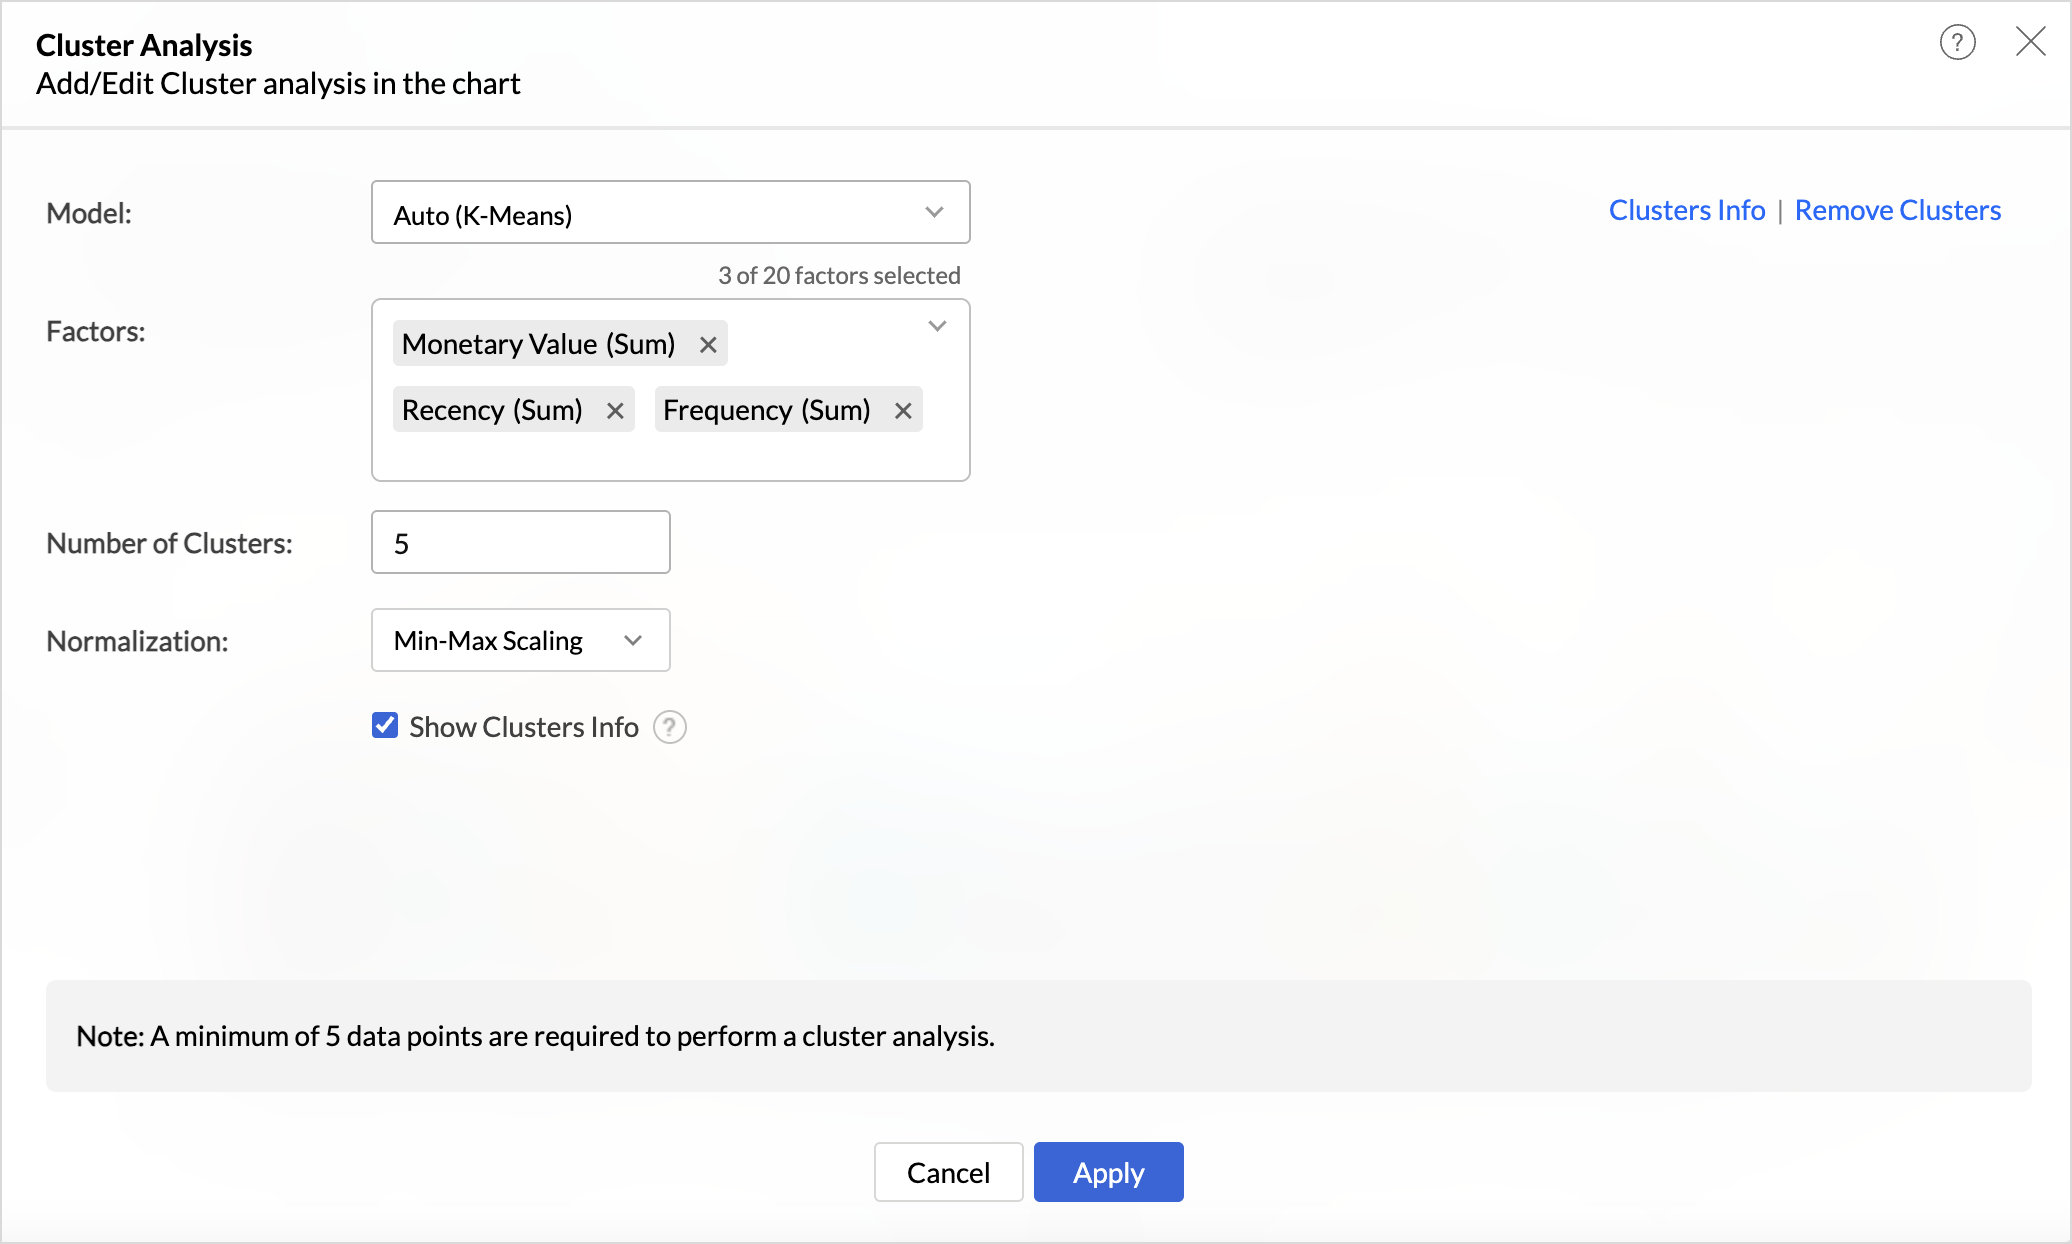
- The number of clusters is determined automatically but can be adjusted based on business needs and specific customer segmentation goals to ensure optimal categorization.
- Choose the Normalization method to prevent values of high ranges from dominating the results. For instance, Recency (measured in days) and Monetary Value (measured in currency) have different scales, and normalization ensures a balanced contribution from each metric.
- Click Apply.
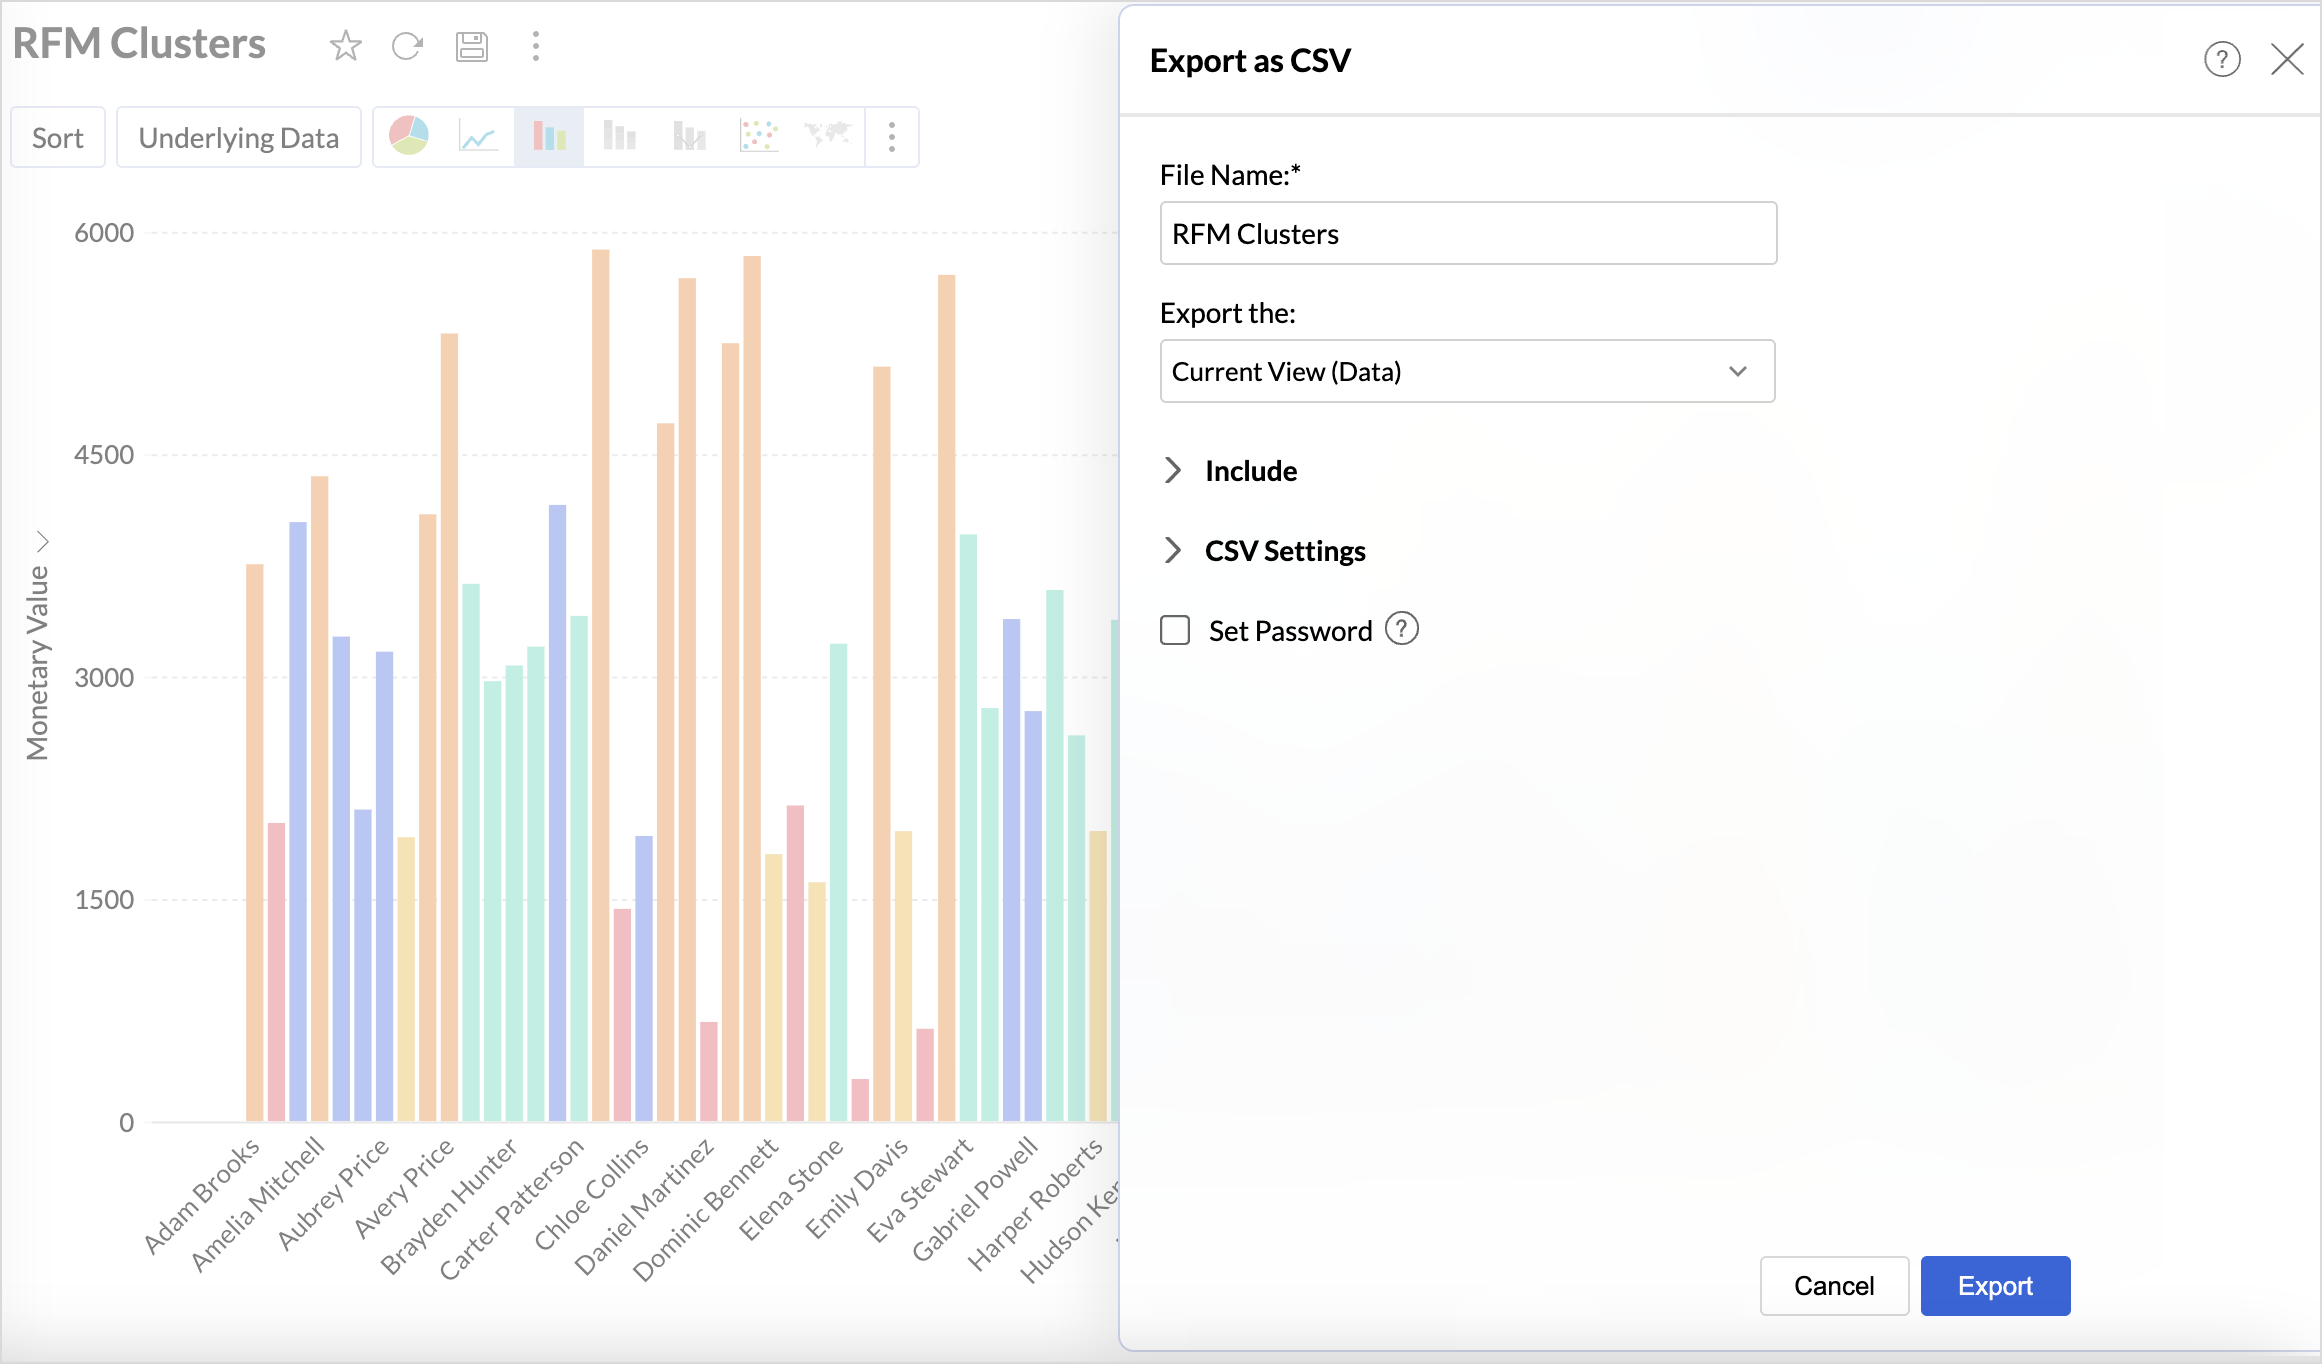
4. Export Clusters Data
Once the customer profiles have been segmented using cluster analysis, Export the Current view in the preferred table format to build more data visualizations to understand the clusters.
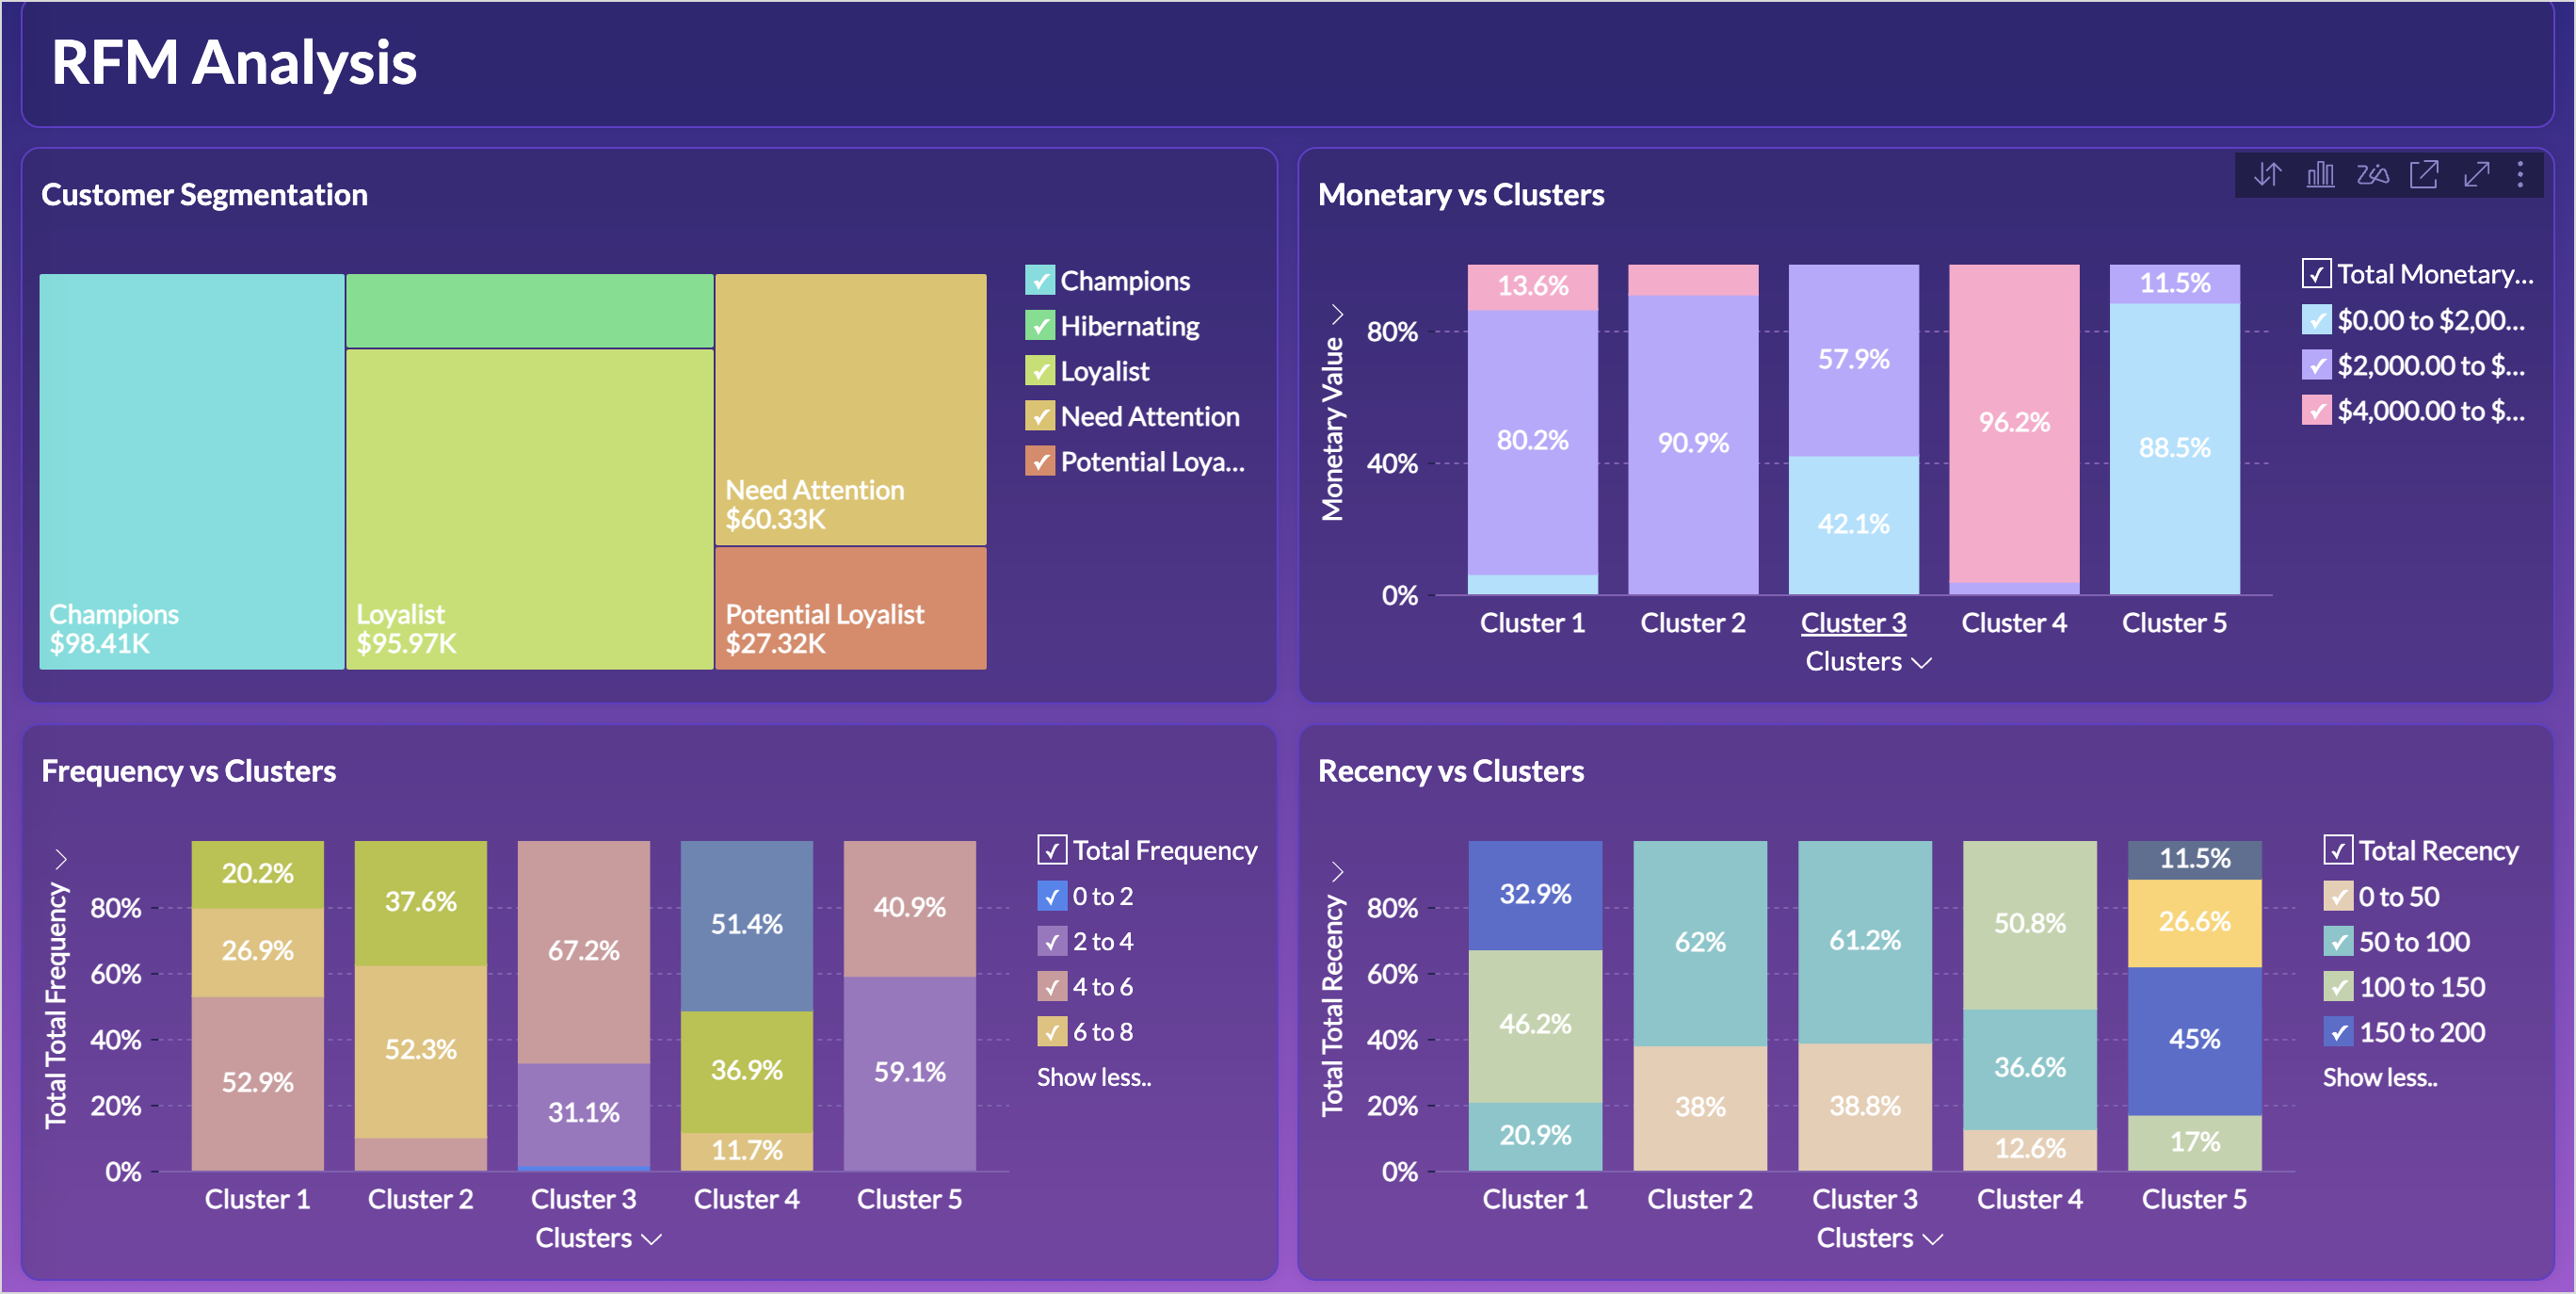
Build an RFM Analysis Dashboard
The RFM analysis dashboard provides a comprehensive view of customer behavior. Let's look at the steps involved in building this dashboard.
1. Import the Clusters Data
Import the downloaded clusters table back into Zoho Analytics using the files option as given below.
- Click the New icon on the side navigation panel and choose New Table/ Import Data.
- Select files and choose the Clusters Table to import and click Next.
- A data preview will be displayed; verify the data types of columns and click Create.
2. Create Reports to Understand the Characteristics of the Clusters
While the data is clustered, understanding the characteristics of each cluster is what enables businesses to take strategic actions. This includes identifying which customers need targeted marketing, personalized engagement, or retention efforts. Recognizing patterns within clusters provides insights into customer behavior, which is essential for optimizing marketing campaigns, improving retention strategies, and enhancing customer experience.
The below reports help understand the distribution of customers across different monetary value, recency and frequency segments within each cluster.
Clusters vs Monetary Value
- Access the cluster table (imported data) and click the new icon > chart view.
- Drag and drop the columns as given below:
- X-axis - Clusters
- Y-axis - Monetary Value with the Count function.
- Color - Monetary Value with the Actual Range function.
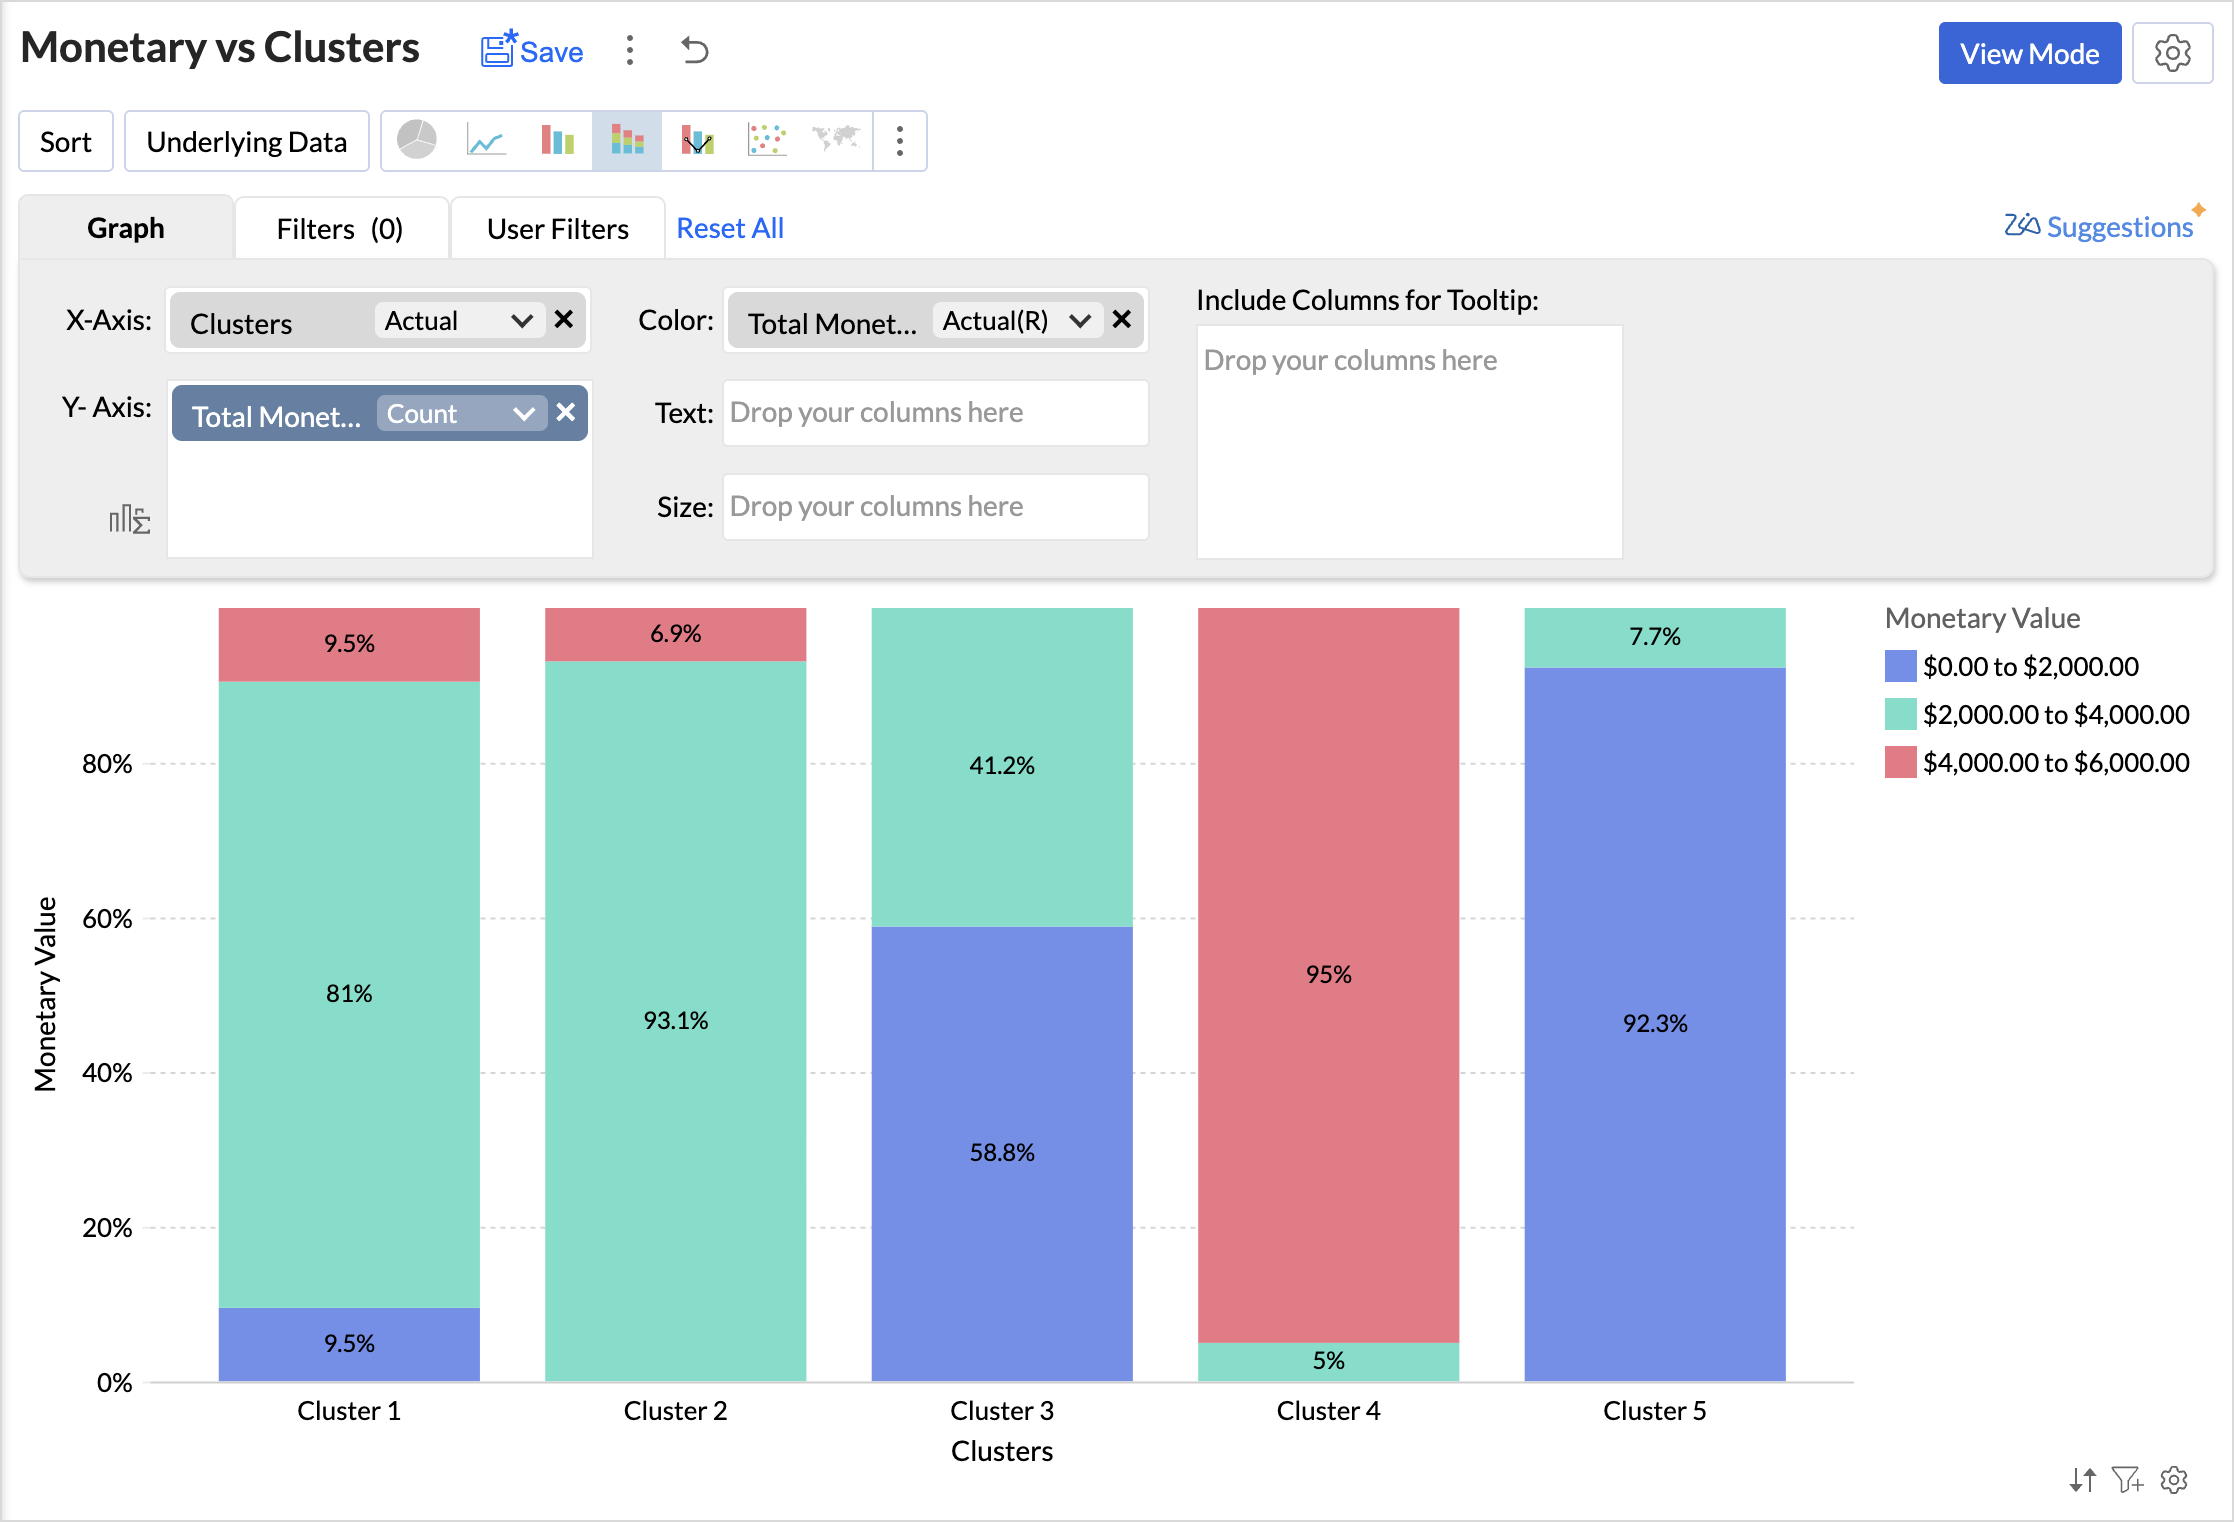
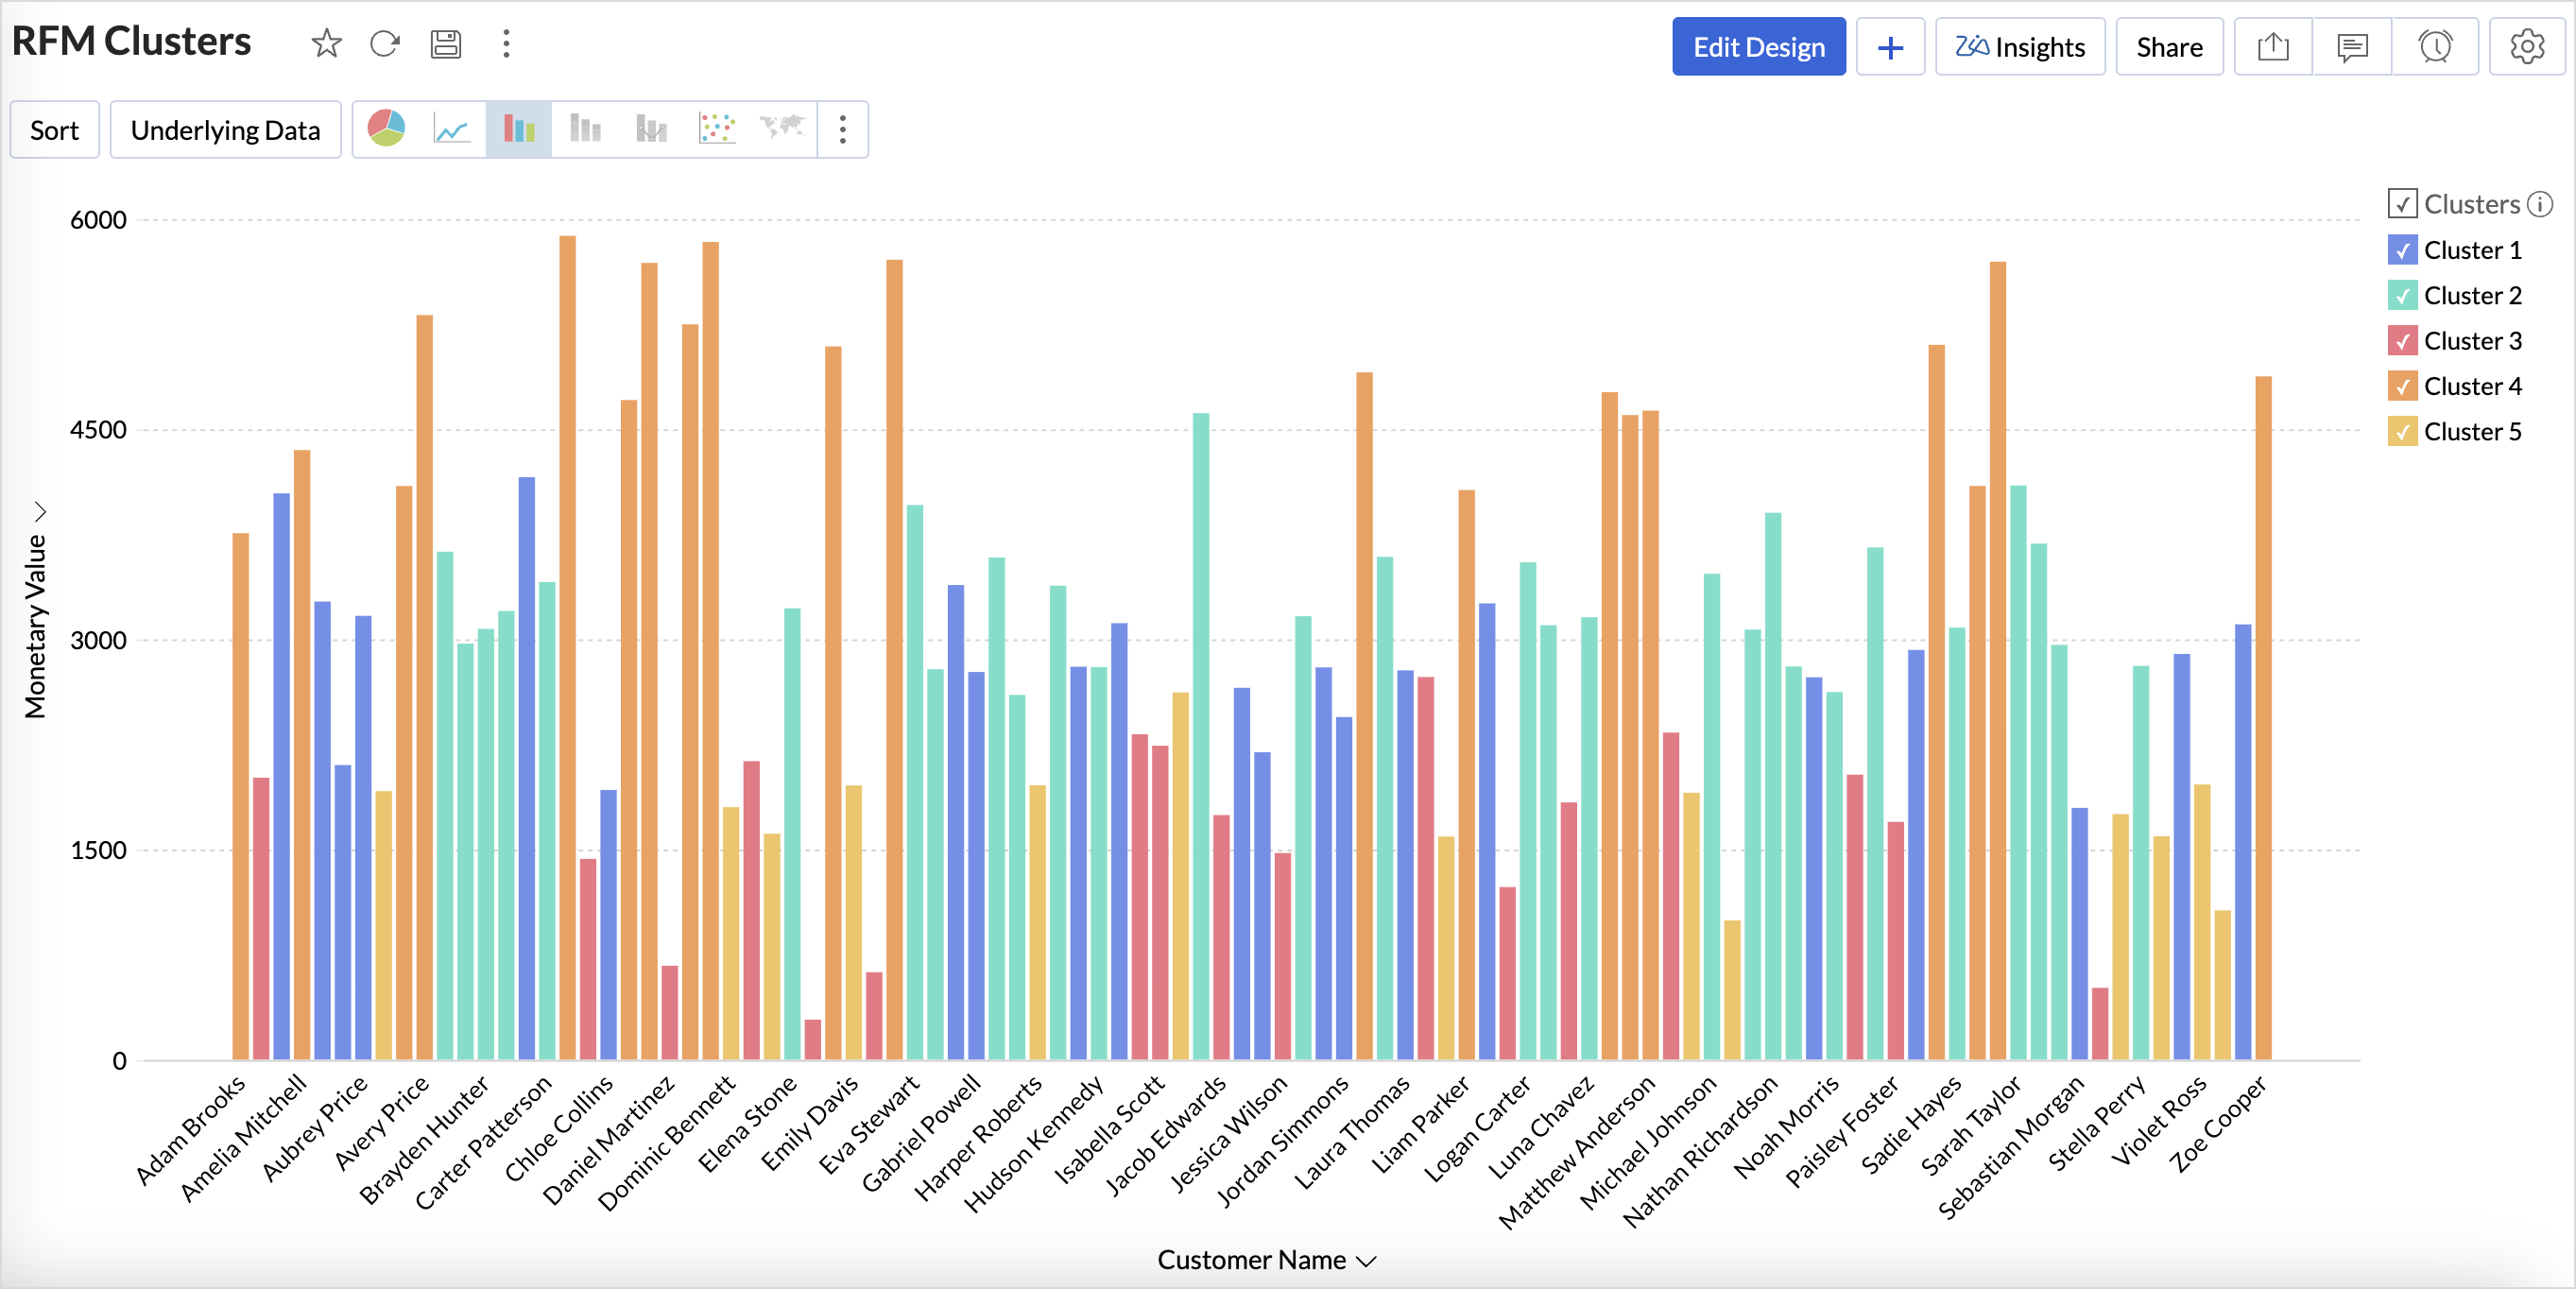
Analyzing the chart, we can infer that,
- Cluster 1 consists of a diverse group of customers spanning all spending levels.
- Cluster 2 includes moderate to high spenders who contribute significantly to revenue.
- Cluster 3 comprises low to mid-range spenders, often occasional buyers.
- Cluster 4 represents high-value customers with premium spending habits.
- Cluster 5 consists primarily of low spenders with minimal purchasing activity.
You can similarly create reports to know about the distribution of customers for the Recency and Frequency metrics.
The below table lists the characteristics of clusters
|
Cluster
|
Cluster Classification
|
Recency
|
Frequency
|
Monetary
|
Recommended actions
|
|
Cluster 1
|
Needs Attention
|
100 to 150 days
|
Low to Moderate
|
Diverse spending
|
Re-engagement campaigns, discounts, or reminders to encourage repeat purchases.
|
|
Cluster 2
|
Loyalist
|
0-50 (Highly Active)
|
High
|
Consistent moderate-to-high spenders
|
Loyalty programs, exclusive deals, early access to new products to maintain engagement.
|
|
Cluster 3
|
Potential Loyalist
|
0-50 (Active)
|
Low to Moderate | Budget-conscious, occasional buyers | Cross-selling, personalized recommendations, and value-based promotions. |
|
Cluster 4
|
Champions
|
100-150 (Inactive)
|
Moderate to High (Frequent buyers)
|
High spenders
|
VIP experiences, personalized services, and premium offers to retain and enhance their spending.
|
|
Cluster 5
|
Hibernating
|
Mostly inactive or infrequent
|
Low
|
Minimal spending
|
Win-back campaigns, incentives, special discounts, and targeted ads to regain interest.
|
Based on the above table, you can give specific labels to the clusters using the bucket columns option.
RFM Dashboard
Limitations & Considerations of RFM Analysis
While RFM analysis is a powerful customer segmentation tool, businesses should be aware of certain limitations and factors that can influence results:
- Data Freshness and Relevance: RFM analysis relies on transactional data, making the freshness and relevance of this data crucial for accurate customer segmentation. Setting up automated data imports ensures real-time updates, reducing the risk of working with stale data.
- Seasonal Variations: Customer purchasing behavior often fluctuates due to seasonal trends, holidays, and industry-specific cycles, which can impact RFM scores and lead to misleading segmentation if not accounted for properly. Instead of analyzing only recent months, compare customer behavior for the same period in previous years to detect true engagement patterns.
Topic Participants
Nisha Angel J
Hammer Group
Juan
Sticky Posts
What's New in Zoho Analytics - February 2026
Hello Users! We're back with another round of updates for Zoho Analytics. This month's release focuses on giving you greater flexibility in how you visualize, manage, and act on your data - with new features like custom visualizations, remote MCP server,What's New in Zoho Analytics - January 2026
Hello Users! We are starting the year with a strong lineup of updates, marking the beginning of many improvements planned to enhance your analytics experience. Explore the latest improvements built to boost performance, simplify analysis, and help youWhat's New in Zoho Analytics - November 2025
We're thrilled to announce a significant update focused on expanding your data connectivity, enhancing visualization capabilities, and delivering a more powerful, intuitive, and performant analytics experience. Here’s a look at what’s new. Explore What'sWhat's New in Zoho Analytics - October 2025
Hello Users! We're are back with a fresh set of updates and enhancements to make data analysis faster and more insightful. Take a quick look at what’s new and see how these updates can power up your reports and dashboards. Explore What's New! ExtremeWhat’s New in Zoho Analytics – September 2025
Hello Users!! In this month’s update, we’re raising the bar across multiple touchpoints, from how you bring in data, plan and track projects to how you design and brand your dashboards. We’ve added the all-new Gantt chart for project visualization, expanded
Recent Topics
Zoho CRM Community Digest - January 2026 | Part 2
Hello Everyone! Here’s the second part of January’s Zoho CRM Community Digest, rounding up the remaining highlights from the month. From newly rolled out updates to thoughtful implementation questions and practical solutions, the community once againFind and Merge Duplicates to trigger webhook
My sales team uses the Find and Merge Duplicates feature often to cleanup records in the CRM. We use webhooks to signal to our internal tools database when new Contacts are created, updated, or deleted, in order to keep our DB in sync with Zoho CRM. However,Introducing WhatsApp integration and quick editing capabilities in Zoho Sign
Hi there, Zoho Sign already helps users collect signatures via email and SMS, and we're happy to announce that you can now send documents and authenticate recipients right through WhatsApp. Some of the key benefits include: Communication with recipientsDynamic Field Folders in OneDrive
Hi, With the 2 options today we have either a Dynamic Parent Folder and lots of attachments all in that one folder with only the ability to set the file name (Which is also not incremented so if I upload 5 photos to one field they are all named the sameLogging Out of FSM
I have tried to log out of FSM app of the last person and it will not let me do so. I need to log in to my account.Manage Every Customer Conversation from Every Channel inside Zoho SalesIQ
Your customers message you from everywhere. But are you really able to track, manage, and follow through on every conversation, without missing anything? With interactions coming in from websites, mobile apps, and messaging platforms like WhatsApp andSuper Admin Logging in as another User
How can a Super Admin login as another user. For example, I have a sales rep that is having issues with their Accounts and I want to view their Zoho Account with out having to do a GTM and sharing screens. Moderation Update (8th Aug 2025): We are workingEnhancement in Zoho CRM: Control who gets to participate in a forecast by customizing the user hierarchy
Include only users from the sales function; exclude the rest Dear Customers, We hope you're well! We started this year with a series of exciting enhancements to Zoho CRM and to this list, we are thrilled to add an enhancement to forecasting. Let's talkMultiple Zoho One accounts
Hello. I'm searching for a solution to run multiple organizations under 1 Zoho One account or have a different Zoho One account for each organization and still be able to easily login to each. Currently Zoho One doesn't allow the same email address toTips and tricks #63: Hold and Drag to select elements in the Show app for iOS
Hello everyone! Welcome to another tips and tricks article. In today's article, we will learn about the Hold and Drag function in the Show app for iOS. The Hold and Drag option lets you select multiple elements on a slide quickly. Once they are selected,Organize and manage PDFs with Zoho PDF Editor's dashboard
Hello users, Zoho PDF Editor's dashboard is a one-stop place to upload, sort, share PDF files, and more. This article will explore the various capabilities that Zoho PDF Editor's dashboard offers. A few highlights of Zoho PDF Editor's dashboard: UploadPossible to generate/download Quote PDF using REST API?
See title. Is there any way after a quote has been created to export to a PDF using a specified template and then download it? Seems like something that should be doable. Is this not supported in the API v2.0?Free Webinar - AI for email: Helpful or Hype?
Hello, Zoho Mail community! 👋 We're kicking things off with a webinar you won't want to miss—and yes, we're going there: Is AI in email actually useful, or is it all hype? In this session, two of our experts will have an open, no-fluff conversation aboutBalancing access, security, and productivity with Email Policy
An organization typically includes multiple user groups, such as leadership, sales, and support, each with different email usage patterns and security needs. Administrators must balance flexibility and control, thereby ensuring email usage aligns withIs it possible to update multiple work items at once?
Hi, Is it possible to update the statuses/release tags of multiple work items at once? I came across this thread that says it's not possible at the moment, but it was related to the Sprints mobile app. Does this feature not exist in the website as well?See Every IM Conversation as It Happens
Instant messaging moves fast. Customers expect quick replies and smooth conversations across WhatsApp, Instagram, Facebook, and live chat. But without real-time visibility, small issues become big problems. A session stays open longer than expected. ADealing With One-Time Customers on Zoho Books
Hello there! I am trying to figure out a way to handle One-Time customers without having to create multiple accounts for every single one on Zoho Books. I understand that I can create a placeholder account called "Walk-In Customer", for example, but ISelected date present employees roster
=CHOOSECOLS(FILTER(A2:E5;(INDEX(C2:E5;0;MATCH(VALUE(B8);INDEX(VALUE(C1:E1));0))<>"OFF")*(INDEX(C2:E5;0;MATCH(VALUE(B8);INDEX(VALUE(C1:E1));0))<>"EL"));1;2;2+MATCH(VALUE(B8);INDEX(VALUE(C1:E1));0)) This way sheet looks lRelease Notes | January 2026
We have rolled out a set of powerful new enhancements across Zoho Vertical Studio that bring several long-awaited capabilities to your applications. These updates focus on deeper customization, smarter automation, better reporting, and improved usabilityProduct Request: Send email to Secondary email
Guys, we should be able to send the campaign to the secondary email too. Is this on the plans for Zoho Campaign? It looks like I can map the secondary email from the CRM to the Campaigs, but can not send the message.Depositing funds to account
Hello, I have been using Quickbooks for many years but am considering moving to Zoho Books so I am currently running through various workflows and am working on the Invoicing aspect. In QB, the process is to create an invoice, receive payment and thenFranchise
Is there a solution of how to organize global franchise organisations?Recording overpayment?
So a customer just overpaid me and how do I record this? I can't enter an amount that is higher than the invoice amount. Eg. Invoice is $195 and he sent $200. He's a reccuring customer so is there a way to record so that he has a $5 advance for future invoice?Holidays
Hi; For defining Holidays, you need to add logic to handle the year as well as the month & day. We need to be able to enter Holidays for the next year. I need to add a holiday for January 2, 2017, but I can't until January 1st, which is a Sunday and weComposite Product (kit) - Dynamic Pricing
I am setting up Composite Products for item kits that I sell. I also sell the items from the kit individually. Problem is when pricing changes on an individual part, the Composite Product price does not change meaning when the cost of item # 2 in theUrgent: Slow Loading Issue on Zoho Commerce Website
Dear Zoho Support Team, I am experiencing slow loading times on my Zoho Commerce website, which is affecting its performance and user experience. The issue persists across different devices and networks. Could you please investigate this matter and provideNeed help with importing expenses
I'm using the template downloaded from the application. When I try to import my expenses, I get the message: Duplicate entry in the Expense Date column. Ensure it contains unique values. None of the rows will import. There are duplicate dates, but theyClient Portal ZOHO ONE
Dear Zoho one is fantastic option for companies but it seems to me that it is still an aggregation of aps let me explain I have zoho books with client portal so client access their invoice then I have zoho project with client portal so they can access their project but not their invoice without another URL another LOGIN Are you planning in creating a beautiful UI portal for client so we can control access to client in one location to multiple aps at least unify project and invoice aps that wouldSearch not working!
I have items in my notebook tagged but when I search for a tag nothing comes up! Any fix for this?ERROR CODE :550 - 550 5.1.1 Invalid email recipients
This message was created automatically by mail delivery software. A message that you sent could not be delivered to one or more of its recipients. This is a permanent error. mustafa.ashraf@techlink-eg.net, ERROR CODE :550 - 550 5.1.1 Invalid email recipientsWhat's New in Zoho POS - February 2026
Hello everyone, Welcome to Zoho POS’s monthly updates, where we share our latest feature updates, enhancements, events, and more. Let’s take a look at how February went. Purchase and sell items on different units We have introduced a unit conversion functionalityCan i integrate bigin with google voice?
I make all my calling through google voice to seprate my personal line from business. I want to log my calls with customers automatically but i domt see anywhere where i can do that. Any help? Im pretty sure i wont be able to. SadPOP/SMTP access authentication failed
I am unable to log setup outlook for my zoho mail account. I am using these settings poppro.zoho.com port 995 SSL smtp.zoho.com port 587(tls)/465(ssl) username/password works on mail.zoho.com but not with POP access. Can you help?Our Review Of Zoho CRM after 60 Days
The purpose of this is to just share with Zoho why I love their product, but ultimately why I could not choose Zoho CRM for our next CRM. About two months ago we begun a CRM exploration process for our financial planning firm, based in Texas. We alreadyError AS101 when adding new email alias
Hi, I am trying to add apple@(mydomain).com The error AS101 is shown while I try to add the alias.This domain is not allowed to add. Please contact support-as@zohocorp.com for further details
I am trying to setup the free version of Zoho Mail. When I tried to add my domain, theselfreunion.com I got the error message that is the subject of this Topic. I've read your other community forum topics, and this is NOT a free domain. So what is theAllow Admin to Configure Report > More Options Button
As an Admin, I want to configure the options of the Report > More Options button to improve UX and reduce Developer overhead. See attached screenshot. Original question posted here: https://help.zoho.com/portal/en/community/topic/modify-standard-repGenerate a link for Zoho Sign we can copy and use in a separate email
Please consider adding functionality that would all a user to copy a reminder link so that we can include it in a personalized email instead of sending a Zoho reminder. Or, allow us to customize the reminder email. Use Case: We have clients we need toYou cannot send this campaign as there is no contact in the selected mailing list.
We have synced contact lists and sent campaigns just fine prior to today. Now no matter what list I upload when I go to send the campaign it gives an error "You cannot send this campaign as there is no contact in the selected mailing list." And now itPivot Report Formula - using a today() variable
Is it possible for me to use a value of today() in a formula on a pivot table? I'm trying to identify where the end date of a project is greater than the current date if("10. Projects (Zoho Projects).End Date" > today(), 'Yes', 'No') I get the error thatNext Page