Tip #73 - Exploring Technician Console: Diagnostics - 'Insider Insights'
Hello Zoho Assist Community!
Say you're remotely supporting a client whose machine is behaving erratically. Applications are freezing, services keep stopping on their own, and the user has no idea what's going wrong under the hood. You need to dig deeper, but switching between tools, asking the user to open Task Manager, or guiding them through the Registry Editor step by step takes precious time, and one wrong click on their end can make things worse.
That's exactly the problem the Diagnostics in Zoho Assist is built to solve.
What is the Diagnostics feature?
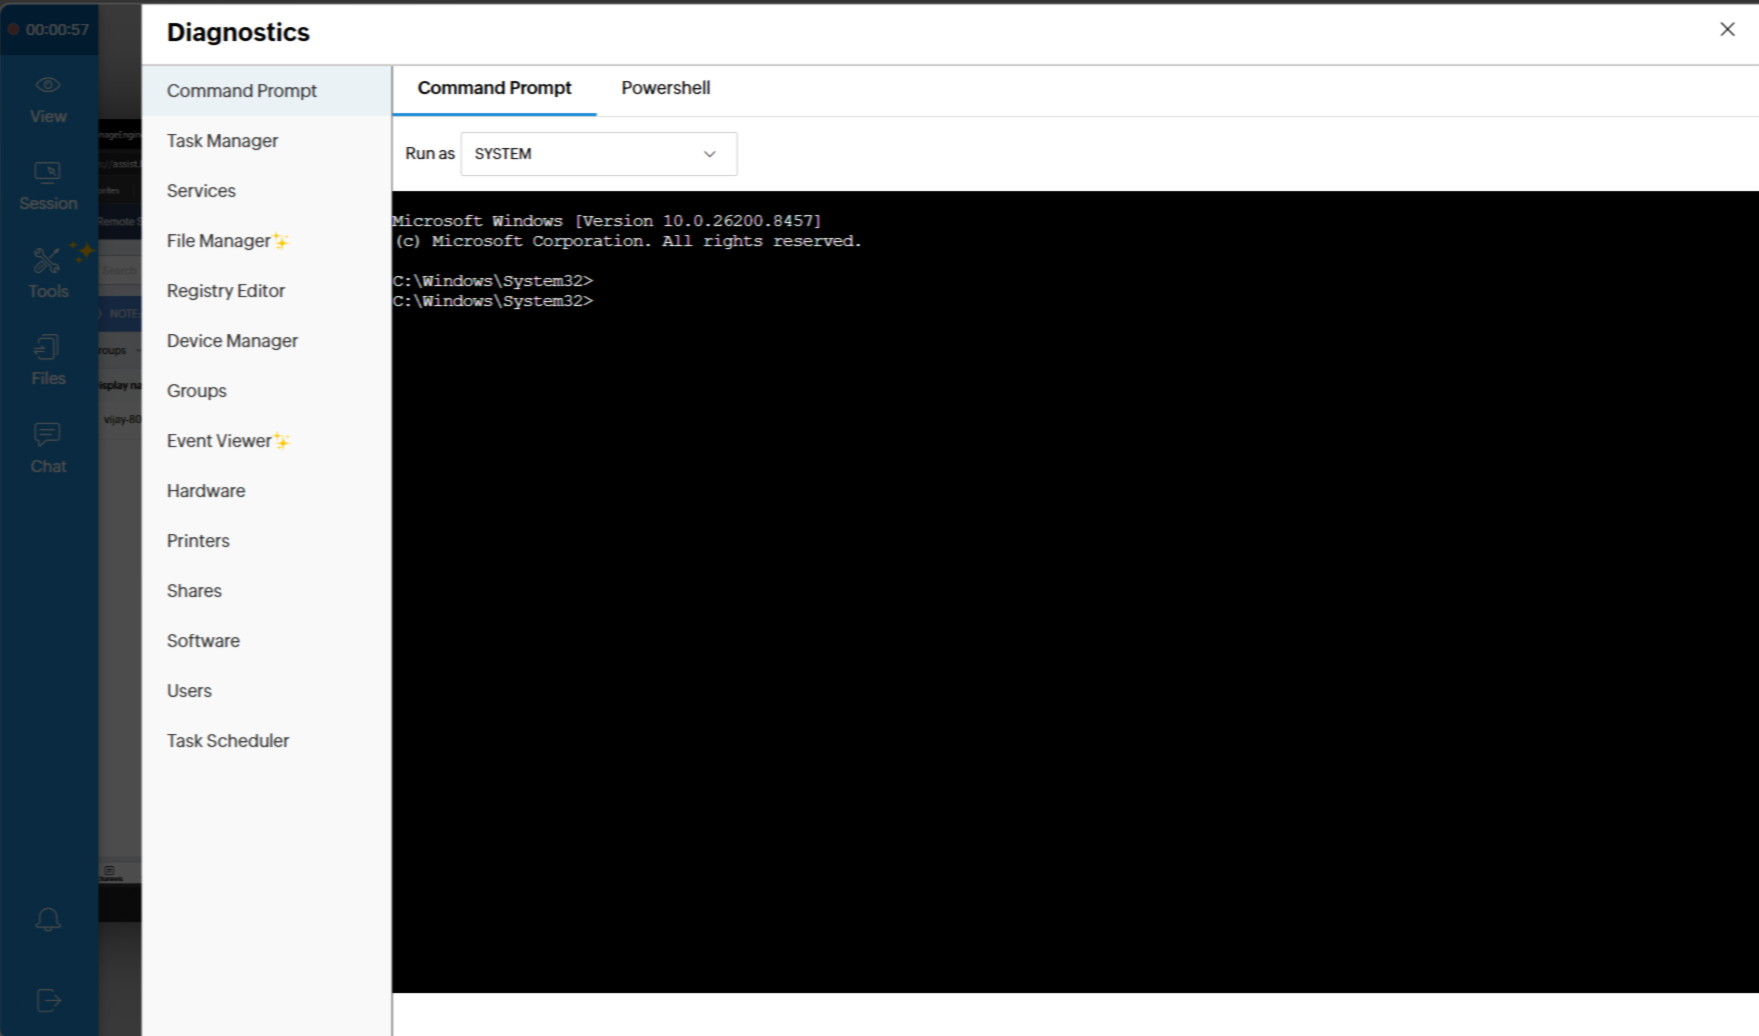
The Diagnostics tool is a centralized diagnostic and management panel available to technicians during an active remote support session. It opens a dedicated interface with two built-in terminals, Command Prompt and PowerShell, along with a full set of system management tools accessible from the left sidebar. Terminals can be run as SYSTEM for elevated access, giving technicians the permissions needed to execute administrative commands without additional steps.
The sidebar includes:
Command Prompt / PowerShell — Run commands directly on the remote machine with SYSTEM-level privileges
Task Manager — View and manage running processes in real time
Services — Start, stop, or restart system services without navigating the remote desktop
File Manager — Browse, access, and manage files on the remote machine
Registry Editor — View and edit registry keys directly from the session
Device Manager — Check device status and driver information
Groups and Users — Manage local accounts and group memberships
Event Viewer — Review system, application, and security logs to trace errors
Hardware — Check hardware configuration and connected devices
Printers and Shares — Manage printers and shared network resources
Software — View installed applications
Task Scheduler — Review and manage scheduled tasks
All of this is available without ever needing to share control of the mouse or guide the user through their own system.
How to access it
During an active remote session, open the Technician Console and navigate to Tools → Diagnostics. The panel opens instantly, and you can switch between tools using the left sidebar. Select Command Prompt or PowerShell, set the Run as option to SYSTEM, and start executing commands right away.
The Diagnostics tool eliminates the back-and-forth that slows down support sessions. Instead of asking users to open Event Viewer, navigate to Services, or describe what they see in Device Manager, you handle it all directly. This is especially valuable when:
Diagnosing intermittent issues — Pull Event Viewer logs and run diagnostics in real time without waiting for a user to describe symptoms
Fiing service failures — Restart a stopped service in seconds from the Services panel, without touching the remote desktop
Auditing system state — Check installed software, scheduled tasks, and hardware config as part of a routine support or onboarding session
Executing admin commands — Run elevated PowerShell or CMD scripts directly, with SYSTEM permissions, in a clean and controlled environment
Managing accounts — Add or remove local users and adjust group membership on the spot
Whether you're supporting a single endpoint or managing a fleet of machines for an enterprise client, having all of this in one place — right inside the session — keeps your workflow clean and your resolution times short.
Have you used the Diagnostics tool in your support sessions? Whether it helped you crack a tricky issue, streamline a routine task, or simply saved you from a long round of back-and-forth, we'd love to hear about it in the comments below.
And if you have questions or need help getting started, reach out to us at support@zohoassist.com — we're always here to help!