Introducing the Zoho Survey add-on for Zoho Show

Data helps make presentations more convincing, but adding it isn’t always simple. It usually comes from multiple sources like spreadsheets, analytics tools, and more, making it tedious and resulting in human errors.
At Zoho Show, we’re always looking for ways to make this easier. That’s why we’ve introduced features like Diagrams, Data Fields, and the Zoho Analytics add-on. Recently, adding to this list, we have introduced the Zoho Survey add-on for Zoho Show.How can the Survey add-on help you?
Imagine you’re preparing a presentation to review your product’s performance. You might want to include key metrics, such as most used features or customer satisfaction ratings from your recent survey, to highlight customer sentiment.
With Zoho Show’s integration with Zoho Survey, you can easily add your survey results to your presentation as charts without switching tabs or downloading files.
How do you insert results from Zoho Survey as a chart in Zoho Show?
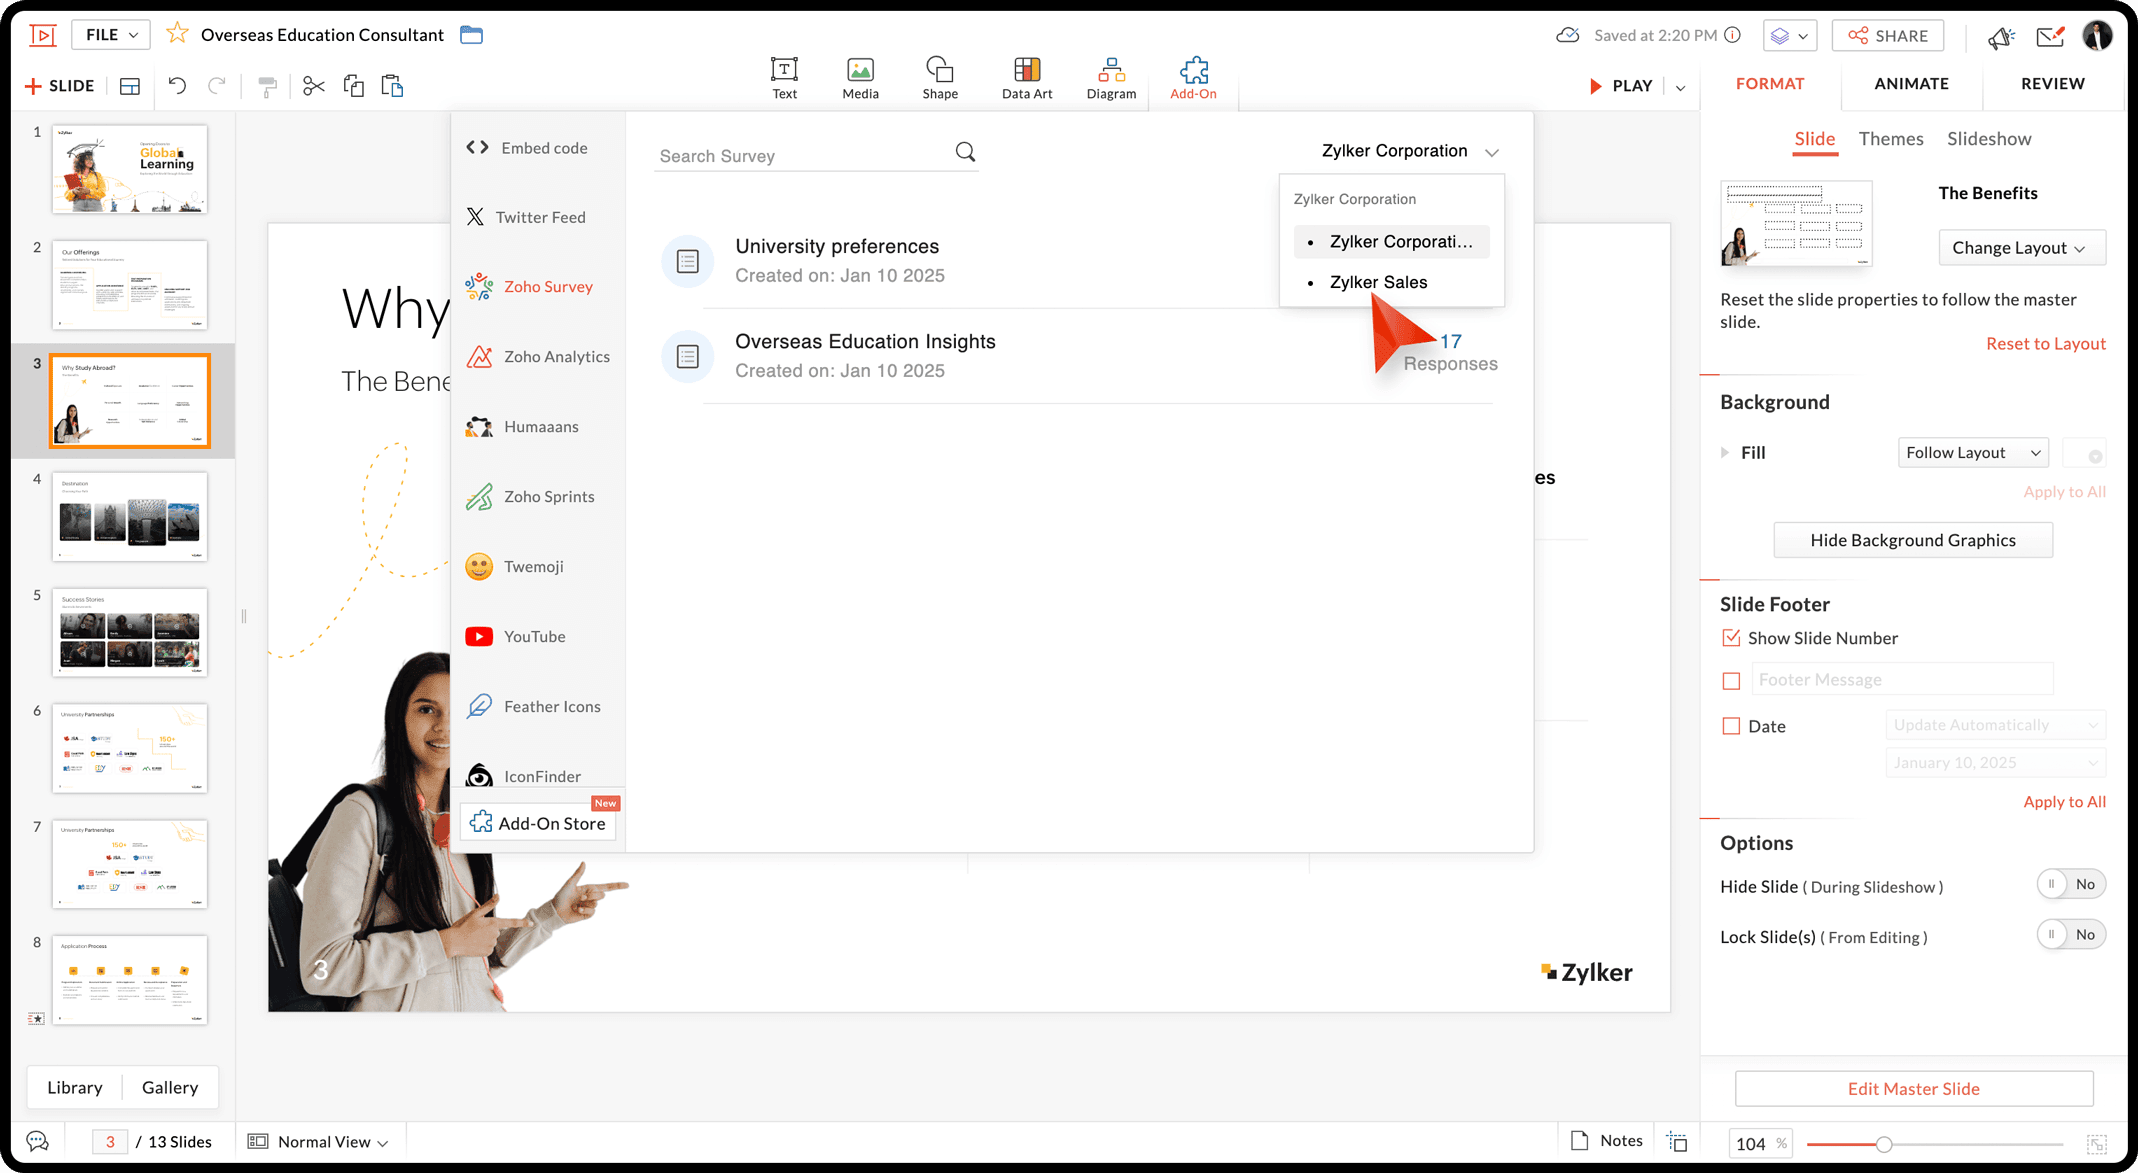
To get started, install the Zoho Survey add-on from the add-on store. Once installed, open the Add-On window, select Zoho Survey, and choose a department and the required survey that has been created in the department.
Next, pick the close-ended question(s) you want to insert as chart(s). Select a chart type from the drop-down and click Insert Reports to add them to your document.
Next, pick the close-ended question(s) you want to insert as chart(s). Select a chart type from the drop-down and click Insert Reports to add them to your document.

Your chart will now be added to the slide. You can format the charts as needed and even sync the data whenever there’s a change in Zoho Survey.
Refer to this help article to learn more about this feature.
Refer to this help article to learn more about this feature.